 EN
 Deutsch
 Español
 Français
 Italiano
 Português
 Nederlands
 Polski
 Bahasa Indonesia
 Русский
 Українська
 العربية
 עברית
 हिन्दी
 日本語
 한국어
2026-09-15 · Season 4
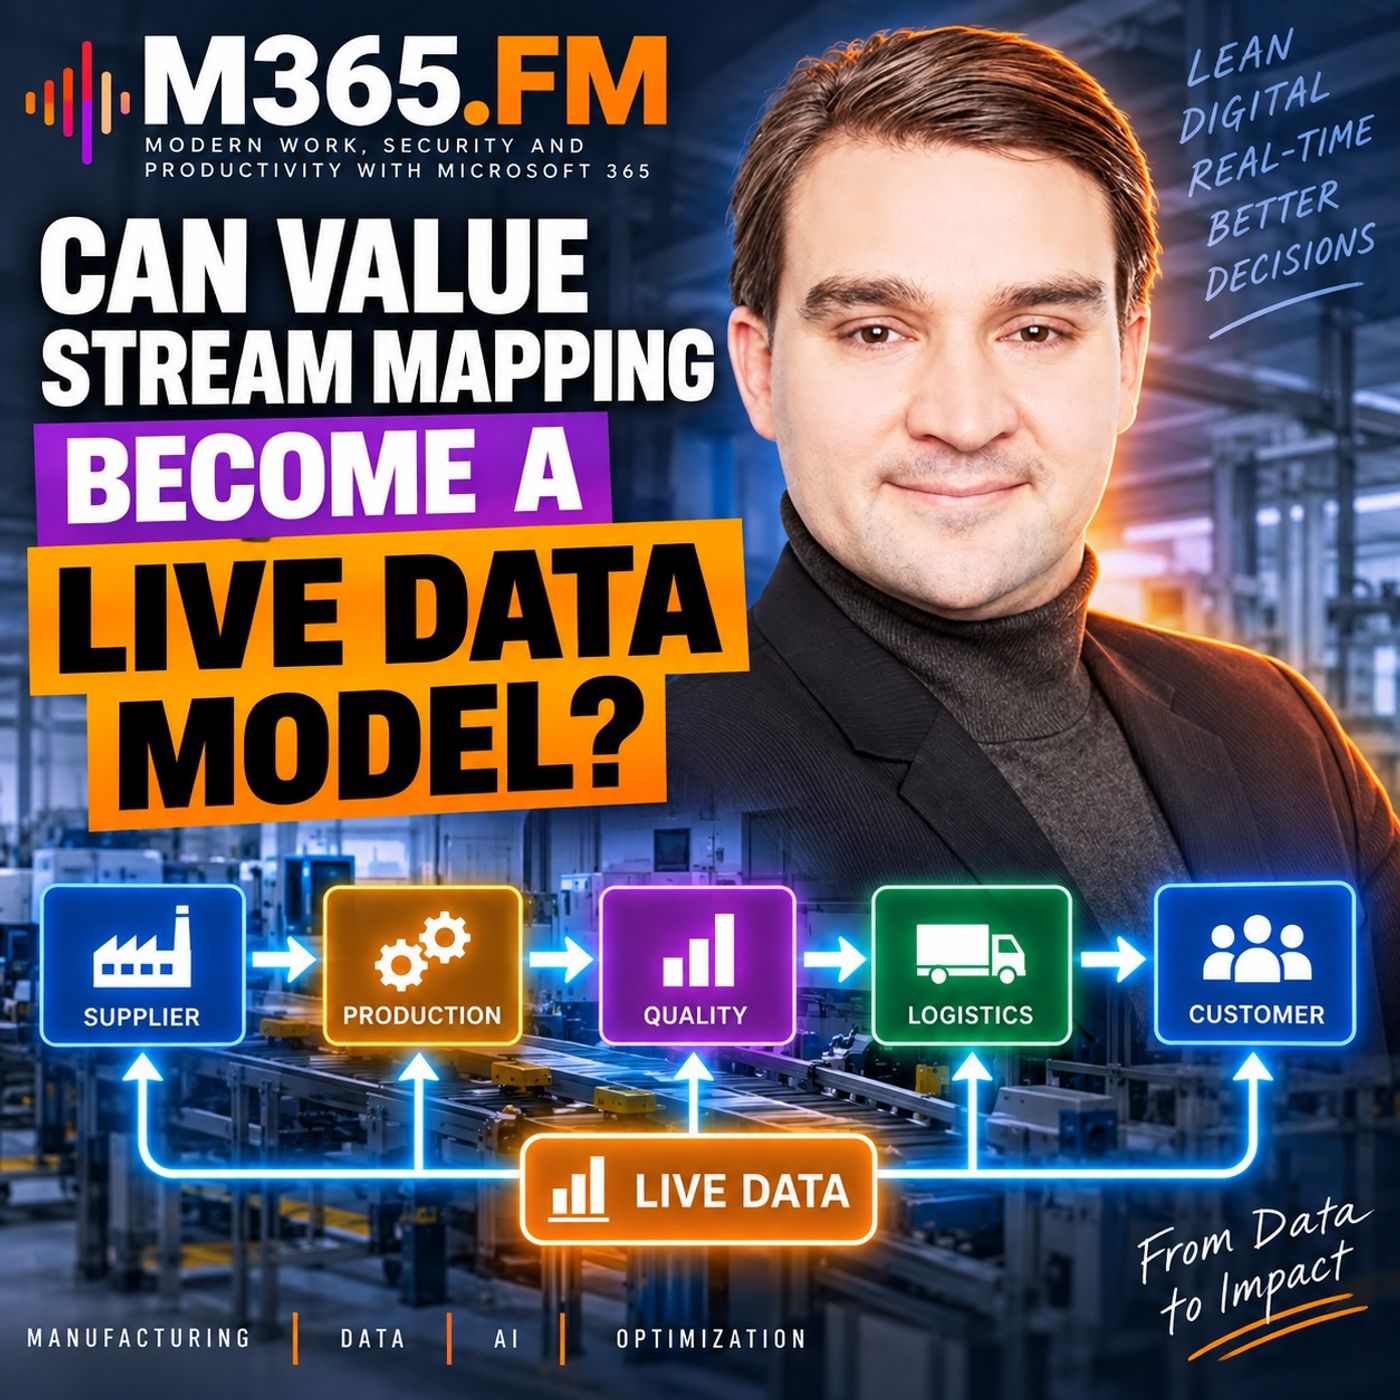
Can Value Stream Mapping Become a Live Data Model?
Show notes
Value Stream Mapping has been one of the most useful tools in Lean Manufacturing for understanding how material, information, and decisions move through a production system.But traditional Value Stream Mapping has a fundamental limitation.The factory keeps changing. The map does not.You can bring production, planning, quality, maintenance, supply chain, and operations into the same workshop. You can map cycle times, queues, batch sizes, handoffs, waiting times, information flows, and bottlenecks. At the end of the workshop, everyone may finally share the same picture of how the production system works.Then reality changes.A supplier shipment arrives late. A customer places an urgent order. A machine goes down. Quality blocks a batch. Maintenance removes a resource from production. A setup takes longer than expected. Material waits in the wrong location.The Value Stream Map hanging on the wall still describes yesterday's factory.So what if a Value Stream Map could become something more?In this episode, we explore how Value Stream Mapping could evolve from a static Lean Manufacturing document into a live manufacturing data model connected to ERP, MES, quality, maintenance, machine, and shop-floor data.The goal is not simply to digitize a Value Stream Map.The goal is to create a model that continuously reflects how production actually behaves. THE PROBLEM WITH STATIC VALUE STREAM MAPPING Traditional Value Stream Mapping captures an important snapshot of a production system.It helps teams understand the sequence of processes required to produce a product, but its real value goes much further than drawing boxes and arrows.A Value Stream Map can describe processing times, waiting times, queues, inventory, batch sizes, changeovers, information flows, replenishment signals, production control rules, and handoffs between different parts of the organization.That makes Value Stream Mapping extremely useful for understanding flow.But production is dynamic.The conditions captured during a workshop may already be different several days later.Demand changes.Resources become unavailable.Orders receive different priorities.Quality issues create rework.Material arrives late.Production schedules change.Actual cycle times differ from planning assumptions.These changes affect the real flow of production, but they are usually not reflected automatically in the Value Stream Map.This creates an interesting question for modern manufacturing:Can Value Stream Mapping become a continuously updated model of the factory? FROM VALUE STREAM MAP TO LIVE DATA MODEL A live Value Stream Model would be fundamentally different from simply putting a traditional Value Stream Map on a screen.Digitizing a diagram is relatively easy.Creating a model that understands the relationships between orders, operations, resources, materials, constraints, events, and production states is much harder.A live manufacturing model needs to understand questions such as:Where is an order right now?Which operation was completed last?What should happen next?Which resource is required?Is that resource actually available?Is material waiting?Is quality blocking production?Has maintenance reduced available capacity?Is the order waiting because of a physical constraint or because of an information delay?And most importantly:What evidence proves the current state of production?This moves Value Stream Mapping from documentation toward operational intelligence. ONE ORDER, MANY MANUFACTURING SYSTEMS Consider a make-to-order manufacturing environment.A customer order enters the business with a required delivery date.ERP creates the sales order, generates production requirements, checks material availability, and provides routing information describing the expected sequence of operations.But ERP only provides part of the picture.On the factory floor, the Manufacturing Execution System may dispatch work, record operator confirmations, track production progress, and maintain serial or batch information.Machine systems provide another perspective.A machining center might report whether it is running, idle, faulted, or currently being set up.A furnace might provide temperature information and cycle completion events.A test station might generate pass or fail results.Industrial gateways, historians, PLCs, and IoT systems may collect additional operational signals.Quality systems add another layer.An inspection result might place material on hold.A nonconformance could trigger rework.A quality release may happen hours after the physical inspection has already finished.Maintenance systems also influence the real production schedule.A machine might technically appear available in the planning system while scheduled maintenance makes it unavailable for several hours.Each system contains valuable information.But none of those systems alone necessarily describes the complete production flow. WHERE DID THE LEAD TIME ACTUALLY GO? Imagine an order that ships late.ERP knows when the order was created.ERP knows the planned delivery date.MES knows when individual operations were confirmed.Machine data may show when equipment was running.Quality systems know when inspections happened.Maintenance knows when resources were unavailable.But the planner asks a much simpler question:Why was this order late?Where did the lead time actually go?Maybe the order waited after machining.Maybe material was physically ready but transport did not move it.Maybe inspection was completed but the quality release happened hours later.Maybe a machine had capacity but the required material was waiting somewhere else.Maybe too much work was released upstream, creating a queue in front of the real constraint.Maybe the production schedule was already unrealistic when the order entered the shop floor.The data required to answer these questions may already exist.The problem is that it exists across multiple systems. ERP DATA IS NOT THE SAME AS PRODUCTION REALITY ERP systems are essential for manufacturing.They manage orders, materials, routings, requirements, inventory, purchasing, and many other business processes.But an ERP routing describes how production is expected to happen.It does not automatically describe what is physically happening on the factory floor right now.That distinction becomes critical when manufacturers want to optimize production.A production plan may say that an order can move to the next operation.The factory may say something completely different.The machine may be unavailable.Material may not have arrived.An operator may not be available.Quality may have blocked the batch.The previous operation may have taken longer than expected.Another urgent order may already occupy the resource.The planned production model and the actual production system can quickly diverge.A live Value Stream Model could help expose that difference. WHY MES ALONE IS NOT ENOUGH MES provides much deeper production visibility than ERP.It can track work orders, operations, confirmations, production progress, genealogy, and shop-floor execution.But MES also represents only part of the manufacturing environment.Production decisions may depend on information stored outside the MES.Quality systems.Maintenance systems.Warehouse systems.Industrial IoT platforms.Machine historians.Planning systems.Scheduling systems.ERP.Operator input.Transportation systems.Even spreadsheets may still contain operational information that influences production.A live manufacturing model therefore needs relationships between these systems rather than simply another isolated dashboard. REAL-TIME DASHBOARDS ARE NOT LIVE VALUE STREAMS Many digital manufacturing projects focus on real-time visibility.Machine states are collected.Production data enters a lakehouse.Dashboards display open orders.Power BI visualizes KPIs.Managers receive more current information.That can be extremely valuable.But real-time data alone does not automatically create a live Value Stream.Knowing that a machine is idle does not explain why material is waiting.Knowing that an order is open does not explain which constraint prevents it from progressing.Knowing that an operation is delayed does not automatically reveal whether the cause is capacity, material, quality, maintenance, sequencing, transportation, or information flow.A dashboard shows information.A model describes relationships.That distinction becomes increasingly important when manufacturers want to move from visibility toward optimization. CONNECTING IT AND OT DATA One of the biggest challenges in modern manufacturing is connecting Information Technology and Operational Technology.Business systems understand customers, orders, materials, costs, and delivery dates.Operational systems understand machines, process states, events, faults, temperatures, cycle times, and physical production.The production system sits between those worlds.A customer order eventually becomes physical work.A routing becomes machine operations.A production schedule becomes actual sequences.A planned cycle time becomes a measured cycle time.A planned resource becomes a real machine with downtime, maintenance, setups, and capacity constraints.A live Value Stream Model could provide a semantic layer connecting those perspectives. Become a supporter of this podcast: https://www.spreaker.com/podcast/m365-fm-microsoft-365-azure-cloud-power-platform-ai--6704921/support.
Apple Podcasts · Spotify · YouTube · YouTube Music · Deezer
Host: Mirko Peters
Related articles
Transcript
Read the full transcript
You know this one if you've been around manufacturing long enough? You run a value stream mapping workshop, production, planning, quality, maintenance, supply chain, everyone in the same room, and by the end of the day, you've got a shared picture of how work flows through a product family. Sticky notes everywhere, arrows connecting steps, someone writes cycle times, q times, batch sizes, hand off points. For a brief window, everybody can point at the same map and agree on the problem. Then Thursday shows up, a supplier shipment is late, a rush order gets dropped into the schedule, a machine stops unexpectedly, an operator finds a quality issue that sends work back through a prior step. The wall map, it doesn't budge, still describing the factory the way the team saw it on Monday. That doesn't mean the workshop was a waste, not at all. But it does expose a hard limit. A traditional value stream map captures a snapshot of the flow at one point in time. Production keeps moving after the workshop wraps and the map starts going stale almost immediately. So the real question isn't whether value stream mapping still matters, it absolutely does. The question is whether that map can become something more useful between workshops. Can it regenerate itself from the events already happening in your ERP, MES, quality systems, maintenance records and shop floor data? I'm not talking about another blinking screen full of machine tags. Nobody needs another screen full of machine tags. I mean a governed model of the value stream, one that can show how a defined product family is moving right now where it's waiting, what evidence supports that view and where the data still leaves gaps. That's a very different idea from digitizing a wall chart. It means taking the logic behind the workshop, the flow, the decisions, the handoffs, the rules, and connecting it to live operating data. Done well, the map stops being a document revised once a year. It becomes a working model that teams can test against the real factory every day. Let's step out of the workshop room and into a production flow where this gets concrete. A factory scenario, one order, many systems, picture a make to order plant, building a product family that needs several machining steps, an assembly step, inspection, and a final test before shipment. Some equipment connects through newer industrial gateways. Other machines have been running for years and only send limited data through a historian or a manual record. A customer order arrives with a due date. ERP creates the sales order, generates a work order, checks material planning, and provides the routing that says which operations should happen in what broad sequence. That's the business view. Down on the shop floor, the manufacturing execution system, your MES dispatches work, records operator confirmations, and tracks completion at each process step. Depending on how the plant runs, it might also hold serial or batch genealogy. Then you've got machine data, a machining center reports whether it's running, idle, faulted, or in setup. A furnace might report temperature state and cycle completion. A test station may record a pass or fail. Some of that data comes in quickly, some arrives late. Some isn't linked to a work order at all. Quality tells another part of the story. An inspection result might put a batch on hold, a non-conformance might trigger rework. A release might happen after someone reviews a result, sometimes hours after the physical inspection finished. Maintenance adds more context too because a resource might appear available in a planning system while a scheduled maintenance task blocks it for part of the shift. Now imagine a planner asking a simple question, where did the lead time go for this order? The order shipped late. ERP can tell the planner when it entered the plan and when the customer expected it. The MES can show that several operations were confirmed. Machine data may indicate the heat treatment furnace had capacity during part of the window. Quality can show that an inspection record exists. Yet none of those systems on their own can answer the full question. The original value stream map says this product family normally takes seven days from release to shipment. It includes estimates for processing time, waiting time, cues and maybe a few notes about common delays. But for the order in front of the planner, where did it actually wait? Did it sit after machining because transport never moved it to inspection? Did inspection finish but the batch stayed on quality hold because a release transaction came late? Did the furnace sit idle while material waited in the wrong buffer area? Or did the planner release too much work upstream? Creating a cue nobody saw until the due date came under pressure? Each system supplies evidence. None of them automatically gives you the flow. That's where many real-time visibility projects lose their way. They collect more signals, dump more data into a lake house, and build a Power BI report with current machine states and open orders. The report might even look very convincing. Then someone asks a basic production question, which orders are physically waiting before the constraint? Why are they waiting and who can remove the blockage? The answer usually involves a chain across systems. Order status from ERP. Last confirmed operation from MES, material or inspection status from quality, resource condition from maintenance, physical location from a scan, a transport system, or an operator's local knowledge. Without a common process model, you don't have a live value stream. You have several useful views that still need a person to connect the dots between IT and OT and people do connect those dots every day, often with Excel, phone calls, whiteboards and years of experience. That isn't a failure of the people, it's proof that the architecture hasn't captured the relationships they need. The live model we're talking about starts with one order, or one batch, and asks a disciplined question. What is moving through this process? Where is it now? What event proves that? What should have happened next? And what constraint blocks it if it hasn't moved? Before we try to automate any of that, we need to get clear on what a value stream map actually captures. What a value stream map really represents? I want to start with what a value stream map actually captures, and it's not just the root apart takes through the factory. It describes how work, material, information and decisions move from an upstream trigger through production and out to the customer. Think about a product family that starts with purchased material. The material arrives, someone receives it, and it waits until a production order releases it. Then it passes through machining, assembly, inspection, packing and shipment. When you say that sequence quickly, the physical roots sound simple. But the delays usually sit between those steps. A map captures process steps, but it also captures the cues before them. It asks how long material waits, how often the process changes over, what batch size moves forward, and where work piles up when the next resource can't take it. That view turns a sequence of operations into a flow. Now material flow is only one part of it. A value stream map also follows information flow. Someone receives customer demand, planning translates that demand into orders, and a scheduling rule releases work. A Kanban card, a scan, a planner decision, or a replenishment signal tells the next area that it can act. Those signals affect the physical flow as much as a machine cycle does. Say an assembly cell can build a unit in 20 minutes, but its material release happens only once per day. The cell's cycle time hasn't changed. Yet the lead time can stretch because the information rule creates a weight before the work even reaches the cell. That's why a map needs both sides of the process, what moves and what tells it to move. In practical terms, the map also records facts that people often treat as separate performance measures. Cycle time, change over time, up time, and first pass yield all matter because rework sends work through a different path and changes demand on the same resources. Work in process, WIP matters for the same reason. It's not just inventory sitting on a report. WIP describes work that has entered the flow, but hasn't reached the customer. It can point to a queue, a blocked handoff, an unplanned hold, or an upstream release rule that no longer fits the capacity downstream. Still, the numbers don't explain the full process by themselves. A proper value stream map includes the human knowledge around the process. An operator knows that a batchmarked complete often waits for a forklift at shift change. A quality engineer knows that a certain product revision needs a manual review even though the routing looks standard. A planner knows that two work centers look interchangeable in ERP, but one needs a tool that's currently tied up somewhere else. Those details aren't side notes, they describe the actual operating rules. Here's the thing. I think a value stream map works best as a shared operating hypothesis. The team puts a statement on the table. This is how the product family appears to flow. These are the delays we think matter and these are the rules that shape the result. Then the team tests that statement. If the map shows a large queue before final test, people need to ask whether the queue is real, how it forms, which products enter it, and whether the reported count matches the physical area. If the team claims that a process runs in single piece flow but work moves in trays of 10 because handling requires it, the map should capture the tray. Otherwise it describes an intention, not the process. That distinction can feel uncomfortable. Good. It means the workshop is doing its job. A map can show where the business has chosen a rule, where a constrained forces a rule, and where nobody can explain why the rule exists anymore. Manufacturing has plenty of those. A buffer often starts as a practical response to a problem, then becomes permanent because everyone assumes it belongs there. For a live model, this gives us a useful boundary. We aren't trying to turn every sticky note into a database field. Some notes record observations, some record assumptions, and some record a question that the team still needs to investigate. What we do need to separate is the maps logic from the sources that could refresh parts of it. The map tells us which flow, weights, handoffs, and decisions matter. ERP, MES, quality records, and shop floor events may provide evidence about those things but they don't define the meaning on their own. Why workshop snapshots still matter? Before we turn the map into a data model, let me defend the workshop for a moment. A map built only from system data can look tidy and still miss the part of the process that people actually manage every day. Put an operator, planner, quality engineer, maintenance lead, and material handler in the same room, and you quickly find that they don't always use the same words for the same state. Even when each person understands their own part of the work perfectly well. The planner might call an order released when ERP creates the work order, the shop floor supervisor might call it released only when material and paperwork reach the cell. Quality may see the same batch as incomplete until a release decision clears it. None of those views is foolish. They answer different operational questions. A workshop makes those differences visible. That matters because hidden handoffs cause a lot of weighting. They often sit outside the formal routing too, someone prints a traveler, someone moves a container, a fork lift driver collects a batch, when a route allows it, and a technician checks a fixture before setup starts. Each task may take only a few minutes, but the weight around it can take much longer. Most transactional systems record the formal milestones. They don't always record the practical work that connects one milestone to the next. This is where direct observation shows its value. Lean teams often call it "Gemba", which simply means going to the place where the work happens. You walk the route with the people doing the work, follow a real order or batch and ask simple questions. Where do you put it when this step ends? How do you know it can move? Who notices when it cannot move? Those questions can expose a gap between the process design and the working process. Say a system record shows that an operation completes a 10 in the morning and the next operation starts a 2 in the afternoon. A model can calculate a 4 hour interval. Only the people at the process can tell you whether that interval came from a planned batch rule, a normal collection round, a missing inspection release, or a workaround everyone uses because a scanner sits at the wrong end of the building. That distinction shapes what you improve. If the delay comes from a deliberate batch rule, the discussion may focus on whether that rule still fits demand and capacity. If the delay comes from a recurring workaround, the discussion may focus on the handoff, the equipment layout, or the transaction design. The data can show the symptom. Gamber helps explain the mechanism. Workshops also create something systems don't create on their own. Shared ownership of a process question. When maintenance explains why a machine's reported available state doesn't mean it can run every product. And quality explains where a hold enters the flow, the group starts building a common language. That language matters later. When someone asks the data team to calculate wait time or when an operations lead challenges a number in a flow review. Without that discussion, a live model can become a technical interpretation of a process that nobody agreed to. I've seen teams assume that more telemetry will settle an argument. Sometimes it helps. But a timestamp doesn't settle what ready for next operation means, who owns that state or whether physical material can move before a quality decision. Sensors are good at reporting signals. They don't negotiate operating definitions. People do. There's another reason workshops remain useful. They surface questions that nobody thought to put into a system. Why does this product family take a different route on night shift? Why do certain parts sit in a marked area with no digital status? Why does a planner expedite one order while another order with the same due date stays in queue? Those aren't defects in a workshop. They are the work list. A live value stream map should carry that learning forward. It should record which steps, states, handoffs and rules the team considers meaningful, then attach evidence from operating data where that evidence exists. Where evidence doesn't exist, the gap should remain visible instead of being quietly replaced by a guest number. That gives the model an honest starting point. The workshop doesn't disappear when data enters the picture. It changes role. It becomes the place where people define the flow, test what the model claims and correct the model when the factory proves it wrong. But a workshop can only capture what the team observes during that period. Daily production changes faster than any wall map can keep up with. And that's where the next problem begins. The decay problem. Why maps stop matching production? Here's the problem most manufacturers don't talk about. A value stream map can be spot on when the workshop ends and become misleading just a few weeks later. Production doesn't hold still while the map waits for its next review. Arroading changes because engineering approved a new product revision, an alternate machine picks up work because the usual one needs repair, and a batch rule shifts because demand changed or a supplier altered pack size. Each choice made sense on its own. But together they rewrite the path, work takes through the plant. Temporary changes cause even more trouble. Someone sets up a buffer near a machine because material keeps arriving at the wrong time. A supervisor roots work through a different inspection station while someone's out. An operator combines two batches to skip a setup. None of that shows up in the official process definition yet it shapes lead time more than the routing in ERP ever does. So you get two processes, the one everyone approved and the one people actually used to keep production moving. That gap doesn't mean anyone did something wrong. Factories adapt because they have to. But when the map only records the approved route, it stops describing the flow people need to improve. That gap gets wider when data gets corrected after the fact. An operator confirms an operation at the end of a shift instead of when the work actually finished. A planner closes and reopens a work order to fix a master data issue. Someone moves material physically, then posts the transaction later when a terminal frees up. System records still supports traceability and reporting, but the timestamps no longer describe the real sequence of work. Time studies age the same way. A cycle time observation taken during one product mix, staffing level and machine condition becomes a poor guide once any of those conditions shift. A cell process is a stable product family well for months, then gets hit with a higher share of complex variance. The map still carries the old average, while the people on the floor deal with longer setups, extra checks and new cues. That's why an annual mapping event often turns into a historical record. It might still help a team remember how they framed the problem. It can show the original assumptions and the improvement ideas that came from the session. But it rarely works as a daily planning tool once production has changed around it. Then Excel steps in, that's not a joke at Excel's expense. A planner needs a place to combine an urgent order list, a material status from ERP, a quality hold, a machine note and knowledge from a supervisor. The spreadsheet fills a real gap because the official systems don't show the current flow in one place. Over time though, the spreadsheet becomes another version of the factory. One team trust the ERP dates, another trust the MS status, a third works from a manually updated tracker because it includes the missing exceptions. All three might contain useful information, but they disagree on where an order sits and what should happen next. That disagreement creates its own delay. For anyone can act, they need to settle which version describes the work, a live value stream model doesn't remove change from production. It should do the opposite. It should treat routing changes, alternate resources, revised batch rules and exception paths as events or rules that need recording, checking and understanding in context. That means the model needs a way to distinguish a planned process change from an informal workaround. It also needs to retain the reason when a team chooses a temporary path, because temporary paths have a way of becoming permanent without anyone formally deciding they should. Think about the practical question of production manager asks on a tough day. Does this delay come from the process we designed or from the process we're actually running today? A static map usually can't answer that without another workshop. Operating data can help, provided the model knows what root, resource, batch rule and time period is comparing. There's a temptation to respond by connecting every sensor and refreshing everything every second. That sounds modern and it produces a lot of activity. It doesn't automatically produce a better view of flow. Before attaching the word live to the map, we need to decide what live should mean for the decisions people actually need to make. Live does not mean every second. When people hear a leave data model, they picture a screen that updates every few seconds. Machine icons change color, counters move and alerts appear. It feels impressive for about five minutes, then the production meeting starts and someone asks what action the team should actually take. That question changes the design. A live model should refresh at the pace of the decision it supports, because different decisions run on different clocks and the data behind them arrives with different levels of certainty. A shift supervisor needs to know which orders are blocked before the next handover. That might require updates during the shift, especially when a hold, material shortage or resource stop creates a risk that grows with time. A planner working on tomorrow's schedule needs a current view several times a day, but they don't need a sensor signal from two seconds ago if the order, material and quality state only update through confirmed business events. Continuous improvement work moves more slowly. A team looking for recurring weight patterns reviews the past week or month, where event completeness and consistent definitions matter more than instant updates. A fast refresh can't repair a missing handoff record. It just presents the missing record more often, so live isn't one refresh rate. Think of it as a current view that declares its own freshness. When someone sees that an order has waited before final test for six hours, they should also know when the supporting records last arrived, which source supplied them and whether the model inferred part of the sequence from other evidence. That changes the conversation. Instead of treating every number as exact, the team can ask whether the information is current enough and reliable enough for the decision in front of them. There are cases where event-driven updates make sense. A quality hold can change what production may legally or safely do with a batch. A machine failure at a known constraint affects a large amount of work quickly. A material arrival may unblock an order that planning had marked at risk. Those events deserve quick attention, but the model still needs context around them. A machine state on its own tells you about an asset. It doesn't tell you whether that asset runs the product family you care about, whether the right material is available, whether an operator with the required skill is present, or whether the next operation can accept the output. Near real-time data earns its place when it connects to a specific flow question. Take a resource that changes from running to faulted. The live model doesn't need to panic and message everyone. It needs to ask which current orders use that resource, whether any alternate route exists, how much Q sits upstream, and whether a due date now faces risk. That chain takes more than a rapid signal. It takes a model that knows how the signal relates to work. There's a human limit here too. If every state change becomes an alert, people stop seeing alerts. Factories already have enough ways to tell someone that something needs attention. The job isn't to add more noise, the job is to point attention at the flow issue where a person can act. That might mean one alert at shift handover. These orders have exceeded their expected weight before inspection, and the model has evidence that material is ready, but the release hasn't happened. It might mean a daily flow review that compares open work against the intended route and spots orders stuck between two steps longer than expected. Or it might mean a weekly review where the team checks whether the same handoff keeps generating avoidable delay. All of those count as live, because the model regenerates its view from current operating evidence rather than relying on a manual estimate entered months ago. The word live should also include honesty about what isn't current. Some manual stations reported the end of a batch. Some quality decisions happen outside the main transaction path. Some equipment signals reach the data platform after a delay. The model should show those limits clearly. A late event isn't useless. It still improves the historical flow record. But it shouldn't pretend to describe the current state when it doesn't. So the aim isn't a blinking dashboard that tracks every movement in the factory. The aim is regenerated evidence, timed for the decision, tied back to the source and clear about its assumptions. That brings us to a distinction that causes a lot of confusion. A dashboard can display flow measures, but displaying a measure isn't the same as modeling the process that created it. Dashboard, process model and digital twin. Dashboards and process models can draw from the same data, but they solve different problems. I hope a dashboard takes data and turns it into measures, trends and exceptions. It tells you late orders went up, a Q-green year work center or first pass yield dipped last shift. For a supervisor or planner, that's useful because it raises a question. But here's where the dashboard falls short. It doesn't carry the full meaning behind that number. Take a Q-count. A report shows 40 orders waiting before a process sorted by due date, product, family or age. Without a model describing the orders, the operation they need, their location, the resource choices and the rules for movement that report can't explain why they're sitting there. The dashboard shows the symptom. The process model holds the structure behind it. Think of a process model as named things with declared relationships and order relates to a product which follows a root. A step can happen on one or more resources per rules. An event records something happening to that order at a particular time and state. Time matters too. A step might have changed last month, a machine gained or lost approval for a product family. A quality rule applies to a specific revision. If your model treats those relationships as permanent, it eventually tells a clean but false story about the flow. This sounds technical, but it's not. In practical terms, you give the system enough structure to answer normal factory questions without someone rebuilding the story by hand. What's waiting before inspection? What needs to happen before it moves? Which resource can do the next operation? What prevents that resource from taking it? Those aren't chart answers. They come from relationships and rules. A live-value stream map sits in an unusual place. It crosses more than the material root. It needs the flow, but also the information signals that release or stop work, and the decisions that change priority or root. That's why copying a VSM into a reporting tool rarely works. You reproduce boxes and arrows and attach measures. The result looks familiar, but if those boxes don't connect to a model of orders, events, resources and states, someone still interprets every change manually. The picture when digital, the process didn't. Digital Twin language enters the discussion here, so let's put it in a useful place. A digital twin is an operational representation linked to data about state and relationships. In manufacturing, that's an asset, cell, material, path or group of resources. It helps when you need to reason about how things relate as conditions change. It's not required for every value stream problem. If you're concerned about late order flow through a product family, you need a process model before you need a twin. Calling every data set a digital twin doesn't add much. Manufacturing survived without renaming every table. Still, twin concepts help when physical and functional structure really matters. A heat treatment area includes furnaces, loading stations, staging, handling equipment and operating constraints. If work moves through different paths based on equipment, state or material location, modeling those relationships supports the value stream view. The scope matters more than the label. A useful twin describes the part tied to a real decision. It doesn't need to be a perfect digital copy of the entire plant. That ambition produces a large model with unclear ownership while the planner still calls the shop floor to find one missing batch. Another layer helps when relationships change often or stretch across systems. That's a knowledge graph. It stores things as connected entities rather than flat tables. It can represent a work order containing a batch needing an operation using a qualified resource with a quality hold blocking movement. It retains the links. Again, not a magic label. Relational stores are fine for transactions and reporting. A graph earns its place when you need to follow changing relationships, like tracing which open orders a resource failure effects or which downstream steps depend on a held lot. Here's the breakdown. A dashboard tells you what changed. A process model explains what things are and how they connect. A digital twin represents part of the operation where state and relationships matter. A knowledge graph navigates relationships messy and flat reports. Once those pieces exist, you can follow a single production order through the model instead of staring at a row in a report. Start with the unit of flow. If you want to regenerate a value stream from operating data, you need to answer one question before you connect anything. What exactly is flowing? That sounds obvious, but it changes plant to plant, sometimes product family to product family, one flow uses a production order. Another uses a batch for high-trace products is a serialized unit. In a pull system, the practical unit could be a container or can-bun card. Choose the unit that matches the decision. Say a planner needs late customer orders in a make-to-order plant. The work order gives due date quantity rooting and status. But if that order splits across machines and rejoins at final assembly, one order level status hides a real problem. One part waits while the rest looks on track, then the model may need child batches or sub-orders. A process engineer in heat treatment has a different question. Furnace's run loads not parts. Material enters his lots, shares a cycle, then splits. If your model only finished orders, you see something weighted, but not that a load weighted for enough compatible material to fill the batch. The unit of flow must match where work actually moves. That doesn't mean track every component at serial level because you can. Material traceability adds volume, scans, exceptions and effort when an identifier goes missing. If a daily flow review only needs to know whether a batch reached inspection, batch level is enough. Traceability should earn its cost through a decision. Set the boundary around a product family, define where the value stream starts and ends. For one team, its customer order release. For another, its material receipt, because supply availability drives delay. It might be shipment or a handoff to a distribution site. Be clear about the demand signal. A customer order, forecast, replenishment signal or internal transfer request triggers work. Each creating a different flow question. You can't judge whether work moves as intended unless you know what started the demand and what commitment the process is trying to meet. Deal with the messy cases early, not after the report looks good. Order split, batches merge. Quality issues send work back. Quantities get scrapped and replaced. Partial quantities move ahead while the rest waits. These aren't edge cases. They're normal manufacturing. The model needs parent and child relationships. Imagine in order for 100 units after machining 60 move forward 40 enter rework. If the model records only in process, it hides the available quantity and rework burden. The planner assumes the full order reaches final assembly. The floor knows only 60 move. That gets expensive fast. Identifiers hold the chain together. ERP uses a work order. MES uses an execution ID. Quality uses a lot number. A machine interface knows a pallet ID. The live model doesn't need the same identifier from day one, but it does need a governed way to connect them. Without that, you match records by guesswork. Sometimes the connection is direct. Same batch number in ERP, MES and quality. Sometimes you need a cross reference table, scan event, or dispatch record linking a pallet to an order and operation. Where uncertain, the model should keep that visible rather than silently joining wrong records. False certainty is worse than a visible gap. This work feels less exciting than AI or digital twins, but it's where the useful work starts. If your system can't tell what unit moved, split, weighted, merged, or returned for rework, it can't regenerate a flow production team's trust. Once the unit of flow is clear, we can connect it to the structure that explains what the unit needs to become, which work it must pass through, and which resources can carry out that work. Product process resource, the structural backbone. Once you know what's flowing, you need a structure that actually explains it. In manufacturing, I keep coming back to three plane terms, product, process, and resource. Product is the thing moving through your value stream. A finished unit, a batch, a subassembly, or a material lot. But if you want to understand the flow, that record needs more than just a name and part number, it needs the product revision that was current when work started, the required quantity and due date, and often the customer or project commitment behind the process. For regulated products, you also need the material lot, serial range, or approval state that constrains what can happen next. A part number alone doesn't tell you enough. Take two orders for what looks like the same part. One follows revision A, the other revision B, which adds an inspection step, and a tighter machining tolerance. If your model treats both as identical because the part number matches, it sees a delay but can't explain why one order took longer. So product identity has to include the version that production is actually building. Process covers the work needed to turn that product into its next usable state. Operations, sequence rules, inspection points, and what happens when things don't go as planned. That last part matters more than most process models admit. A standard routing might say machining, wash, heat treatment, inspection, then assembly. But actual production also needs rework rules. If inspection finds a problem, does the batch go back to machining, does it need a fresh inspection after rework? Can a partial quantity move ahead while the rest waits? Those aren't exceptions. They're process rules. The process also tells you which steps need strict order and which can run in parallel. Surface treatment might need to finish before final assembly, but documentation review can happen while a batch waits for transport. That difference changes how you calculate waiting and judge risk against the due date. Resource covers everything that can carry out, support, or constrain the process. Most people start with machines and machines do matter. But a resource can also be a tool, fixture, operator with a certain qualification, production cell, staging area, test rig, furnace slot, or transport route between buildings. This is where a clean routing often becomes too simple for real operations. ERP might show two work centers as alternatives. On the floor, one machine only handles the older revision. The other can run both revisions, but requires a specific fixture. And that fixture is already booked for another order. Neither machine does any good if the qualified operator isn't there. Or the output buffer is full. Capacity isn't just machine capacity. The real structural work comes from the relations between product, process, and resource. You need to describe which resource can perform which process for which product and under what conditions. Say a work order for product revision B needs operation 30, heat treatment, furnace. A can do that operation for revision B. Furnace B can only process revision A until engineering finishes a qualification step. Both furnaces might look available in a broad capacity view, but only one is a real option for that order. That relation needs a period of validity too. Routing's change tools go out of service, operator qualifications expire or expand, engineering approves new resources for a product family. If your model only stores the current answer to can this resource run this process, it rewrites history every time something changes. Then you can no longer explain a historical delay properly. A planner reviews an order from last month and wonders why it waited for the usual machine instead of an alternate. And if that alternate only got approved this week, a model without effective dates would claim the planner had a choice. They didn't, the choice didn't exist at the time. Time validity keeps the model honest. Each relation needs a start date and, where relevant and end date. That doesn't mean every plant needs a massive master data project before starting. It means the model should preserve the conditions that shaped a decision when it was made. The same applies to resources involving people. A skilled operator isn't a generic capacity unit. They may hold approval for a specific process, product revision, safety task or test method. Your live value stream model should only represent restrictions where they affected decision. Otherwise, you're modeling the entire org chart while the late order still waits near the machine. Keep the model tied to the flow question. A good product process resource structure lets you ask precise questions without pretending the factory runs like a fixed routing diagram. What product or batch needs work, which operation should it go to next? Which resources can legally and practically perform that operation right now? What's changed in the rule since the order started? That is enough structure to connect the movement of work to the conditions around it. It also exposes a problem that normal data feeds often hide. A source system can send a perfectly valid event, but without product process resource context, that event can still create a false picture of flow. Data without context creates false flow. A source event can be accurate and still tell the wrong story about flow. Take a common MES event, operation complete. The operator confirms the machine finished, the system records the quantity and the order status moves forward. That may be correct from an execution standpoint, but completion doesn't prove physical movement. The parts might still be sitting at the machine because the container is full, the next area has no space, or the forklift route hasn't run yet. If your live model treats operation complete as available at the next step, it shortens the recorded weight and hides the handoff that needs attention. You haven't found flow, you've skipped part of it. Machine data can create the same problem from the other direction. A machine reports running, idle, faulted, or in setup. Those states help explain capacity and equipment behavior, but a running signal doesn't identify the order, batch, or product revision on that machine unless another system supplies the link. Without dispatch context, a running machine is just a running machine. Imagine a milling center that runs most of a shift. The dashboard shows healthy utilization, but a late customer order waits in the queue because the machine is processing another product family with a higher local priority. The asset looks productive, but the value stream still fails the customer commitment. That doesn't mean the machine signal is wrong. It answers an asset question, but the planner needs an order flow question. ERP creates another kind of false flow. It holds routing's planned dates, material demand, and work order status, giving planning a formal view of how work should move. Yet ERP usually doesn't know if the queue at a work center fits the physical space if a technician stops a resource for setup or if an operator parked work in a temporary staging area. It knows the plan, not the work as it unfolds. This is why planned dates should never become evidence of actual flow. A plan tells the model what people expected. That's useful, but actual movement needs actual events and the model needs rules that keep planned intentions separate from observed execution. Status fields cause even more trouble because the same word can mean different things in different systems. Released might mean the commercial order is approved in ERP. In MS, it could mean the order can appear in a dispatch list. On the floor, a supervisor uses it only when material, tools, documents, and labor all permit work to begin. Each meaning works inside its own system. Troubles starts when an integration treats them as the same state without asking which operational condition it actually represents. The same issue appears with complete. Does it mean the machine cycle ended? The operator confirmed the quantity, quality accepted it, the batch entered the next buffer, or someone just posted the transaction. Those differences aren't minor wording problems. They change lead time calculations, queue counts, and escalation rules. People often call this a data quality issue and sometimes it is. Missing scans, duplicate messages, late records need attention. But many apparent data quality problems start earlier with an unclear business definition. If two teams can't agree on when an order becomes ready for the next operation, no pipeline can clearly calculate the weight between operations. It can only automate the disagreement. So before calculating lead time, the team needs a shared language for the states and events that define movement. The shared language layer, here's the real challenge with live value streams. You need a shared language before you need more data. People have to know what each event means when it enters the model because a clean timestamp on an unclear state still gives you a bad flow measure. Take the word released. In a live model, the team might define it as the point when an order can actually enter production, not simply when ERP creates it. That definition could require material allocation and approved rooting and a valid production instruction. Or the team may decide those are separate states. Either choice works as long as everyone uses the same meaning. That same discipline applies to start it, complete good quantity, scrap, hold, and shipped. These terms sound straightforward until you ask where the proof comes from and who owns the event. Start it, could mean an operator logged into a job, material entered a machine, or the first good unit came off the process. For a manual assembly step, an operator login may be the best available evidence. For an automated line, a machine cycle tied to a batch ID may say more. The model needs to state which one it accepts. Complete needs similar attention. A process can finish physically at one time, receive an MES confirmation later and get quality released later again. Those are three separate moments. If the model merges them, it removes the weight that might explain why work stopped moving. Time itself needs definitions too. Event time means when something happened in the process. Record posting time means when a system stored the event, plan time means when the schedule expected it to happen. All three can belong in the same model, but they should never compete for the same label. Say an operator finishes a batch just before shift end and confirms it in MES after the next shift begins. If you only use the posting time, the model could place the completion in the wrong shift and calculate a shorter or longer weight than the physical process created. If the event time is unknown, the model should admit that and use the posting time as evidence, but it should label the limitation. This also means deciding who owns master data. Product definitions usually come from engineering or ERP master data processes. Routing ownership may sit with manufacturing engineering. Work center definitions might involve planning and operations. Shift calendars need an owner too, because a weight across a weekend means something different from a weight during an open production window. You don't need a giant governance project to start this work, but you do need named people or teams who can answer a basic question when this definition changes, who approves the change and how does the model learn about it. That's where data contracts help. A data contract is an agreement between the source system owner and the live value stream model. It states what data arrives, what each field means, how often it arrives, which identifier connects it to the flow, and what happens when a source sends late, missing or corrected records. For an MES event, the contract might state that an operation completion includes the work order, operation number, quantity, resource, event time, where known, and posting time. It may also state whether a correction replaces the original event or arrives as a new record, those details sound dry until a planner challenges a late order report and nobody can explain why this data is changed. A contract gives the team a place to look. It also stops a common problem in data projects. Someone publishes a field named Status, another team reads it as Shopfloor Status, and months later everyone discovers it only describes an interface state. The integration worked, but the meaning didn't. Governance, in this context, isn't a committee that blocks production work with forms. It's a working agreement about meaning, ownership, and change. That agreement gives people permission to challenge a number, correct a definition, and preserve the reason behind the correction. This creates a stable base for the next step. Once the team agrees on what an order release, operation finish, quality hold, or shipment actually means the map no longer depends only on manual estimates. It can begin rebuilding its flow from the events the factory already produces, from events to a regenerated value stream. Once those definitions exist, the work becomes more concrete. You stop asking people to update a map by hand every time production changes, and you start asking which operating events can prove that work entered, moved through, paused in, or left the value stream. For a make to order flow, the first event may be order release, and material arrival can tell you when the order became physically possible. An operation start and operation end, show work through a process step, a quality hold changes what can move next, a movement scan can show a handoff, and shipment closes the flow from the customer's point of view. Not every plant records every event today, and that's fine. The aim isn't to invent a perfect event trail on day one. It's to find the events that let you answer one real question with more evidence than the workshop snapshot could provide. Each event needs a consistent shape when it reaches the model. At a minimum, it should connect to the unit of flow, an order or batch, and identify the operation where relevant, the resource involved, the quantity affected, the time, and the state that changed. Take an operation completion. The raw MES message may contain a transaction code, an employee ID, a machine number, and several fields that only matter inside that application. The flow model translates that into a business event, batch 7812, completed operation 20 on resource C and C04, for a stated quantity at a known event time or posting time. That translation preserves the source record while giving the event a form, the wider flow can use. A quality system may record a hold against the material lot rather than a work order, a transport scan may record a container ID, a maintenance system may record that a furnace became unavailable without naming any order at all. The model doesn't force those sources to become the same system. It links them through the agreed identifiers and relationships. This is where the value stream view starts to regenerate. The model reads the events in sequence, applies the process rules, and builds a current interpretation of where works it's in the flow, picture a batch that completes machining at 0940. A movement event places it in inspection at 1005, inspection starts at 1320, the model can derive the time between arrival and inspection start as a weight. Nobody needs to type 3 hours and 15 minutes into a box on a map. But that calculation needs care, a gap between two events isn't automatically a queue. It could include planned non-working time, a quality review, a batch rule, transport, or simply an event that never arrived. So the model should calculate an interval, then classify it only when the process rules and evidence support that classification. This is one reason raw events and calculated flow measures should stay separate. Raw events tell you what each source recorded and remain available for traceability, replay and later correction. Calculated measures, wait time, touch time, queue age, or lead time come from declared rules that interpret those events. If the team changes a rule, it can regenerate the measure without rewriting the source history. That separation also helps when someone challenges the result. A planar might see that a batch appears to have waited too long before final test. Instead of debating a colored status, they can trace the claim back to the last known movement, the next confirmed operation start, the process calendar, and the rule that calculated the interval. The system can show its working. A regenerated map doesn't need to mimic the wall chart exactly. It needs to represent the same flow questions with current evidence. For each process step, it may calculate current work in progress, recent wage ranges, completion patterns, quality holds, or the age of open work. For each hand off, it may show whether the movement has a confirmed event, an inferred state, or a gap. That last point matters. A live model should carry confidence with the measure, not hide uncertainty behind a precise looking number. Suppose the system sees that a batch completed operation 30, but it has no movement scan and no start event from operation 40. The model can state that the batch appears to remain between those steps based on the latest confirmed evidence, but it should not confidently assign it to a physical queue, unless the process records support that claim. A useful model can say we don't know. That may sound less satisfying than a full screen of exact counts, but in production it's usually more useful. It directs the team toward a missing transaction, an unclear hand off, or a part of the process that needs better evidence before people automate decisions around it. Over time, the model can rebuild both a current state view and a historical view from the same event chain. The current view supports flow review, and the historical view lets teams test whether a weight repeats at the same process, shift, product revision, or hand off. But factory events rarely arrive in the clean sequence we just described. They show up late, twice, without a scan, or attached to the wrong context. That imperfect evidence needs to become part of the model, not something the model quietly ignores. Event quality, the shop floor is not a lab. Let's be honest. Factory events don't arrive like need test data from a controlled system. Production keeps moving while scanners lose connection, people switch shifts, terminals, queue transactions, and a batch takes a route nobody planned that morning. That's not failure, that's normal factory life. A missing scan can mean several things, maybe the operator forgot it, maybe the scanner battery died, maybe the container moved through a handoff that never had a scanning point. The model shouldn't turn each missing scan into a claim that the batch never moved. It needs to separate confirmed evidence from inferred state. Late confirmations create a different problem. A person may complete work at the machine, then enter the result later, because they were handling a quality issue or helping with a change over. The recorded time then describes when the system received the confirmation not always when the work happened, where the source supplies both times, keep both. Where it doesn't, the model needs a clear rule about which time it uses and how much confidence it assigns to the result. Duplicates happen too, especially when an interface retreats after a connection drop. A message can arrive twice, or a source system can resend a whole group of records because it can't confirm delivery. If the flow model counts both, a queue may seem to shrink twice, or a completion count may exceed the order quantity that calls for event identity and deduplication rules. The model needs to know whether it received a new business event, a correction, or the same event again. Clock drift can be harder to spot because every record may look valid on its own. A gateway clock runs a few minutes behind, a machine controller uses a local time setting. MES writes in server time, quality records the decision when someone saves the screen, put those records into one sequence without checking time sources, and the model may claim that inspection began before the batch arrived. The factory did not bend time, the records disagree. Manual stations need extra care because the available evidence often comes from people rather than equipment. A skilled operator may do excellent work with a traveler, a paper check sheet, or a simple end of batch confirmation. Trying to force every action into instant digital events can add burden without improving the decision. Start with the handoffs that create uncertainty. If a manual assembly area regularly creates a blind spot before inspection, perhaps one scan at entry and one confirmation at completion given of evidence. The aim is not surveillance of every motion, it is a flow record people can trust and maintain. Machine data has its own limits. A PLC may expose hundreds or thousands of tags, and most of them don't belong in a value stream model. A raw tag needs engineering interpretation before it becomes a useful state such as running, setup, blocked, starved, faulted, or plan stop. Even then, planned and unplanned stops need separate treatment. A scheduled maintenance window might make a resource unavailable without creating a production failure. A fault may stop a constrained resource while open work waits upstream. If both arrivers one generic downtime code, the model loses the context that planning and maintenance need to act. Connectivity gaps deserve the same honesty. If a gateway loses its link for an hour, machine events may arrive later in a burst or they may never arrive at all. The model should record the data gap as part of the evidence. It shouldn't quietly fill that hour with assumptions because a dashboard prefers continuous lines. Exceptions belong in the model, a batch moved by hand because transport equipment failed. An operator used an approved alternate machine, a quality hold was lifted through a controlled manual process. These events may be rare, but they can explain the exact orders that people care about during a difficult shift. Ignoring them creates a tidy model that fails when operations need it most. This is why I prefer confidence markers over fake precision. A flow interval can carry a label such as confirmed, inferred from adjacent events, delayed source record, or incomplete evidence. The language can stay simple, but the distinction needs to reach the person making the decision. A planner doesn't need a lecture about data engineering. They need to know whether an order truly waits at a process, appears to wait because a scan is missing or cannot be located from the current records that also gives the plant a sensible improvement path. Instead of launching a broad data cleaning campaign, the team can identify the few gaps that block a real flow decision. Maybe the issue is a missing movement event, maybe it is a clock setting, maybe the process itself has no agreed proof that a quality release reached production. Each gap points to work that people can own. The live model earns trust when it shows both what it knows and where its evidence stops. Once that discipline is in place, we can test it against the situation every factory recognizes. An order looks late, a machine looks available, and the real queue sits somewhere nobody has recorded clearly. Example, a late order and an invisible queue. Let's put this into a factory situation. Picture a make-to-order plant with a product family that passes through machining inspection, heat treatment, final test and assembly. A customer order is due for shipment tomorrow morning, and the planer sees that it's still open before heat treatment, ERP shows the order released on time. The planned routing says heat treatment should have started yesterday afternoon. MES confirms that the prior machining operation completed, and the furnace feed shows that the heat treatment resource has been available for part of the day. So the first reaction is predictable, why isn't the furnace running this order? That question may sound reasonable, but it points at the wrong part of the flow. The planer calls the heat treatment supervisor. The supervisor checks the physical queue and says the order never arrived in the staging area. Maintenance confirms the furnace isn't down. The operator says there's no batch waiting under that work order. Yet MES still reports the prior operation as complete. Everyone has a fact, nobody has the chain of evidence. Now take the same situation with a live value stream model. The model starts from the order and follows its actual known path. It sees that machining completed a batch of parts at 11.20 in the morning, it also sees that the batch passed a dimensional inspection shortly after that. Then the sequence stops. There is no transport handoff, there is no receipt event at the heat treatment staging area, there is no loading event for the furnace. And there is no quality release for the material lot that the batch needs before heat treatment can begin. That last detail changes the discussion. The batch didn't wait because heat treatment lacked capacity. It waited because a material inspection release did not reach the next part of the process. Depending on the plant, the physical batch may sit in a marked hold area on a rack beside machining or in a staging zone where nobody expected it to remain for long. The official routing may not even name that place. The physical flow still depends on it. A static value stream map might contain a generic triangle for inventory between machining and heat treatment. It may show an average wait time from the workshop. But it cannot tell the planner that this specific order has remained in that handoff for nearly a full day, that its evidence stops at a quality state and that no transport event confirms movement. That is the difference between an improvement map and an operating model. The live model can attach ownership to the open condition. It may show that quality owns the pending release decision while material handling owns the next move once the release clears. It can also calculate the elapsed interval from the last confirmed event without pretending that the batch definitely sits in a named physical location if no scan proves it. That wording matters. Instead of saying the order is in the heat treatment queue, the model can say the order completed machining and has no confirmed entry into heat treatment staging. A quality release remains open against the related material lot. That is more precise. It also gives people a practical next action. The planner can check whether the release will clear in time. Quality can see that the hold now affects a customer commitment, not just a record in a quality system. The heat treatment team can avoid being blamed for a queue that never reached them. And the production manager can see that expediting the order may first require a decision outside the furnace area. This also changes the due date conversation. The model knows the order's promised date from ERP. It knows the remaining route after heat treatment. It can compare the last confirmed date with the time needed for the remaining work based on the process rules and current evidence. It doesn't need to claim an exact shipping prediction if the data cannot support one. But it can state that the order faces risk, why it faces risk and which unresolved condition creates that risk. That is a better conversation than a red-lade order flag. There may still be uncertainty. Perhaps the quality release happened on paper and the system record simply arrived late. Perhaps a forklift moved the batch but no one scanned it. The model should show those as possible gaps, not inventor needs story. Even with uncertainty the team has narrowed the search. They're no longer asking why an available furnace fail to run an order. They're asking where the hand off broke, who can confirm the batch status and whether the customer promised needs action now. That's what a regenerated value stream can do in practice. It turns a late order from a vague schedule exception into a traceable flow problem with the last known state, the missing evidence, the responsible condition and the downstream consequence connected in one chain. Measuring flow without inventing precision. So once you can trace an order through the flow, the next question is what to measure. Lead time is the natural place to start. It measures the elapsed time from the agreed start of the value stream to the agreed end. That might run from order released to shipment or from material receipt to finished goods hand off. You need to keep that boundary explicit or two teams will calculate two different lead times and both might think they're right. Touch time is the time when work is actually being processed. That includes machine cycles, manual assembly, testing, inspection, packing and even testing. As long as the setup directly enables the work, and touch time is almost always much smaller than total lead time. The gap between those two numbers tells a more useful story than either one by itself. It's possible for an order to move through a plant with a reasonable amount of touch time, but still take way too long to ship because most of its life is spent waiting in cues, on hold, in transport or between handoffs. That's exactly where value stream mapping has always pushed teams to look. And a live model lets them test that observation against the actual event record. Weight time needs careful language. It's the interval between meaningful process events. But you shouldn't label every gap as waste. A batch that waits overnight during a plant shutdown isn't the same as one waiting for an inspection decision during an open shift. And a furnace load might wait because a batch rule requires compatible material. That can still create lead time pressure, but it's not the same type of problem as an unowned handoff, so the model should show the interval first, then the reason where evidence supports it. Cue size also sounds simple until you ask what it counts. Does it count? Open work orders assigned to the next operation, physical containers in a marked area, or quantities that pass the prior step but haven't had a confirmed start at the next step. These can all differ, especially when physical movement and system posting don't happen together. That difference is useful evidence. If the transactional cue shows 20 batches and the physical count shows 14, the goal isn't to pick the more convenient number. That gap might reveal delayed postings, material in an unrecorded location, partial quantities or work completed without a clean handoff. A live value stream model should let the team see both views and investigate the difference. First pass yield adds another piece of the picture. How much work passes a step without rework, repair or rejection. When first pass yield falls, the effect isn't limited to quality. Rework loops consume capacity, extend lead time, distort cue counts and create extra planning work. That's why a flow model needs to connect quality events to the unit, moving through the process rather than treating quality as a separate report for another meeting. Schedule adherence can help too as long as you keep the plan separate from execution. It compares what the schedule expected with what actually happened. If orders repeatedly start later than planned at one step, the team can ask whether the release rule, capacity assumption, material readiness or routing logic needs attention. It should not become a tool for blaming people for a plan that ignored shop floor limits. OEE fits into this picture as asset evidence. It combines availability, performance and quality around a piece of equipment and it can help explain whether a resource lost productive time, ran below its expected rate or produced losses. But OEE does not describe end to end flow by itself. A resource can report strong OEE while customer orders wait upstream for a different constraint or poor OEE during a period where no urgent work needed it. OEE answers an equipment question. The live value stream connects that evidence to the work due dates and handoffs that shape customer delivery. Don't chase one perfect number. Factories have partial records, late events, planned downtime and uncertainty around physical location. When evidence is incomplete, a range is more honest than a precise average. So a QAGE might read as at least six hours since the last confirmed event, rather than claiming the batch set exactly six hours in a known buffer. Source timestamps and completeness markers should travel with the measure. If a flow review uses data that arrived after shift end people need to know that. If a movement event is inferred, rather than confirmed, make that visible before anyone treats the result as a fact. Precision without evidence creates false confidence. The measured range linked to its source and its limits gives operations something they can challenge and improve. So the next question is whether those measures actually change a real production decision. Decisions the live model can support. A flow measure only earns its place when somebody can use it to decide something differently. Take the morning planning meeting. Demand has changed. One customer needs an earlier shipment, material for another order hasn't cleared inspection and a resource has less usable time than planned. The team doesn't need another total count of late orders. They need to decide what work should move first, what should wait and which commitment now needs an honest conversation. A live value stream model can bring the conditions around each order into that discussion. It can show which orders have reached the next executable step, which ones only look ready in ERP and which ones remain blocked by material, quality, capacity or a missing handoff. The priority then becomes more than sorting by due date. An order with the nearest due date might still lack material or need a resource that can't run it today, moving it to the top feels decisive. But it can block work that is fully ready and could protect another customer commitment. The model gives the planner a way to separate urgency from actual readiness that does not remove the trade off. It makes the trade off visible. Bottleneck review is another good use case. Most plants know which resource creates pressure most of the time, but that pressure can shift by product mix, staffing, maintenance or rooting. A live model can track where open work accumulates, how long it stays there and whether the queue grows faster than the process clears it. That gives the team a better question than which machine looks busy. They can ask whether the constraint actually limits customer flow right now, whether work waits upstream because the constrained resource lacks capacity, because release rules feed it poorly, or because downstream conditions stop completed work from leaving. A queue near a resource doesn't automatically mean the resource caused it. Expertide decisions become less emotional too. Picture a sales escalation arriving late in the day. Someone asks production to rush one order through. That request might be justified, but moving that order forward can delay another order, consumer scarce tool, force an extra change over, or send partial work into a downstream area that can't take it. The live model can expose those effects before the team acts. It can identify the remaining root, the open conditions, the resource options, and the other work likely to move aside. A planner can then ask a more useful question if we accelerate this order, which other customer commitment takes the risk, and do we accept that risk? Sometimes the answer will still be yes, at least it is a conscious decision. Improvement work benefits differently. Traditional VSM often helps a team spot a major weight or a poor handoff during a workshop. The live model can test whether that pattern keeps appearing after the workshop, under which products, shifts, or conditions, and whether an attempted change actually reduced the delay. Recurring loops become visible too. Maybe work repeatedly returns from final test to a prior assembly operation, or material moves into a temporary holding area whenever a specific inspection result needs review. The model doesn't replace the people who know why those things happen. It gives them a repeatable record of when and where the pattern occurs, that helps improvement teams, spend less time arguing about which spreadsheet is right. Customer promise review may be the most direct use. Customer service often sees a promised date and a broad order status, while production sees local cues, machine conditions, and open work. A live flow view can connect the promise to the last confirmed production state and the path ahead. It does not need to predict the future with fake certainty. Instead it can show that an order has enough confirmed progress to remain on track, that it has entered a risk condition because a required step hasn't started, or that the evidence itself is too incomplete to support a promise. That last answer can feel uncomfortable, but it's better than reassuring a customer from a status field that hasn't matched the floor since yesterday. Each of these decisions still belongs to people. A model can show conditions, dependencies, and likely effects. Operations still need to weigh customer priority, safety, labor rules, commercial commitments, and local knowledge that may not exist in any source system. The purpose isn't to automate every decision, it's to make the reasoning behind the decision less dependent on memory, phone calls, and whoever happens to know where the batch went. That distinction matters as the model becomes more capable. A queue report tells you that work is waiting. Decision support starts to ask what can change, what limits that change, and what the rest of the value stream will pay for it. Decision intelligence, not dashboard inflation. A dashboard tells you a queue is growing. Decision intelligence goes further, it asks what actions are possible, what blocks each one, and how the rest of the flow will absorb the choice you make. That sounds like a small shift, it isn't. Picture a planner staring at eight orders backed up before a constrained process. The dashboard ranks them by due date and turns the oldest rows red. That's useful as far as it goes, but the planner still needs to know which orders have released material, which ones need a tool already assigned, which ones can take an alternate resource, and which ones will record downstream assembly if they move first. A red row can't answer that. Decision support brings the queue's rules into the conversation. It identifies candidates for action and explains the conditions attached to each. Move order a first and order b might miss its test slot. Move order c first, and the work sits again because quality hasn't cleared the material. Decision at machine and no qualified operators on that shift, the system should show those constraints plainly. This is where people sometimes think generative AI can solve it all. They imagine asking a co pilot style assistant, what should we produce next? And getting the perfect answer. I'd be careful with that assumption. A language model can help investigate a problem. It can summarize open exceptions, retrieve approved procedures, explain why an order is blocked, or turn a mess of records into a question a planner can act on. But it doesn't automatically understand production rules just because it can produce a fluent answer. A good recommendation needs an explicit basis that basis includes due dates, material status, resource capability, operator approval, setup sequence, available capacity, quality restrictions and business priority. Some constraints come from systems. Others need formal rules from operations. A few only emerge when a supervisor knows a fixture is being repaired or a customer agreed to a different delivery sequence. No model contains every fact. For choices with clear math constraints, an optimization engine can help compare schedules or allocation options. That's a different job from generative AI. Optimization works from declared objectives and constraints. It can test many combinations, but only within the model you give it. A chat prompt isn't a scheduling model. The live value stream model gives both forms of support a grounded process context. It connects an order to its current condition, remaining operations, blocks and dependencies, then an assistant can help investigate that context, while an optimization method can assess choices that follow defined rules. Neither one should take control of the factory on its own. Operations keeps accountability because every production decision involves trade-offs. A customer escalation might justify an extra change over. A safety rule might kill an otherwise attractive option. A local decision might protect one order while creating trouble for another. The model makes those effects easier to see, but a named person still owns the decision. That responsibility should show up in the record. When the team decides to expedite an order, defer a batch, re-root work or accept a delivery risk, capture the action the reason the constraints known at the time and the outcome later. Over time, that decision log becomes part of the learning loop. It shows whether certain expedites repeatedly cause the same downstream damage, or whether a recurring exception points to a missing process rule. Without that record, the plan keeps rediscovering the same problem each week. There's a temptation to answer every new question with another Power BI page. Power BI presents measures well and helps teams explore the flow. But another report page can't supply missing process meaning resolve conflicting identifiers or decide which rules govern a re-root. Reporting sits at the end of the chain. Decision intelligence starts earlier where process states, relationships, constraints and accountable choices connect. Once that chain exists, Microsoft technology can support parts of it well. But the platform needs a clear role in the architecture, not become the name people attached to an unfinished process model. Microsoft Fabric as the Data Foundation. Once you decide the value stream needs a managed data model, you need a place where evidence can come together without making one operational system the owner of everything. This is where Microsoft Fabric comes in. Not as the value stream model itself and not as a replacement for ERP, MES, quality or planning systems. Fabric provides the data foundation where sources contribute records, teams keep history, apply shared rules and published trusted views for analysis. That distinction keeps the architecture honest, your ERP still owns commercial demand, work orders, material plans, promise dates and most of the master data. Your MES records execution on the shop floor, quality owns its inspection and release evidence. Planning tools run the planning processes they were built for. Fabric connects the evidence without pretending it created the process truth. Think about the data path as layers. At the first layer, source data arrives from ERP, MES, quality, maintenance and where it supports a real flow question, IoT and machine data. The goal at that stage is to retain source evidence with enough context to trace it back later. Don't start by flattening everything into one giant table. Different systems record different facts at different times. An ERP order change arrives as a business transaction. An MES confirmation arrives as an execution event, a quality hold links to a lot. Machine data arrives as a time series with many readings that never belong in the flow model at all. Fabric gives you a place to keep those forms of data without forcing them to become identical on day one. A lay-house pattern works well when you need to keep raw records alongside curated data. Raw source data stays available for replay, checking and later correction. Curated tables apply approved mappings, common identifiers, event rules and data quality checks. That separation matters when someone asks why a flow measure changed. Suppose MES corrects an operation completion after the initial record hit the platform. You don't want to lose the first record without trace. You also don't want every report to treat both records as two separate completions. The curated layer applies the business rule while the raw layer preserves what arrived and when. A warehouse pattern also makes sense for governed reporting, stable business views and shared measures that many teams need. The point isn't to pick a fashionable storage pattern. The point is to give operational evidence a controlled route from source record to usable flow view. Use each layer for the job it needs to do. For some decisions, daily updates are enough. A weekly improvement review uses settled history with clear source windows. A shift review needs more frequent updates from MES or material movement. If an event needs to reach a plan quickly, fabric data pipelines and event stream capabilities can support that flow. But source timing should follow the decision not a general demand for real time. Moving every machine signal into a cloud platform every second might create a big data bill and very little better judgment. A machine state becomes useful to the value stream only when the model connects it to a resource and operation and the work affected by that state. Until then, it's just another signal with a timestamp. Fabric can also support semantic models which give measures a shared definition for tools like Power BI. That helps when different teams need the same definition of open work, late order risk or completed quantity. Still, be careful where you put the flow logic, simple measures fit well in a semantic model. More involved logic like reconstructing an order path, handling split batches, applying effective routing dates or classifying a weight from several event types, usually belongs earlier in the curated data and process model layer. Otherwise, every report calculates the flow slightly differently. That is how disagreement returns, just with better visuals. As a Microsoft MVP, I spend a lot of time looking at where fabric fits in industrial architectures and I think its strength here is practical. It brings IT and OT evidence into a governed data state, retains history, applies repeatable data rules, manages access and supports analysis without asking one application to solve every manufacturing problem. It won't invent a shared order identifier, it won't know which routing matches the work actually released, it won't decide whether a quality release proves a batch can move, it won't tell you who owns a stalled handoff. Those answers still come from manufacturing teams, process rules and the model built around them. So fabric supplies the foundation, not the missing meaning. Once that foundation is in place, we can follow the path more closely from a machine signal near the equipment to evidence that actually helps explain the state of the value stream. Connecting OT data without breaking OT, here is the problem most manufacturers don't talk about, machine data can add useful evidence to a live value stream model, but only if you respect how operational technology actually works. A programmable logic controller sits right there next to the physical process, controlling machine sequences, reading safety inputs, reacting to faults and keeping equipment running through an entire shift. That controller does not exist to feed a cloud report, production depends on it doing its local job reliably, so don't treat OT data access like a normal IT integration. In a sensible architecture, data leaves the equipment environment through approved paths. That could be an industrial gateway, an edge computer, an existing historian or a plant integration layer that OT already manages. The method depends on the site, the equipment, the network design and the risk profile. The principle stays simple. Read what you need, protect the control boundary. Nobody should connect an analytics project directly to every controller just because someone wants a more current dashboard. A request from the cloud must not interfere with machine control, safety logic or the network traffic the production already relies on. A stopped report is inconvenient, but a stopped line has physical and commercial consequences. OT teams know that distinction well. The data path usually begins with equipment signals, but raw tags don't explain production on their own. A tag may tell you that a motor runs, a doors open, a cycle counter changed or a fault bit switched state. Those signals can be technically correct while still carrying no direct meaning for a production planner. Engineering needs to interpret them. For one machine, a cycle active tag may represent productive work. On another machine, the same kind of tag may remain active during warm-up, dry runs or an automated cleaning cycle. A state is called idle, may mean the machine waits for an operator, for material, for a program or simply sits in a planned break. You can't guess that from a tag name. This is where OT and manufacturing engineering need to define equipment states that people can actually use. A raw group of signals might become a state like available in setup, processing, blocked, starved, faulted or under-plan maintenance. Even those labels need local agreement because every asset behaves differently. The value stream model should only consume states that answer a flow question. A furnace fault matters when open batches need that furnace or when no approved alternate resource exists. A machine's running state may help explain why a planned operation did not start, but only after the model can connect that machine to the work order, operation and product it can process. That connection often comes from MES dispatch data, operator confirmation, a barcode scan or another approved production record. Think about a machine that reports it is available. That status does not mean a late order can start. The order may need material release or a fixture, the machine may sit available because the next scheduled work hasn't reached the cell, or it may only run a product revision, the order does not use. Machine state is evidence, it isn't a decision. The same applies when equipment reports a fault. A fault can explain a capacity loss, but the value stream model still needs to know which work face that loss. Was an urgent order loaded? Did several orders wait upstream? Could work move to another resource? Did the fault happen during a planned gap with no released work? Without that context, an alarm becomes a noisy event stream with nowhere to go. OT and IT convergence does not mean IT gains direct control of OT. It means both sides agree how equipment facts move into enterprise data systems, how those facts retain their meaning and who can change the interfaces. That takes controlled access, clear ownership and respect for production constraints. Azure and Fabric can receive and process data after it has crossed an approved boundary. They can help retain history, connect equipment evidence to execution records and support analysis. But neither platform should bypass the systems and people responsible for safe machine operation. The cloud belongs on the data path, not inside the safety loop. When that boundary stays clear, machine data becomes useful without becoming disruptive. The live value stream model can use approved equipment states as part of the chain of evidence, while MES and dispatch context connect those states to the order moving through production. From there, the broader enterprise records need to join the same chain. ERP, MES, quality and maintenance roles. Once equipment data enters the chain, each operational system needs a clear job. The live value stream model becomes unreliable when one system gets treated as the source for facts it was never designed to own. ERP usually starts with demand. It holds customer orders, promised dates, planned materials, product master data and work orders that describe the intended production route. It gives the business a structured view of what needs to be made and when. That view matters, but ERP normally describes commitment and plan more than physical execution. A planner may see that an order should reach final assembly on Tuesday, while the shop floor knows the order is still waiting for a purchased component or an inspection result. The ERP plan still belongs in the model because it gives the live flow a reference point, it tells you what the factory expected to happen and where an actual event starts to move away from that expectation. MES, the manufacturing execution system, works closer to execution. It manages dispatch lists, work instructions, operator actions, production confirmations, quantities, genealogy and the current state of work on the floor. For a live value stream, MES often supplies much of the event trail. It can tell the model that a batch started an operation that a quantity completed that an operator recorded scrap or that work moved through a controlled step. But even a good MES does not own every fact that affects flow. Some physical moves happen outside its transactions, some process states depend on quality release, some equipment conditions come from OT systems and some priority changes begin in planning. MES supplies execution evidence, it doesn't own the full business and physical story around every order. Quality systems fill a gap that teams often underestimate until an order stops moving. They record inspection plans, test results, holds, release decisions, non-conformance reports, deviation approvals and rework evidence. A quality hold is not just a quality event. For a planner it can change whether an order is actually ready. For a production supervisor it can explain why work has not entered the next process. For customer service it can turn a seemingly safe promise into a delivery risk. The value stream model needs to connect that quality condition to the related order, batch, material, lot or serialized unit depending on how the plan tracks work. Quality also exposes a problem with simple status reporting. A batch can show complete at one operation and still remain unavailable for the next one because the required inspection did not pass or has not yet been reviewed. If the model ignores that condition it shows false readiness. Maintenance carries another part of the evidence. Its systems may track planned maintenance, asset condition, work requests, service activity, failure records and equipment availability. That information can explain why capacity change from the plan but maintenance data needs the same context as machine data. A maintenance work order against a press tells you that the press needs attention. It does not automatically tell you whether customer work faced a delay whether the press was the limiting resource or whether an approved alternate resource could handle the affected operation. The value stream model connects the asset condition to the work that depends on that asset. That connection also helps maintenance teams. Instead of only seeing a list of equipment events they can see whether a planned intervention overlaps with open work that has no alternate path or whether a fault affects orders with near term commitments. Maintenance does not suddenly own delivery performance but it can see the operational consequence of an equipment decision. Each system keeps its own responsibility. ERP owns the commercial and planning record. MES owns shop floor execution records quality owns release and conformance evidence. Maintenance owns asset care and maintenance history. O.T. systems remain close to machine operation and control. No single system owns the whole value stream. That ownership sits in the model created across those systems with clear rules about which source supplies which fact and what happens when records disagree. The live value stream does not erase system boundaries. It connects the dots between I.T. and O.T. without pretending that every system means the same thing once those roles are clear the next problem becomes more interesting. The flow does not only depend on records. It depends on relationships that change over time which batch belongs to which order which resource can run which operation and which quality condition blocks what work. Knowledge graph for relationships that change. A live value stream needs more than events stored in the same place. It needs to understand the relationships around those events especially when one order splits into batches a batch moves through rework or an approved alternate resource changes the path. That's where a knowledge graph comes in. A knowledge graph is a model of things and the links between them things like a customer order, production order, batch, operation, product revision, machine, material lot, quality hold and physical location. The links explain how they relate at a given time think about a batch waiting for heat treatment. The useful question isn't just what is the batch status. You may need to ask which order the batch supports which product revision applies which furnace can run that revision whether the material lot has a hold and which later operations now face a due date risk. Those are relationship questions. A normal relational database can store many of these facts very well. Order lines, rootings, resource tables, event records, quality results and a graph does not replace that work. It becomes useful where the team needs to travel through changing links without building a new chain of joints for every operational question. For example, a quality hold may attach to a material lot that feeds several batches which belong to different orders each following a different remaining root. When quality places that lot on hold people need to know the impact path. You need to know which open orders depend on it which ones have a near term ship date which downstream operations can no longer start and whether any work is already in process using the same lot. A graph can represent that path directly the same applies to alternate resources. A rooting may say that operation 40 normally runs on one machining center while two other machines can run it under certain conditions but can run it needs more detail. Perhaps one alternate machine only supports the current product revision after a tooling change, perhaps another needs a qualified operator and perhaps a third sits in a cell that cannot accept the batch size. So the relationship needs conditions. Instead of a simple link that says "machine B can perform operation 40", the model can record a time bound rule. Machine B can perform operation 40 for product revision R7 within a defined batch range when tool T19 is installed and when an approved operator is available. That may sound detailed because it is detailed and production routing rules often are. The point is not to model every possibility anybody can imagine is to model the relationships that a planner, supervisor or improvement team needs when deciding what work can move and what cannot. Time changes the problem again. A product revision changes, engineering updates are rooting, a machine gains a new capability after validation. An operator qualification expires. If the model only keeps the current relationship it can rewrite the power.