

Your Fabric Bill Is Skyrocketing. And It’s Not The Data.


This episode explains why Microsoft Fabric costs often rise even when data volume stays the same. The key issue isn’t storage—it’s compute behavior. Fabric runs on a shared capacity model where all workloads (reports, pipelines, refreshes, queries) compete for the same resources, so inefficient or poorly timed processes can drive up costs across the entire environment.
It breaks down how background activities like scheduled refreshes and pipelines frequently consume capacity before users even start working, creating hidden pressure and performance issues. Because everything draws from one pool, a small number of inefficient workloads can disproportionately impact both cost and performance.
The main takeaway: you’re not paying for how much data you store—you’re paying for how your workloads run. To control costs, teams need visibility at the workload level and must optimize how and when compute is used, rather than blaming growth or licensing.


You face a real challenge when you try to control compute costs in Microsoft Fabric. Cost Optimization depends on your ability to understand shared capacity, monitor workload behavior, and apply smart governance. Uncoordinated workloads can drive up costs quickly. For example:
- Overlapping workloads compete for shared capacity and increase expenses.
- Teams that schedule refreshes independently put constant pressure on resources.
- You may see performance issues even when failures are not obvious.
You need strong cost management to align spending with business value and keep your environment efficient.
Key Takeaways
- Understand Capacity Units (CUs) to track compute resource usage effectively. Analyze item-level CU consumption to identify cost drivers.
- Monitor workload behavior in real time. Adjust scheduling to avoid overlapping jobs that can increase costs and lead to performance issues.
- Choose the right SKU based on your workload needs. Regularly review your SKU to ensure it aligns with your current analytics requirements.
- Implement capacity reservations for predictable workloads. This can save you up to 41% on costs by locking in lower rates.
- Pause idle capacity during low activity periods. Automate this process to reduce costs significantly when resources are not in use.
- Optimize API usage by batching requests. This reduces the number of calls and lowers compute unit consumption.
- Establish strong governance practices. Set budgets, use resource tagging, and control access to manage costs effectively.
- Conduct regular reviews of your capacity and workloads. Adjust resources as needed to ensure spending aligns with business value.
Microsoft Fabric Pricing and Cost Drivers

Understanding how Microsoft Fabric pricing works is the first step to controlling your costs. You pay for compute resources based on how your workloads behave in real time. This means that every action, from running a query to refreshing a dataset, affects your bill. You need to know where your money goes and how to make smart decisions.
Understanding Capacity Units
In Microsoft Fabric, you use Capacity Units (CUs) as the main measure for compute resources. The platform calculates CUs based on the SKU you purchase, and it measures usage in 30-second intervals. Every operation, whether interactive or running in the background, consumes CUs. Microsoft Fabric tracks all activities, including CPU, memory, disk IO, and network bandwidth, using this single unit. This approach gives you a clear view of how much compute you use and helps you spot areas where you can save.
Tip: Analyze your item-level CU consumption instead of just looking at the total bill. This helps you find which workloads drive your costs.
Shared Capacity Model
Microsoft Fabric uses a shared capacity model. All teams and departments draw from the same pool of resources. This model can boost efficiency, but it also requires strong governance. If one team runs heavy workloads, others may see slower performance or even delays. You need to coordinate and monitor usage to avoid these problems.
Here is a quick look at the advantages and challenges of the shared capacity model:
| Advantages | Disadvantages |
|---|---|
| Higher overall resource utilization | Risk of contention |
| Enables collaboration across departments | Heavy use by one team can negatively impact others |
| Better price-performance | Need for strong governance and monitoring |
| Ability to smooth out usage peaks |
Real-Time Workload Impact
Microsoft Fabric pricing responds to your workload behavior in real time. When you run multiple jobs at once, total CU usage cannot go over your available capacity. If demand spikes, you may see queuing or throttling. Some capacities can autoscale, borrowing extra resources and adding to your bill. Throttling happens if you use more than your allocation for too long. For example, short bursts may not cause issues, but long periods of overuse can lead to delays or rejected jobs.
Here is how real-time workload behavior affects your costs:
| Behavior | Description |
|---|---|
| Concurrent Workloads | Multiple jobs can run at the same time, but total CU usage cannot exceed available capacity. Excess demand leads to queuing or throttling. |
| Dynamic Scaling (Autoscale) | Some capacities can temporarily borrow additional resources, which are billed as on-demand units. |
| Throttling Mechanisms | Throttling occurs when usage exceeds allocated amounts, with varying severity based on duration of overuse. |
Note: Throttling severity increases with the length of overuse. Short periods may not affect you, but longer overuse can cause delays or rejections.
Microsoft Fabric pricing also depends on other cost drivers. You need to watch for unused resources, storage growth, licensing fees, network expenses, and operational overhead. Right-sizing your capacity can save you up to 30%. Data retention policies help control storage costs. Keeping data in the same Azure region avoids extra network fees. Efficient workload management reduces operational overhead.
| Cost Driver | Description |
|---|---|
| Capacity Utilization | Paying for unused resources can lead to significant waste. Right-sizing can save 20-30% on costs. |
| Storage Costs | Uncontrolled storage growth can increase costs. Implementing data retention policies can help. |
| Licensing Fees | Upgrading to higher capacity can eliminate per-user fees, making it more cost-effective at scale. |
| Network Expenses | Keeping data within the same Azure region can avoid inter-region transfer fees. |
| Operational Overhead | Efficient workload management can reduce overall costs by optimizing job performance and scheduling. |
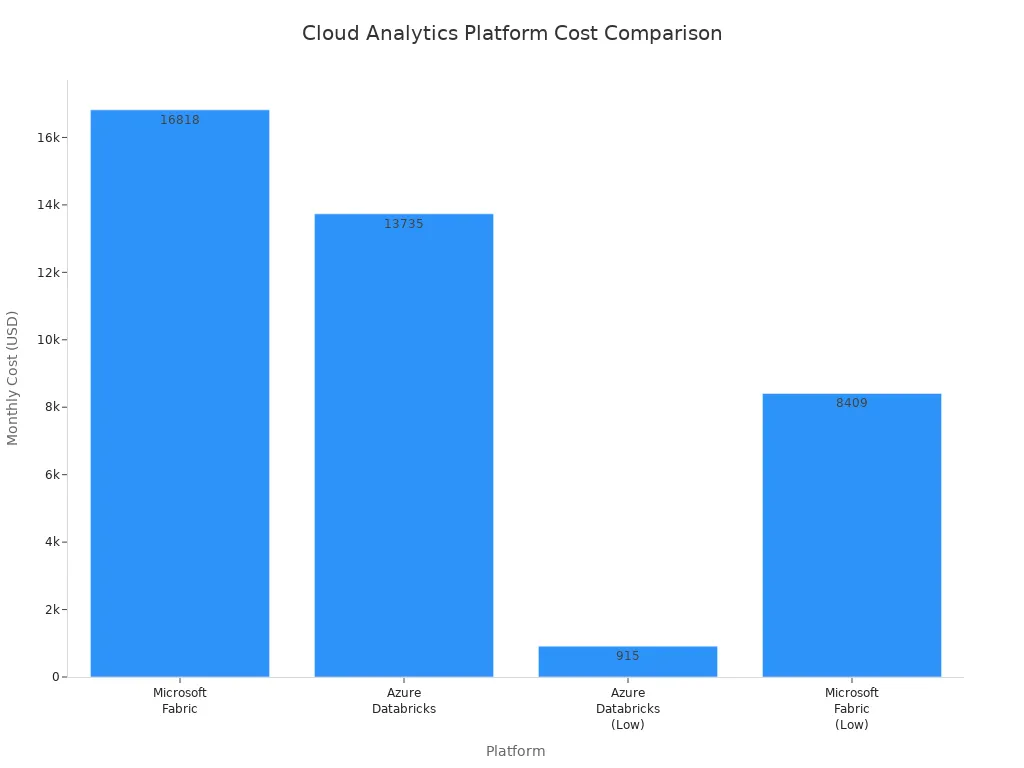
You may wonder how Microsoft Fabric pricing compares to other platforms. The chart below shows a cost comparison with Azure Databricks. Microsoft Fabric uses a fixed-cost subscription model, while Databricks uses on-demand pricing. This difference can affect your cost optimization strategy.
You can control your Microsoft Fabric pricing by understanding how CUs work, managing shared capacity, and monitoring real-time workload behavior. These steps help you avoid waste and align your spending with business value.
Identifying Overspending in Microsoft Fabric
Common Triggers for High CU Usage
You can spot overspending in microsoft fabric by understanding what drives high compute usage. Several triggers cause spikes in capacity units. When you run multiple heavy workloads at the same time, such as dataflows, model refreshes, or Spark jobs, you use more compute resources. Scheduling batch processing or ETL jobs during peak user activity also increases demand. Unoptimized workloads, like inefficient code or unnecessary recomputations, consume excessive memory and compute. If you choose a SKU that does not match your scale, you may see under-provisioned capacity, which leads to higher compute consumption and performance issues.
Here are the most common triggers for high compute usage:
- Concurrent heavy workloads running together.
- Misaligned scheduling with batch jobs overlapping peak activity.
- Unoptimized workloads using more compute than needed.
- Under-provisioned capacity that cannot handle your operations.
Tip: Review your workload schedules and optimize code to reduce unnecessary compute consumption.
Monitoring and Analyzing Consumption
Effective monitoring helps you control compute costs in microsoft fabric. You need to track how your workloads use capacity units and identify patterns that lead to overspending. The Microsoft Fabric Capacity Metrics App gives you deep insights into capacity performance. The Health Page summarizes your capacities and highlights high consumption and critical issues. The Compute Page shows a 14-day history of compute performance, including usage patterns and throttling events. Timepoint Pages let you analyze specific operations that consume compute resources. The Fabric Chargeback App enables financial accountability by attributing compute usage to organizational units, making cost allocation easier.
You can use these tools for monitoring:
- Microsoft Fabric Capacity Metrics App for operational monitoring.
- Health Page for quick summaries and issue detection.
- Compute Page for historical monitoring and pattern analysis.
- Timepoint Pages for detailed monitoring of compute consumption.
- Fabric Chargeback App for monitoring cost allocation.
Note: Consistent monitoring helps you spot trends and prevent overspending before it impacts your budget.
Recognizing Throttling and Performance Issues
Throttling signals that your compute usage exceeds available capacity in microsoft fabric. You may notice delays, queued jobs, or rejected operations. Monitoring throttling events is essential for identifying performance bottlenecks. The Compute Page tracks throttling frequency and severity, helping you understand when and why your workloads face limits. If you see repeated throttling, review your workload orchestration and scheduling. Adjusting refresh times and optimizing compute usage can prevent performance issues and reduce overspending.
| Symptom | What It Means | Action to Take |
|---|---|---|
| Delays | Compute resources are maxed out | Reschedule or optimize workloads |
| Queued Jobs | Demand exceeds compute capacity | Monitor and adjust scheduling |
| Rejected Operations | Throttling prevents execution | Increase capacity or optimize |
Alert: Frequent throttling means you need to review your compute strategy and improve monitoring to avoid overspending.
Cost Optimization Strategies for Fabric
Choosing the Right SKU
Selecting the right SKU is the foundation of cost optimization in microsoft fabric. Each SKU offers different levels of performance, concurrency, and analytics capabilities. You need to match your SKU to your actual workload needs. If you choose a SKU that is too large, you pay for unused capacity. If you pick one that is too small, you risk throttling and slow analytics.
The table below helps you compare SKU options for microsoft fabric:
| SKU Range | Ideal Use Case | Characteristics |
|---|---|---|
| F2–F8 | Early-stage exploration or small teams | Lightweight, low-cost, limited concurrency and performance |
| F32–F64 | Enterprise reporting with Power BI | Better dataset support, moderate concurrency without high costs |
| F128 | Multi-step ETL workflows and machine learning | More performance for complex operations, fewer constraints |
| F256 and above | High-throughput, high-concurrency analytics | Suitable for enterprise data platforms, real-time analytics, large user bases |
You should review your analytics workloads and business needs before making a decision. This approach ensures your cost optimization strategy aligns with your budget and performance goals. You can always adjust your SKU as your analytics requirements grow.
Tip: Regularly review your SKU choice as your analytics environment evolves. This keeps your cost control efforts on track.
Capacity Reservations for Savings
Reservation Benefits
Capacity reservations offer a powerful way to achieve cost optimization in microsoft fabric. When you reserve capacity for a year, you can reduce your costs by up to 41%. This strategy works best for analytics workloads that are steady and predictable. By committing to a reservation, you lock in lower rates and gain better cost control over your analytics environment.
- A one-year reservation can cut your costs by about 40%.
- Reserved instance pricing for F-SKUs delivers significant savings for analytics teams with consistent usage.
- You gain more predictable budgeting for your analytics projects.
Note: Reservations are ideal for organizations with stable, ongoing analytics needs.
When to Reserve
You should consider a reservation when your analytics workloads remain steady throughout the year. If your team runs daily or weekly analytics jobs, or if your business relies on real-time analytics, a reservation makes sense. This approach supports long-term cost optimization and helps you avoid unexpected spikes in your budget.
- Review your analytics usage patterns before committing.
- Choose reservations when you expect consistent analytics demand.
- Use reservations to simplify cost control and planning.
Pausing Idle Capacity
Scheduling Pauses
Pausing idle capacity is a direct way to achieve cost optimization in microsoft fabric. When you pause capacity, you stop incurring costs until you reactivate it. You should monitor your analytics usage and schedule pauses during periods of low activity, such as nights or weekends. Automation tools can help you pause and resume capacity based on real-time analytics demand.
Tip: Set up automated schedules to pause capacity during predictable idle times. This practice supports ongoing cost control.
Cost Implications
Pausing idle capacity can lead to dramatic cost savings. For example, organizations that automated pausing and resuming capacity saw monthly expenses drop by thousands of dollars. Over six months, the total cost for automation was less than $2 NZD, while the total savings reached nearly $5,000 NZD. This shows the power of aligning analytics capacity with real-time demand.
Keep in mind that any analytics usage above your allocated capacity will still be billed, even if you pause later. Always monitor your analytics consumption to avoid surprises in your budget.
Alert: Pausing idle capacity is one of the most effective cost optimization strategies for analytics environments with fluctuating real-time demand.
Batching and Efficient API Usage
You can lower your compute costs in microsoft fabric by batching API calls and optimizing how you use APIs. When you batch requests, you reduce the number of calls, which means you use fewer compute units. Efficient API usage also helps you avoid unnecessary overhead and keeps your workloads running smoothly. Here are some ways to improve your API efficiency:
- Batch API calls to minimize the number of requests and reduce compute unit consumption.
- Reduce driver cores to optimize resource usage and decrease costs.
- Optimize Spark processing to enhance performance and minimize compute unit usage.
- Use Fabric Pipelines for API-based ingestion. This improves efficiency and gives you control over retries and concurrency.
Tip: Efficient API usage not only saves money but also improves the reliability of your data pipelines.
Rightsizing and Scaling
You need to match your capacity to your workload demands in microsoft fabric. Rightsizing ensures you do not pay for unused resources or face performance issues from under-provisioning. Scaling helps you handle growth and avoid bottlenecks. The table below shows recommended approaches:
| Approach | Description |
|---|---|
| Scale Up | Increase the SKU size to provide more compute resources and prevent throttling. |
| Scale Out | Move workspaces or items to different capacities to distribute workloads and isolate high-priority items. |
| Surge Protection | Manage background jobs to limit overuse of capacity and prevent throttling or rejections. |
Many organizations make mistakes when rightsizing and scaling. Some ignore the ratio of compute units consumed per terabyte of data, which leads to higher costs as data grows. Others design ETL processes poorly, causing excessive compute consumption from small writes. Simply increasing capacity without optimizing workloads can result in exponential cost increases.
Alert: Always review your workload design and scaling strategy before increasing capacity. This prevents waste and keeps your costs under control.
Orchestrating Workloads and Refreshes
You can optimize costs in microsoft fabric by orchestrating workloads and refreshes. Reducing orchestration time by using parallel flows in data pipeline activities lowers the time resources are consumed. This approach minimizes overall capacity unit consumption.
You should also minimize data movement and use incremental processing. These strategies reduce storage duplication and processing overhead. Scheduling heavy tasks during off-peak hours helps manage resource usage and improves efficiency.
Optimizing Spark notebooks and SQL queries by pushing down filters and using proper indexing leads to faster job execution. This directly reduces compute costs. Continuous monitoring with tools like the Fabric Capacity Metrics App helps you spot inefficiencies and find scaling opportunities.
Note: Smart orchestration and scheduling can make a big difference in your compute costs and system performance.
Governance Reset for Cost Control
You can achieve real cost control in microsoft fabric by resetting your governance approach. Strong governance helps you prevent overspending, improve accountability, and align your technology investments with business goals. When you manage shared capacity, you need clear rules and processes to keep costs predictable and fair.
Start by setting up budgets and alerts. Use Azure Cost Management to define spending limits for your workloads. Budgets help you track usage and receive alerts before you exceed your targets. This proactive step keeps your teams aware of their consumption and encourages responsible usage.
Resource tagging is another key strategy. Tag every workspace, project, or department with clear labels. This practice lets you see exactly where your money goes. You can attribute costs to specific teams, making it easier to hold everyone accountable for their usage.
Role-based access control (RBAC) gives you the power to limit who can create or scale expensive resources. By standardizing permissions, you reduce the risk of unauthorized or high-cost actions. Only approved users should have the ability to assign new workspaces to shared capacity or change capacity settings.
You should also control how and when capacity scales. Set up a formal approval process for scaling decisions. This ensures that any increase in capacity aligns with business priorities and budget constraints. Review scaling requests regularly to avoid unnecessary spending.
Managing usage spikes is important. Define clear standards for throttling and surge scenarios. When demand increases, you need rules to decide which workloads get priority and how to handle excess usage. This prevents one team from consuming all the resources and driving up costs for everyone.
Regular leadership reviews help you stay on track. Bring together IT and business leaders to review platform costs and performance. These meetings ensure that spending matches business value and that everyone understands the impact of their decisions.
Here is a summary table of effective governance strategies for cost control in microsoft fabric:
| Strategy | Purpose |
|---|---|
| Azure Cost Management | Set budgets and alerts for proactive cost control |
| Resource Tagging | Attribute costs to projects or departments |
| Role-Based Access Control | Limit permissions for costly resource actions |
| Capacity Management | Monitor and pause resources during off-hours |
| Compute Resource Pausing | Automatically pause idle resources to save costs |
| Data Lifecycle Management | Move older data to cheaper storage tiers |
Tip: Enforce data lifecycle management policies. Move older or less-used data to lower-cost storage. This reduces storage expenses and keeps your environment efficient.
By resetting your governance, you create a culture of accountability and efficiency. You empower your teams to make smarter decisions and ensure that microsoft fabric delivers maximum value for your organization.
Maximizing ROI with Microsoft Fabric
Aligning Costs with Business Value
You want to get the highest roi from your data platform. In microsoft fabric, you can align costs with business value by using proven methods that streamline your operations and reduce waste. The right approach helps you see more value from every dollar you spend. You can use an automated medallion approach to follow best practices by default. This method improves data quality and reduces maintenance effort. You will see setup time drop from six months to just four weeks. Engineering effort can fall by up to 90%. First-year costs may drop by nearly half, which boosts your roi.
A metadata-driven engine ensures traceability and accessibility of your data. This saves up to $350,000 in the first year and gives you a faster time-to-insight. Unified integration with fabric lets you port existing data logic without extra work. You protect your previous investments and minimize migration effort. These strategies help you connect cost to value and maximize your return on investment.
| Methodology | Benefits | Impact on ROI |
|---|---|---|
| Automated medallion approach | Best practices by default, improved data quality, reduced maintenance effort | Setup time drops from 6 months to 4 weeks, engineering effort reduced by up to 90%, first-year costs cut nearly in half |
| Metadata-driven engine | Ensures traceability and accessibility of data | Saves up to $350,000 in the first year, faster time-to-insight |
| Unified integration with Fabric | Seamless porting of existing data logic | Minimizes migration effort, protects previous investments |
Tip: Always link your spending to business value. This practice ensures that every workflow supports your goals and increases your roi.
Regular Reviews and Optimization
You need to review your capacity and workloads often to keep your roi high. Frequent assessments of resource allocation help you match resources to changing demands. You should conduct regular capacity reviews every three to six months. This keeps your configurations in line with your current workload requirements. Adjust your licensing and capacity as your business grows or as you start new data projects. These steps help you avoid waste and make sure your spending brings real value.
- Review capacity and workloads every 3-6 months.
- Adjust licensing and capacity for business growth or new projects.
- Assess resource allocation to match changing needs.
You can use these reviews to spot trends, remove bottlenecks, and improve your workflows. Regular optimization keeps your platform efficient and your roi strong.
Note: Consistent reviews and adjustments protect your return on investment and ensure that your resources deliver maximum value.
Automation and Policy Controls
Automation and policy controls play a key role in maximizing roi. You can set up automated rules to pause idle resources, scale capacity, and manage data lifecycle. These controls help you avoid manual errors and keep your costs predictable. Automation ensures that your workflows run smoothly and only use resources when needed. Policy controls let you enforce standards for data retention, access, and cost allocation. You gain more control over your environment and see more value from your investment.
- Automate pausing and scaling to reduce waste.
- Use policy controls to enforce cost-saving standards.
- Monitor workflows to ensure they align with business value.
You should review your automation and policies regularly. This practice keeps your platform flexible and ready for new business needs. When you combine automation with strong policy controls, you create a system that delivers high roi and lasting value.
Callout: Automation and policy controls help you focus on value, not just cost. This approach drives better return on investment and supports your business goals.
Microsoft Fabric Cost Optimization Checklist
Quick Reference Table
You need a clear overview to manage costs in your platform. The quick reference table below helps you track important metrics and actions. Use this table to guide your daily decisions and keep your platform efficient.
| Metric Description | Key Action/Strategy |
|---|---|
| Monitor compute usage | Start small and right-size; trial F2/F4, monitor patterns, then resize or scale out. |
| Investigate unexplained background jobs | Use the Metrics app to pinpoint artifacts and terminate stuck sessions. |
| Leverage intelligent smoothing for variable workloads | Optimize costs by using a smaller SKU for average workloads and leverage smoothing for spikes. |
| Consider dynamically adjusting resources | Adjust resources based on real-time demands to maximize performance and minimize costs. |
| Monitor egress in Cost Management | Tag workspaces and set Azure cost alerts for bandwidth usage. |
| Plan network topology carefully | Design network topology to minimize cross-region transfer costs. |
Tip: Review this table regularly. It helps you spot trends and take action before costs rise in your platform.
Ongoing Best Practices
You can keep your platform cost-effective by following proven best practices. These steps help you avoid waste and maximize value.
- Audit your users to prevent unnecessary licensing costs in your platform.
- Right-size your capacity based on actual usage. Start with a small SKU and scale as your platform grows.
- Use Reserved Capacity for predictable workloads. This saves money and keeps your platform stable.
- Clean up storage by archiving cold data and deleting unused assets. This reduces storage costs in your platform.
- Automate cost awareness with budgets and alerts. Set up notifications to track spending in your platform.
- Minimize data movement. Keep data close to where it is processed to lower costs in your platform.
- Schedule scaling actions. Align resource scaling with peak demand times to optimize your platform.
- Use burstable instances for intermittent workloads. These are cost-effective options in your platform.
- Leverage spot instances for interruptible tasks. This strategy can provide significant savings in your platform.
- Implement tiered storage. Organize data based on access frequency to manage storage costs in your platform.
- Automate cost management. Use tools for real-time monitoring and budget alerts to control expenses in your platform.
Callout: Consistent use of these best practices keeps your platform efficient and supports your business goals.
You should review your platform regularly. Track your metrics, adjust your strategies, and stay proactive. This approach ensures your platform delivers value and avoids overspending.
You can stop overspending on Microsoft Fabric by combining smart technical choices with strong governance. Set up policies, classify your data, and use access controls to manage costs and security:
| Key Aspect | Description |
|---|---|
| Security and governance framework | Set policies early, including data classification and access control. |
| Data classification schema | Define categories like public, internal, confidential, and restricted. |
| Access control model | Use workspace roles and security at row and column levels. |
| Retention and lifecycle policies | Manage data lifecycle with clear retention rules. |
| Optimization phase | Fine-tune capacity and automate governance. |
| Cost savings areas | Save on licensing, infrastructure, and data overhead. |
Regularly review your capacity and workloads to keep savings on track. Many organizations see faster insights, lower costs, and a 379% ROI over three years.
"With Fabric, it's two clicks and that's it." – José Viegas, Senior Data Architect at IWG
You gain real business value when you manage costs proactively.
FAQ
What is Microsoft Fabric and how does it help with cost control?
You use Microsoft Fabric as a unified data platform. It lets you manage analytics, storage, and compute in one place. You gain better control over costs by monitoring workloads and using shared capacity. This approach supports data-driven decisions and real-time analytics.
How does the Microsoft Fabric pricing model work?
You pay for compute resources in Microsoft Fabric based on real-time workload behavior. The pricing model uses capacity units. You track usage in 30-second intervals. This model helps you align spending with business value and avoid waste.
Why do I see high costs in Microsoft Fabric?
You may see high costs if you run many workloads at once or schedule overlapping jobs. Unoptimized queries and poor orchestration also increase usage. Monitoring your environment helps you spot these issues and manage your Microsoft Fabric costs.
How can I optimize real-time analytics workloads in Microsoft Fabric?
You can schedule heavy jobs during off-peak hours. Use incremental refreshes and batch processing. Optimize queries and Spark jobs. These steps help you reduce compute usage and improve performance for real-time analytics in Microsoft Fabric.
What tools help me monitor Microsoft Fabric usage?
You use the Microsoft Fabric Capacity Metrics App to track compute usage. The Health Page and Compute Page show trends and highlight issues. The Fabric Chargeback App helps you allocate costs. These tools support data-driven management and cost control.
Can I pause resources in Microsoft Fabric to save money?
Yes, you can pause idle capacity in Microsoft Fabric. This stops charges until you resume activity. Scheduling pauses during low-use periods helps you save money and manage your data platform efficiently.
How does Microsoft Fabric support data-driven decisions?
Microsoft Fabric gives you unified data insights and real-time analytics. You can monitor workloads, optimize resources, and align costs with business goals. This approach helps you make data-driven decisions and maximize value from your data platform.
What are the benefits of Microsoft Fabric for organizations?
You gain a single platform for analytics, storage, and compute. Microsoft Fabric supports real-time analytics and unified governance. You can scale as needed, control costs, and drive business value with data-driven strategies.
🚀 Want to be part of m365.fm?
Then stop just listening… and start showing up.
👉 Connect with me on LinkedIn and let’s make something happen:
- 🎙️ Be a podcast guest and share your story
- 🎧 Host your own episode (yes, seriously)
- 💡 Pitch topics the community actually wants to hear
- 🌍 Build your personal brand in the Microsoft 365 space
This isn’t just a podcast — it’s a platform for people who take action.
🔥 Most people wait. The best ones don’t.
👉 Connect with me on LinkedIn and send me a message:
"I want in"
Let’s build something awesome 👊
1
00:00:00,000 --> 00:00:01,600
Your fabric bill keeps climbing,
2
00:00:01,600 --> 00:00:03,400
but your data volume barely moved.
3
00:00:03,400 --> 00:00:04,880
So teams do what teams always do.
4
00:00:04,880 --> 00:00:06,600
They blame growth, they blame licensing,
5
00:00:06,600 --> 00:00:07,720
they blame the SKU.
6
00:00:07,720 --> 00:00:09,800
But in a lot of environments, that's not the problem.
7
00:00:09,800 --> 00:00:12,560
The bill isn't reacting to how much data you stored.
8
00:00:12,560 --> 00:00:14,600
It's reacting to how your workloads behave
9
00:00:14,600 --> 00:00:17,000
every minute of the day, and that's where this breaks.
10
00:00:17,000 --> 00:00:19,040
Because fabric puts shared compute behind reports,
11
00:00:19,040 --> 00:00:21,480
refreshes, SQL pipelines, notebooks, warehouses,
12
00:00:21,480 --> 00:00:23,080
semantic models, all of it.
13
00:00:23,080 --> 00:00:24,840
So low value work doesn't stay local.
14
00:00:24,840 --> 00:00:27,640
It competes with the work that business actually cares about.
15
00:00:27,640 --> 00:00:29,320
In this episode, I'm going to show you
16
00:00:29,320 --> 00:00:32,640
where capacity units really go, why those spikes keep coming back,
17
00:00:32,640 --> 00:00:34,880
and what you can fix in the next 30 days.
18
00:00:34,880 --> 00:00:37,000
If fabric cost and governance matter to you,
19
00:00:37,000 --> 00:00:38,960
follow this podcast, because this is exactly
20
00:00:38,960 --> 00:00:41,040
the kind of problem we unpack here.
21
00:00:41,040 --> 00:00:42,360
The model behind the bill.
22
00:00:42,360 --> 00:00:44,880
To understand the bill, you need to understand the model behind it.
23
00:00:44,880 --> 00:00:47,400
Fabric doesn't charge you like a stack of separate products.
24
00:00:47,400 --> 00:00:49,880
It gives you one shared capacity pool,
25
00:00:49,880 --> 00:00:52,560
measured in capacity units, and that pool gets consumed
26
00:00:52,560 --> 00:00:55,720
by reports, refreshed jobs, SQL endpoint queries,
27
00:00:55,720 --> 00:00:57,600
pipelines, notebooks, warehouses,
28
00:00:57,600 --> 00:01:00,000
lakehouses, semantic models, and more.
29
00:01:00,000 --> 00:01:01,560
That shared model is the promise.
30
00:01:01,560 --> 00:01:03,720
If one workload is quiet, another workload
31
00:01:03,720 --> 00:01:04,880
can use the free headroom.
32
00:01:04,880 --> 00:01:07,480
On paper, that's efficient, and sometimes it is.
33
00:01:07,480 --> 00:01:10,320
If your usage is disciplined, shared compute works well
34
00:01:10,320 --> 00:01:12,640
because idle capacity doesn't just sit there waiting
35
00:01:12,640 --> 00:01:14,120
for one product team to wake up.
36
00:01:14,120 --> 00:01:15,400
It can be reused.
37
00:01:15,400 --> 00:01:16,400
That's the upside.
38
00:01:16,400 --> 00:01:18,880
But the moment teams start treating every engine
39
00:01:18,880 --> 00:01:21,160
as the default path, or the scheduled background work
40
00:01:21,160 --> 00:01:24,160
with no coordination, the same design turns against you,
41
00:01:24,160 --> 00:01:26,040
and one team's convenience starts showing up
42
00:01:26,040 --> 00:01:27,720
on everybody else's invoice.
43
00:01:27,720 --> 00:01:29,440
That's the shift most teams miss.
44
00:01:29,440 --> 00:01:30,840
They still think in silos.
45
00:01:30,840 --> 00:01:35,320
One report team, one data team, one SQL team, one pipeline owner.
46
00:01:35,320 --> 00:01:36,760
But Fabric doesn't bill in silos.
47
00:01:36,760 --> 00:01:38,080
It builds the shared pool.
48
00:01:38,080 --> 00:01:40,800
So a badly timed refresh, an expensive SQL pattern,
49
00:01:40,800 --> 00:01:43,840
or a noisy export process doesn't just hurt that one workload.
50
00:01:43,840 --> 00:01:46,800
It takes capacity away from everything else running in the same place.
51
00:01:46,800 --> 00:01:50,160
Now add one more layer because this is where people usually misread the charts.
52
00:01:50,160 --> 00:01:53,840
Fabric separates interactive operations from background operations.
53
00:01:53,840 --> 00:01:55,560
Interactive means user-driven activity,
54
00:01:55,560 --> 00:01:59,320
things like report queries, background means scheduled or system-driven work,
55
00:01:59,320 --> 00:02:01,880
refreshes, pipelines, data processing.
56
00:02:01,880 --> 00:02:05,200
And in a healthy environment, that split helps you see what users are asking
57
00:02:05,200 --> 00:02:07,720
for versus what the platform is doing behind the scenes.
58
00:02:07,720 --> 00:02:11,240
But background work can quietly eat your headroom before users even arrive.
59
00:02:11,240 --> 00:02:13,520
So when the business opens dashboards at 9 o'clock,
60
00:02:13,520 --> 00:02:15,880
the capacity already enters the day tired.
61
00:02:15,880 --> 00:02:18,000
Then smoothing makes the picture even less obvious.
62
00:02:18,000 --> 00:02:20,760
Short operations can be smoothed over at least five minutes,
63
00:02:20,760 --> 00:02:24,320
while long background operations can be smoothed over up to 24 hours.
64
00:02:24,320 --> 00:02:27,240
That means a short spike doesn't always look short on the financial side.
65
00:02:27,240 --> 00:02:29,520
Fabric also tracks carry forward overage,
66
00:02:29,520 --> 00:02:33,360
so excess usage can keep affecting the capacity after the original burst finished.
67
00:02:33,360 --> 00:02:34,560
That's why a team can say,
68
00:02:34,560 --> 00:02:36,640
"The spike only lasted a few minutes,
69
00:02:36,640 --> 00:02:41,080
and still feel pain much longer through delays, rejections, or extra cost."
70
00:02:41,080 --> 00:02:44,280
So when people obsess over storage growth, they're watching the wrong thing.
71
00:02:44,280 --> 00:02:45,360
Storage matters, sure.
72
00:02:45,360 --> 00:02:48,640
But the invoice reacts far more to compute behavior, query design,
73
00:02:48,640 --> 00:02:50,720
refresh overlap, and concurrency.
74
00:02:50,720 --> 00:02:52,520
You're not mainly paying for bytes at rest.
75
00:02:52,520 --> 00:02:56,040
You're paying for thousands of compute decisions spread across reports,
76
00:02:56,040 --> 00:02:58,200
jobs, and endpoints all day long.
77
00:02:58,200 --> 00:03:01,880
Once that shared model clicks, the next question gets very practical.
78
00:03:01,880 --> 00:03:04,920
Where is the money actually going?
79
00:03:04,920 --> 00:03:06,520
Where's CU's actually go?
80
00:03:06,520 --> 00:03:08,160
So where did the CU's actually go?
81
00:03:08,160 --> 00:03:10,680
Start with the metric that changes the conversation fastest.
82
00:03:10,680 --> 00:03:14,920
CU consumption by item, not monthly invoice total, not workspace size,
83
00:03:14,920 --> 00:03:17,920
not how many users you think are active, item level consumption,
84
00:03:17,920 --> 00:03:21,120
because that's where the pattern stops being abstract and starts naming names.
85
00:03:21,120 --> 00:03:24,160
Open the capacity metrics app and look at the top consumers.
86
00:03:24,160 --> 00:03:27,840
In a lot of environments, you won't find a broad, evenly distributed load.
87
00:03:27,840 --> 00:03:29,440
You'll find concentration.
88
00:03:29,440 --> 00:03:32,200
A small set of assets pulling a huge share of compute,
89
00:03:32,200 --> 00:03:34,520
sometimes 10 items explain most of the pressure.
90
00:03:34,520 --> 00:03:37,880
And once you see that, the story shifts from fabric is expensive
91
00:03:37,880 --> 00:03:39,720
to these specific things are expensive.
92
00:03:39,720 --> 00:03:40,920
That's a very different problem.
93
00:03:40,920 --> 00:03:44,680
In most organizations, the top offenders are pretty predictable.
94
00:03:44,680 --> 00:03:48,240
SQL endpoint queries, semantic model refreshes, data flows,
95
00:03:48,240 --> 00:03:50,840
pipelines that overlap more than anyone realized,
96
00:03:50,840 --> 00:03:54,200
and sometimes exports or ad hoc access patterns that look harmless
97
00:03:54,200 --> 00:03:58,640
because each action feels small, but they repeat all day and keep pulling from the same pool.
98
00:03:58,640 --> 00:04:03,360
So what looks like normal usage from each team turns into constant pressure at the capacity level.
99
00:04:03,360 --> 00:04:07,480
The thing most people miss is the split between interactive and background activity.
100
00:04:07,480 --> 00:04:10,920
If the interactive side is high, that usually maps to actual user demand.
101
00:04:10,920 --> 00:04:15,040
Reports opening, filters changing, queries running because people are using the platform
102
00:04:15,040 --> 00:04:15,800
that may be fine.
103
00:04:15,800 --> 00:04:20,000
But when background usage dominates, especially before the business day even starts,
104
00:04:20,000 --> 00:04:23,120
you need to ask a harder question, is this worth creating value
105
00:04:23,120 --> 00:04:25,920
or is it just running because nobody challenged the schedule?
106
00:04:25,920 --> 00:04:30,440
That distinction matters because user demand and system waste don't get fixed the same way.
107
00:04:30,440 --> 00:04:32,160
And this is where time of day becomes useful.
108
00:04:32,160 --> 00:04:34,480
Don't just ask what consumers use, ask when.
109
00:04:34,480 --> 00:04:36,000
Weekday peaks tell one story.
110
00:04:36,000 --> 00:04:37,440
Quarter and reporting tells another.
111
00:04:37,440 --> 00:04:41,880
Repeated surges every 30 to 60 minutes usually point somewhere very specific.
112
00:04:41,880 --> 00:04:45,440
Refresh overlap, pipeline collisions, recurring jobs,
113
00:04:45,440 --> 00:04:48,560
or query bursts tied to the same operational rhythm.
114
00:04:48,560 --> 00:04:52,960
Once you line up the time pattern with the top items, the hidden structure starts to show itself.
115
00:04:52,960 --> 00:04:57,840
You'll often see a pattern like this, calm periods overnight, then scheduled background jobs kick in.
116
00:04:57,840 --> 00:04:59,760
Capacity climbs before users arrive.
117
00:04:59,760 --> 00:05:04,320
Business hours begin, interactive demand lands on top of unfinished background work,
118
00:05:04,320 --> 00:05:06,040
and suddenly performance drops.
119
00:05:06,040 --> 00:05:11,360
Not because one dashboard is broken, but because the room was already crowded before the meeting started.
120
00:05:11,360 --> 00:05:14,200
That's also why the throttling events timeline matters so much.
121
00:05:14,200 --> 00:05:18,160
If throttling appears as random noise, maybe you're dealing with genuine variability.
122
00:05:18,160 --> 00:05:22,960
But if it shows up in repeatable spikes, same times, same windows, same kinds of items,
123
00:05:22,960 --> 00:05:27,760
you're looking at a design issue, usually concurrency, sometimes rooting, often both.
124
00:05:27,760 --> 00:05:30,360
A raw under provisioning problem would look more like steady pressure.
125
00:05:30,360 --> 00:05:33,160
These environments don't, they pulse.
126
00:05:33,160 --> 00:05:35,200
And Fabric's own guidance helps here.
127
00:05:35,200 --> 00:05:39,760
When peak utilization keeps pushing into the 70 to 80% range, you need to act.
128
00:05:39,760 --> 00:05:43,000
Below 40% may point the other way, bad allocation,
129
00:05:43,000 --> 00:05:45,360
over sizing or capacity sitting underused.
130
00:05:45,360 --> 00:05:48,560
So the job is not keep utilization low at all costs.
131
00:05:48,560 --> 00:05:52,360
The job is to understand whether the shape of utilization matches business value.
132
00:05:52,360 --> 00:05:54,560
High usage during real demand can be healthy.
133
00:05:54,560 --> 00:05:58,160
High usage from low value repetition is just waste with a chart attached.
134
00:05:58,160 --> 00:06:01,360
If you remember nothing else from this section, remember this.
135
00:06:01,360 --> 00:06:02,760
Don't start with the bill.
136
00:06:02,760 --> 00:06:05,960
Start with the top items, the interactive versus background split,
137
00:06:05,960 --> 00:06:08,160
the time pattern and the throttling timeline.
138
00:06:08,160 --> 00:06:10,960
Those four views usually tell you who is burning the budget,
139
00:06:10,960 --> 00:06:15,560
whether users caused it, and whether the issue is constant demand or preventable collisions.
140
00:06:15,560 --> 00:06:18,360
Once you have that, the next question gets sharper,
141
00:06:18,360 --> 00:06:22,960
not who consumed the most, but why those items consume so much in the first place.
142
00:06:22,960 --> 00:06:25,360
Scenario one, the SQL convenience tax.
143
00:06:25,360 --> 00:06:28,360
One pattern shows up again and again in client environments,
144
00:06:28,360 --> 00:06:30,360
and it usually starts with a reasonable decision.
145
00:06:30,360 --> 00:06:32,960
People know SQL, analysts know SQL, engineers know SQL,
146
00:06:32,960 --> 00:06:36,960
report builders trust SQL because it feels direct, familiar and fast to start with.
147
00:06:36,960 --> 00:06:40,360
So the SQL endpoint becomes the easiest answer to almost every request.
148
00:06:40,360 --> 00:06:43,160
Need a quick query use SQL, need an export use SQL,
149
00:06:43,160 --> 00:06:47,960
need a report source use SQL, need a shortcut because the business wants something by Friday use SQL again.
150
00:06:47,960 --> 00:06:50,360
That's not a technical failure, it's a behavior pattern.
151
00:06:50,360 --> 00:06:53,960
And once that pattern settles in, SQL stops being one access path
152
00:06:53,960 --> 00:06:56,560
and turns into the default compute layer for the whole platform.
153
00:06:56,560 --> 00:06:58,960
That's where cost starts drifting away from value.
154
00:06:58,960 --> 00:07:03,760
I've seen environments where SQL workloads took roughly 70 to 80% of total CU consumption,
155
00:07:03,760 --> 00:07:06,760
while the business value behind those queries was all over the place.
156
00:07:06,760 --> 00:07:08,760
Some useful, some repetitive,
157
00:07:08,760 --> 00:07:12,560
some just habits nobody challenged because the endpoint kept saying yes.
158
00:07:12,560 --> 00:07:15,360
The line I keep coming back to is simple.
159
00:07:15,360 --> 00:07:19,160
SQL was not wrong, it was used for everything, that distinction matters.
160
00:07:19,160 --> 00:07:22,960
Because teams often defend this setup by saying, "But SQL is simpler."
161
00:07:22,960 --> 00:07:26,560
And they're right from the user side, simpler to write, simpler to hand over,
162
00:07:26,560 --> 00:07:28,960
simpler to debug if your team grew up in that world.
163
00:07:28,960 --> 00:07:31,560
But simple for the user can be expensive for the platform,
164
00:07:31,560 --> 00:07:34,360
especially when the same endpoint gets hit by broad scans,
165
00:07:34,360 --> 00:07:36,560
repeated reads over large delta tables,
166
00:07:36,560 --> 00:07:40,760
ad hoc exploration, exports, and workloads that really belong somewhere else.
167
00:07:40,760 --> 00:07:44,560
This clicked for me when I saw how often the endpoint had become a universal answer,
168
00:07:44,560 --> 00:07:46,760
not because it was the best engine for each job,
169
00:07:46,760 --> 00:07:49,360
but because it removed the need to decide.
170
00:07:49,360 --> 00:07:52,160
And once you stop deciding, you stop routing work properly.
171
00:07:52,160 --> 00:07:54,360
Research makes that contrast hard to ignore.
172
00:07:54,360 --> 00:07:57,360
Spark direct operations can be far more efficient
173
00:07:57,360 --> 00:07:59,560
than rooting the wrong job through a SQL endpoint,
174
00:07:59,560 --> 00:08:01,960
and one benchmark in the source material is brutal.
175
00:08:01,960 --> 00:08:05,160
A complex query pattern through a Spark to SQL endpoint connector
176
00:08:05,160 --> 00:08:10,160
came out 32 times costlier, and 73 times slower than running directly in Spark.
177
00:08:10,160 --> 00:08:11,560
That's not a small tuning gap.
178
00:08:11,560 --> 00:08:13,960
That's the platform charging you for architectural laziness.
179
00:08:13,960 --> 00:08:15,960
Now that doesn't mean SQL endpoints are bad,
180
00:08:15,960 --> 00:08:18,160
it means they fit some jobs and punish others.
181
00:08:18,160 --> 00:08:22,160
Lightweight reads, familiar access, straightforward consumption patterns, fine.
182
00:08:22,160 --> 00:08:26,360
Heavy transformation, repeated scanning, using connectors that stack one engine on top of another,
183
00:08:26,360 --> 00:08:28,360
that's where the bill starts swelling,
184
00:08:28,360 --> 00:08:30,560
without a matching jump in business outcome.
185
00:08:30,560 --> 00:08:32,560
What typically happens next is predictable.
186
00:08:32,560 --> 00:08:37,560
During business hours, the SQL load climbs because everyone is doing the convenient thing at the same time.
187
00:08:37,560 --> 00:08:40,560
Interactive pressure rises, other workloads lose room,
188
00:08:40,560 --> 00:08:43,560
and then Spark heavy work starts getting throttled or delayed.
189
00:08:43,560 --> 00:08:46,560
The operators look at fabric and think the platform is unstable,
190
00:08:46,560 --> 00:08:51,560
but in many of these cases, the platform is doing exactly what the workload mix forced it to do.
191
00:08:51,560 --> 00:08:53,560
So the real fix is not to band SQL.
192
00:08:53,560 --> 00:08:54,560
That would be silly.
193
00:08:54,560 --> 00:08:57,560
The fix is to stop treating SQL as the universal front door.
194
00:08:57,560 --> 00:09:00,560
You need a routing decision, which jobs belong on SQL,
195
00:09:00,560 --> 00:09:03,560
because they're light and read focused, and which belong on Spark,
196
00:09:03,560 --> 00:09:07,560
because they transform, scan hard, or scale badly through endpoint patterns.
197
00:09:07,560 --> 00:09:12,560
Without that decision, convenience keeps winning, and convenience has a CU price.
198
00:09:12,560 --> 00:09:14,560
And once you see that first leak clearly,
199
00:09:14,560 --> 00:09:16,560
another one usually appears right next to it,
200
00:09:16,560 --> 00:09:21,560
not from familiarity this time, but from teams scheduling work with no shared control at all.
201
00:09:21,560 --> 00:09:24,560
Scenario 2, the invisible refresh storm.
202
00:09:24,560 --> 00:09:26,560
The second pattern looks different on the surface,
203
00:09:26,560 --> 00:09:27,560
but it creates the same outcome.
204
00:09:27,560 --> 00:09:31,560
Capacity gets drained by work that feels normal to each team in isolation,
205
00:09:31,560 --> 00:09:35,560
while nobody sees the combined effect until users start complaining.
206
00:09:35,560 --> 00:09:37,560
This time, the driver isn't convenience.
207
00:09:37,560 --> 00:09:39,560
It's coordination failure.
208
00:09:39,560 --> 00:09:40,560
What typically happens is simple.
209
00:09:40,560 --> 00:09:43,560
The BI team schedules data set refreshes based on report needs.
210
00:09:43,560 --> 00:09:46,560
A data team schedules data flows on its own cadence.
211
00:09:46,560 --> 00:09:48,560
Someone else adds semantic model refreshes.
212
00:09:48,560 --> 00:09:51,560
Pipelines run when upstream jobs finish, or when someone guessed they should.
213
00:09:51,560 --> 00:09:53,560
Each choice sounds reasonable.
214
00:09:53,560 --> 00:09:54,560
Each team has a local reason.
215
00:09:54,560 --> 00:09:57,560
But nobody owns the full refresh map across the capacity,
216
00:09:57,560 --> 00:10:01,560
so the system fills up with overlapping background work that keeps colliding.
217
00:10:01,560 --> 00:10:04,560
Then the pattern shows up in the metrics, spikes every 30 to 60 minutes,
218
00:10:04,560 --> 00:10:07,560
the same windows, the same bursts, concurrency rises,
219
00:10:07,560 --> 00:10:12,560
throttling events appear, and report users start feeling lag right when the business needs stable performance.
220
00:10:12,560 --> 00:10:15,560
From the front end, it looks like fabric slowed down.
221
00:10:15,560 --> 00:10:19,560
One layer deeper, the platform is busy replaying a schedule nobody designed as a whole.
222
00:10:19,560 --> 00:10:21,560
The line that usually explains the mess is this.
223
00:10:21,560 --> 00:10:25,560
No one owned refresh orchestration, so everyone scheduled independently.
224
00:10:25,560 --> 00:10:27,560
That's not a small operational detail.
225
00:10:27,560 --> 00:10:29,560
It changes the economics of the platform.
226
00:10:29,560 --> 00:10:32,560
Semantic model refreshes can need much more memory than the final model size,
227
00:10:32,560 --> 00:10:36,560
because new structures are built while the old version is still in memory.
228
00:10:36,560 --> 00:10:42,560
Research in the source material points out that refresh operations can require two times or more memory than the resting model.
229
00:10:42,560 --> 00:10:47,560
So a model that looks manageable at rest can still create a large processing peak when it refreshes.
230
00:10:47,560 --> 00:10:51,560
Now stack several of those peaks together, add data flows, add pipelines,
231
00:10:51,560 --> 00:10:54,560
and you've built pressure that was never visible in storage numbers.
232
00:10:54,560 --> 00:10:57,560
And there's another reason this stays hidden for too long.
233
00:10:57,560 --> 00:11:00,560
Background work doesn't always fail loudly. It just keeps consuming headroom.
234
00:11:00,560 --> 00:11:03,560
Fabric smooths longer background operations over extended windows,
235
00:11:03,560 --> 00:11:08,560
which means the load can linger financially and operationally after the trigger event passed.
236
00:11:08,560 --> 00:11:12,560
So the people who scheduled the jobs think they ran overnight or every half hour and finished.
237
00:11:12,560 --> 00:11:15,560
The users who open reports later feel the consequence.
238
00:11:15,560 --> 00:11:20,560
Those two experiences don't look connected unless someone studies the capacity behavior as one system.
239
00:11:20,560 --> 00:11:24,560
This is also where the fabric is under provisioned argument starts to fall apart.
240
00:11:24,560 --> 00:11:29,560
If the environment truly lacked enough capacity all day long, the graphs would show broad sustained pressure.
241
00:11:29,560 --> 00:11:32,560
But that's not what these cases look like. They jump. They repeat.
242
00:11:32,560 --> 00:11:36,560
They cluster around windows that match refresh cycles and pipeline timing.
243
00:11:36,560 --> 00:11:39,560
That's not a pure capacity story. It's a concurrency story.
244
00:11:39,560 --> 00:11:42,560
The same goes for data volume is the problem. Data growth matters.
245
00:11:42,560 --> 00:11:47,560
But it doesn't explain why modest changes in stored data can sit next to much larger jumps in CU consumption.
246
00:11:47,560 --> 00:11:53,560
What explains that gap is execution getting worse, more full refreshes, more overlap, more duplicate processing,
247
00:11:53,560 --> 00:11:57,560
more schedules layered on top of each other because every team solved freshness on its own.
248
00:11:57,560 --> 00:12:00,560
So the fix is not another dashboard showing the pain after it happens.
249
00:12:00,560 --> 00:12:03,560
The fix is governance that changes behavior before the next collision starts.
250
00:12:03,560 --> 00:12:08,560
Someone has to own the refresh calendar, the dependency logic and the order of operations across teams.
251
00:12:08,560 --> 00:12:13,560
Without that, background work keeps looking invisible right up until the moment the business feels it.
252
00:12:13,560 --> 00:12:15,560
Why more capacity usually makes this worse?
253
00:12:15,560 --> 00:12:19,560
So when teams finally see the pressure, the first instinct is obvious.
254
00:12:19,560 --> 00:12:24,560
By more capacity, move up the SKU, turn on overage, give the system more room and hope the problem settles down.
255
00:12:24,560 --> 00:12:30,560
And for a little while it often does. Dashboards open faster, complaints drop, the graphs look calmer, leadership feels relief.
256
00:12:30,560 --> 00:12:36,560
But the model behind that relief is dangerous because extra headroom can hide bad behavior instead of correcting it.
257
00:12:36,560 --> 00:12:43,560
If low-value queries, poor routing and unmanaged refresh overlaps stay in place, new capacity doesn't remove the waste.
258
00:12:43,560 --> 00:12:48,560
It gives the waste more space to grow. The expensive query still runs, the overlapping refreshes still collide.
259
00:12:48,560 --> 00:12:55,560
The endpoint still gets used as the default answer. You just stop feeling the pain immediately, which makes the organization think the design is now fine.
260
00:12:55,560 --> 00:12:59,560
It isn't. And overage has the same trap. It can help with real bursts, that matters.
261
00:12:59,560 --> 00:13:08,560
If you have quarter end demand, planned reporting peaks, or known windows where you genuinely need flexibility, overage can protect the business from hard throttling.
262
00:13:08,560 --> 00:13:13,560
But if overage becomes normal, then you didn't solve variability. You funded it at a higher rate.
263
00:13:13,560 --> 00:13:17,560
In the research, overage is positioned as a safety net, not an operating model.
264
00:13:17,560 --> 00:13:21,560
The moment it becomes your routine answer, you're paying premium rates to preserve weak governance.
265
00:13:21,560 --> 00:13:25,560
That's why I push back when people say we need more capacity to scale.
266
00:13:25,560 --> 00:13:33,560
Maybe, sometimes they do, but scale has shape. If the pressure is broad, stable and tied to real demand, more capacity may be the right move.
267
00:13:33,560 --> 00:13:41,560
If the pressure is clustered, repetitive and tied to the same collisions every day, more capacity just lets broken routing and bad schedules keep expanding.
268
00:13:41,560 --> 00:13:47,560
You're not scaling growth, you're scaling waste. And one level deeper, this isn't really a tooling problem, it's an ownership problem.
269
00:13:47,560 --> 00:13:56,560
Who decides which engine gets used for which kind of work, who decides when refresh is run, who stops one team from pushing cost into a shared pool everyone else depends on.
270
00:13:56,560 --> 00:14:02,560
In a lot of fabric environments, the answer is nobody with enough authority to enforce it, so the platform becomes permissive.
271
00:14:02,560 --> 00:14:05,560
And permissive systems always drift toward higher spend.
272
00:14:05,560 --> 00:14:11,560
That matters for executives because this doesn't show up as one big bad decision that shows up as hundreds of small decisions that look harmless on their own.
273
00:14:11,560 --> 00:14:24,560
One more refresh, one more export, one more query pattern, nobody challenged, one more workload left on the wrong path because moving it felt inconvenient, add those together across a shared capacity and the bill climbs long before anyone admits the operating model is weak.
274
00:14:24,560 --> 00:14:33,560
So the message to leadership is pretty blunt. You are not paying for data, you are paying for compute choices, repeated all day, across teams that may not even realize they are affecting each other.
275
00:14:33,560 --> 00:14:42,560
Until those choices get governed, capacity will keep feeling smaller than it should, no matter how much you buy, that's why the right next move isn't panic purchasing, it's a short governance reset.
276
00:14:42,560 --> 00:14:52,560
The 30 day governance reset, if you want the bill to calm down, you need a reset that changes workload behavior fast, not a six month architecture program, not a giant redesign, 30 days.
277
00:14:52,560 --> 00:14:57,560
Clear owners, clear rules, and a weekly review rhythm that forces choices.
278
00:14:57,560 --> 00:15:04,560
Start with workload isolation, split BI and SQL heavy demand from engineering and Spark heavy work where that pressure is hurting each other.
279
00:15:04,560 --> 00:15:12,560
That can mean dedicated capacities, or a cleaner separation of workspaces and critical workloads, so one side stops draining the other.
280
00:15:12,560 --> 00:15:19,560
The point is simple, stop letting business facing consumption compete directly with heavy engineering patterns when they don't need to share the same blast radius.
281
00:15:19,560 --> 00:15:26,560
Then put guard rails around the SQL endpoint, not because SQL is bad, but because open-ended convenience becomes expensive fast.
282
00:15:26,560 --> 00:15:35,560
Look for long running queries, broad scans, export heavy patterns, and repeated access against large tables where the endpoint keeps getting used as the default answer.
283
00:15:35,560 --> 00:15:39,560
You need standards for what belongs there, what doesn't, and who gets to approve exceptions.
284
00:15:39,560 --> 00:15:43,560
If nobody owns that boundary, the endpoint keeps expanding until it becomes the bill.
285
00:15:43,560 --> 00:15:51,560
The next move is refresh orchestration, this one usually pays back quickly because the waste is often mechanical, centralized scheduling, stagger refresh windows,
286
00:15:51,560 --> 00:15:57,560
removed duplicate refreshes that exist only because teams built around each other without knowing it.
287
00:15:57,560 --> 00:16:05,560
Where semantic model refreshes can collide, use dependency aware pipelines and waiting logic so one process checks whether another is still running before it starts.
288
00:16:05,560 --> 00:16:12,560
Research around fabric refresh conflicts points to polling patterns as a practical fix, because retries alone don't solve unpredictable overlap.
289
00:16:12,560 --> 00:16:16,560
After that, make cost visible by team, domain, and use case.
290
00:16:16,560 --> 00:16:19,560
Showback changes behavior because it removes the shared illusion.
291
00:16:19,560 --> 00:16:23,560
Once teams can see which workloads consume the capacity, the conversation gets more honest.
292
00:16:23,560 --> 00:16:27,560
The goal isn't to shame anybody, it's to stop treating the capacity like free air.
293
00:16:27,560 --> 00:16:31,560
Fabrics charge back and monitoring capabilities exist for exactly this reason.
294
00:16:31,560 --> 00:16:35,560
The moment people see who burns what, optimization stops feeling optional.
295
00:16:35,560 --> 00:16:37,560
Then define a routing strategy.
296
00:16:37,560 --> 00:16:45,560
Every transformation work goes to spark, lightweight read patterns can stay where SQL fits, and that sounds obvious, but most environments drift because nobody writes the rule down.
297
00:16:45,560 --> 00:16:52,560
So write it down, which query shapes stay on SQL, which data preparation parts go elsewhere, which shortcuts are allowed in dev, but not in production.
298
00:16:52,560 --> 00:16:59,560
Governance works when the model is visible enough that teams don't have to guess every time, and don't turn this into a dashboard hobby, put an operating rhythm behind it.
299
00:16:59,560 --> 00:17:05,560
Every week review the top CU offenders by item, look at the throttling pattern, ask one decision for each top consumer.
300
00:17:05,560 --> 00:17:11,560
Optimize it, isolate it or retire it. That's it. Small set of assets, clear action, repeated weekly.
301
00:17:11,560 --> 00:17:14,560
Because the fastest path to control is rarely platform wide reform.
302
00:17:14,560 --> 00:17:19,560
It's direct pressure on the few things driving most of the pain. That matters for leadership too.
303
00:17:19,560 --> 00:17:22,560
Executives don't need every technical detail, but they do need the model.
304
00:17:22,560 --> 00:17:26,560
A small number of assets can drive most of the cost, so governance should start there.
305
00:17:26,560 --> 00:17:29,560
Not with broad policy language no one can enforce.
306
00:17:29,560 --> 00:17:39,560
Pick the top offenders, assign owners, set deadlines, review again in seven days, when teams know the bill is being traced back to workload choices, the whole platform starts behaving differently.
307
00:17:39,560 --> 00:17:44,560
And this is the shift. Stop thinking about fabric as a storage problem with a bigger invoice attached.
308
00:17:44,560 --> 00:17:49,560
Start treating it as a shared compute system that needs routing, ownership and discipline.
309
00:17:49,560 --> 00:17:56,560
So the issue isn't mainly how much data you keep, it's how shared compute gets consumed by which workloads at what times and with what level of control.
310
00:17:56,560 --> 00:18:03,560
Pull your top CU by item view, take the top ten offenders and label each one, keep, fix, isolate or retire.
311
00:18:03,560 --> 00:18:09,560
If this changed how you think about your fabric bill, leave a review, it helps more teams find the show and connect with me.
312
00:18:09,560 --> 00:18:13,560
Mercopeters on LinkedIn with the next cost pattern you want unpacked.

Founder of m365.fm, m365.show and m365con.net
Mirko Peters is a Microsoft 365 expert, content creator, and founder of m365.fm, a platform dedicated to sharing practical insights on modern workplace technologies. His work focuses on Microsoft 365 governance, security, collaboration, and real-world implementation strategies.
Through his podcast and written content, Mirko provides hands-on guidance for IT professionals, architects, and business leaders navigating the complexities of Microsoft 365. He is known for translating complex topics into clear, actionable advice, often highlighting common mistakes and overlooked risks in real-world environments.
With a strong emphasis on community contribution and knowledge sharing, Mirko is actively building a platform that connects experts, shares experiences, and helps organizations get the most out of their Microsoft 365 investments.