

Is Your Microservice Architecture a Ticking Time Bomb for Speed


In this episode of the M365.fm podcast, Mirko Peters explores why many microservice architectures gradually become slower, more fragile, and harder to manage despite originally being designed for speed and agility. What begins as a clean and scalable architecture often turns into a complex web of dependencies where even small feature changes require coordination across multiple services, teams, APIs, and deployment pipelines.
The episode explains how distributed systems introduce hidden operational costs that are often underestimated during the early stages of adoption. Network latency, cascading failures, service dependencies, duplicated logic, and excessive inter-service communication can silently reduce development velocity while increasing operational complexity. Instead of accelerating innovation, poorly governed microservice environments can create organizational bottlenecks and technical debt that slow teams down over time.
Mirko discusses why architectural decisions should be driven by business boundaries and operational realities rather than trends or hype. He highlights how many organizations decompose systems too early without fully understanding domain ownership, team maturity, observability requirements, or deployment dependencies. The result is often a fragmented platform that becomes difficult to troubleshoot, secure, and evolve.
The episode also covers the importance of telemetry, clear service contracts, governance, and platform engineering in maintaining healthy microservice ecosystems. Rather than blindly splitting applications into smaller pieces, organizations need to balance autonomy with operational simplicity and long-term maintainability.
This episode offers practical insights for architects, developers, and IT leaders looking to avoid the hidden traps of microservice sprawl and design systems that truly support scalable delivery and resilience.


Microservice Architecture can act as a ticking time bomb for speed. You might notice hidden complexity slowing you down, especially in .NET environments. The Microsoft Development Podcast explores these challenges, focusing on operational overheads that affect real teams. Many organizations struggle with coordination costs, API governance, and the risk of distributed monoliths. Common issues include:
- Services becoming tightly coupled, causing deployment headaches.
- Shared databases turning microservices into simple CRUD wrappers.
- Synchronous communication making maintenance harder.
You should reflect on your own setup. Performance problems might lurk beneath the surface.
Key Takeaways
- Microservices can create hidden complexities that slow down performance. Be aware of symptoms like tight coupling and shared databases.
- A distributed monolith can emerge when services depend too much on each other. This leads to increased latency and deployment challenges.
- Strong API governance is essential. Balance strictness to avoid technical debt while ensuring developers can work efficiently.
- Coordination overhead can consume significant time. Streamline communication and clarify roles to enhance team productivity.
- Monitor key metrics like response times and error rates to identify performance bottlenecks early. Use tools for better observability.
- Asynchronous communication can improve scalability and reliability. Implement message queues to decouple services and reduce bottlenecks.
- Avoid shared databases to prevent coupling issues. Each service should ideally have its own database for better performance.
- Regularly evaluate your architecture fit. If you notice slow delivery or rising operational costs, consider consolidating services.
Microservice Architecture: Hidden Complexity

Distributed Monoliths
Symptoms
You may think that splitting your application into microservices will solve performance issues. However, you can end up with a distributed monolith. This happens when services depend on each other so much that you lose the benefits of separation. You might notice these symptoms:
- Services rely on synchronous calls for every operation.
- Teams struggle to deploy changes without affecting other services.
- Shared databases force you to coordinate schema changes across multiple teams.
- Components remain tightly coupled, even though they run in separate processes.
Speed Impact
A distributed monolith can slow your system down in ways you do not expect. You see network latency increase because every service-to-service call adds delay. Unlike a monolithic application, microservice architecture shifts bottlenecks from the database or CPU to the network. Synchronous calls across microservices accumulate latency, while a monolith handles these calls in-process. You lose the ability to scale services independently and isolate faults. Performance challenges grow as dependencies multiply.
When you try to distribute a monolithic application, you often face performance challenges. Components stay heavily dependent on each other, and you do not gain the benefits of independent scaling or fault isolation that well-structured microservices provide.
Coordination Overhead
API Governance
Microservice architecture requires strong API governance. You must review and approve every change to avoid technical debt and duplicated efforts. If governance is too strict, you slow down development. If it is too lax, you risk building up technical debt quickly.
When governance is either too lax or too strict, it can lead to technical debt, duplicated efforts, and slowdowns in the development process.
Essentially, you’re building a whole load of technical debt very quickly. And in the end, do you have to spend more money and more time ripping that all out and starting again.
You need to design governance to benefit developers. Automation helps improve API quality, security, and consistency.
When governance is designed to benefit developers and reinforced with automation, it serves as a catalyst for improved API quality, security, and consistency.
APIs play a critical role in your business strategy. You must treat them as first-class citizens.
In the latest state of API integration report, 84 percent of businesses said that APIs were critical or very critical to their business strategy.
Team Collaboration
Microservices demand constant coordination between teams. You spend time preparing for meetings, switching contexts, and clarifying roles. These activities can consume a large portion of your workweek.
| Coordination Cost Factors | Description |
|---|---|
| Decision Latency | Delays due to multiple stakeholders and approval chains |
| Context Switching | Fragmented attention across various coordination points |
| Information Decay | Loss or distortion of critical knowledge through layers |
| Role Ambiguity | Unclear accountability leading to gaps and duplicated efforts |
| Coordination Activity | Time Spent |
|---|---|
| Meeting Preparation | Over 8 hours per week |
| Coordination Activities | 35-80% of knowledge workers' time |
You must recognize that coordination overhead can slow down delivery. You need clear roles and streamlined communication to avoid gaps and duplicated efforts.
.NET Ecosystem Challenges
Platform Engineering
Microservice architecture in the .NET ecosystem brings unique challenges. You face code duplication and redundancies, which increase maintenance efforts and risk inconsistencies. Developers often deal with boilerplate code for infrastructure. Organizing source code becomes difficult, especially when you share models across services. Copy-and-paste anti-patterns delay bug fixes and complicate maintenance.
- Code duplication leads to higher maintenance costs.
- Shared models across services make updates harder.
- Developers may copy and paste code, which slows down bug fixes.
Domain Boundaries
You must define clear domain boundaries when you build microservices in .NET. If you do not, you increase developer cognitive load. Too many simultaneous demands overwhelm your team. Upholding standards and compliance becomes difficult, which can cause reliability issues and weaken your security posture.
- Cognitive load rises as developers juggle multiple services.
- Standards and compliance become harder to enforce.
- Reliability and security suffer when boundaries are unclear.
Microservice architecture offers many benefits, but you must address hidden complexity. You need to watch for distributed monolith symptoms, manage coordination overhead, and tackle .NET-specific challenges. If you do not, you risk slowing down your development process and losing the advantages you hoped to gain.
Ticking Time Bomb: Performance Problems
You may think microservices will always boost speed, but they can become a ticking time bomb for your system. Many teams discover common performance problems only after deployment. These issues often hide beneath the surface, waiting to slow down your application when you least expect it. You need to understand how latency, failure points, and database contention can turn your architecture into a source of frustration.
Network Latency
In-Process vs Network Calls
When you use microservices, you move from in-process function calls to network calls. This shift introduces significant latency. In a monolithic application, a function call happens almost instantly. In microservices, every service-to-service call travels across the network, which adds delay.
| Architecture Type | Average Latency |
|---|---|
| In-process function call (monolith) | 0.001 ms (1 microsecond) |
| HTTP call within same datacenter (microservices) | 1-5 ms (1,000-5,000 microseconds) |
You can see that network calls are thousands of times slower than in-process calls. This difference adds up quickly as your system grows. Each new service introduces more latency, which can turn simple operations into slow, frustrating experiences for users.
Resource Usage
Network calls do not just add latency. They also increase resource usage. Every call uses CPU, memory, and bandwidth. As you add more microservices, you create more network traffic. This extra load can lead to higher costs and slower response times. You may notice your servers working harder, even when handling the same amount of business logic.
You can improve performance by reducing unnecessary inter-service calls. Some teams use intelligent traffic management to lower latency and boost resilience. For example:
- The MCG approach improved response times by 15% under increased network latency due to reduced inter-service communication delays.
- Under peak load conditions, the MCG-enhanced setup showed better resilience with fewer errors compared to the service mesh-only configuration, indicating that intelligent traffic management can enhance system robustness and reduce latency.
- Performance evaluations demonstrated that the MCG placement strategy mitigated overhead from sidecar proxies, leading to lower response times and improved stability as traffic intensity increased.
You should always monitor how network calls affect your system’s performance. Small delays can add up and become a major source of performance problems.
Failure Points
Propagation Risks
Microservices can introduce new failure points. Each service depends on others, so a single failure can ripple through your system. You must understand how these risks compare to monolithic architectures.
| Architecture Type | Failure Propagation Risk | Fault Isolation | System Resilience |
|---|---|---|---|
| Monolithic | High | No | Low |
| Microservices | Low | Yes | High |
In a monolithic system, one bug can bring down the entire application. Microservices offer better fault isolation. If one service fails, others can keep running. Patterns like circuit breakers help prevent failures from spreading. You can build more resilient systems, but you must design for these risks from the start.
- In a monolithic architecture, a single bug can lead to a complete system failure, creating a single point of failure.
- Microservices allow for fault tolerance, where failures in non-critical components do not affect the entire system.
- Patterns like circuit breakers enhance resilience by preventing failing services from impacting others.
Observability Challenges
You need strong observability to detect and fix performance problems in microservices. With many services, tracking down the root cause of latency or errors becomes harder. You must collect logs, metrics, and traces from every service. Without good observability, you may spend hours searching for the source of a slowdown.
Common performance problems often hide in complex call chains. You should use distributed tracing to follow requests across services. This approach helps you spot bottlenecks and fix them before they impact users.
You may also face these common failure points in microservices:
- God Service (Too Much Responsibility): A service that handles multiple responsibilities, violating the Single Responsibility Principle, making it hard to test and scale.
- Tight Coupling Between Services: Direct dependencies between services that lead to issues when one service changes, complicating testing and scaling.
You must design your system to avoid these traps. Clear boundaries and simple responsibilities help you maintain performance.
Database Contention
Shared Data Stores
Many teams use shared databases across microservices. This practice creates coupling by schema. You may find it hard to change your database without breaking other services. The cost of change goes up, and you lose the ability to scale services independently.
The main problem with shared databases is that they create coupling by schema. The cost of change tends to go up as it becomes difficult to know when you can make changes safely without breaking something in another service. This tends to have knock on effects for the scalability of the system. You cannot scale services individually as they rely on a data store that is used by other implementations. Given that the scalability of a service is generally defined by its slowest component, a shared data store often becomes a significant bottleneck at scale.
You should avoid shared data stores when possible. Give each service its own database to reduce coupling and improve performance.
Scalability Issues
Database contention can become a ticking time bomb for your system. When multiple services compete for the same data store, you create a bottleneck. The slowest service limits the performance of the entire system. You may see increased latency, timeouts, and even outages during peak load.
You must design your databases for independent scaling. This approach allows you to handle growth without running into common performance problems. You should monitor database usage and watch for signs of contention. Early detection helps you fix issues before they impact users.
You need to recognize that microservices can introduce new performance problems if you do not plan carefully. Latency, failure points, and database contention can all slow down your system. You must address these risks to avoid turning your architecture into a ticking time bomb.
Identifying Bottlenecks in Microservices Architecture
Monitoring Tools
Metrics
You need to track the right metrics to spot performance issues early. Metrics give you a snapshot of your system’s health. They help you see trends and catch problems before they grow. Focus on metrics that matter to your business, not just technical indicators. For example, monitor response times, error rates, and request throughput. These numbers show how your services perform under real-world conditions.
Visibility
Visibility is key to understanding your system. Without it, you cannot find the root cause of slowdowns. Use monitoring tools that collect data from every service. Some popular options include:
- Prometheus, Datadog, and Grafana for performance monitoring.
- Elasticsearch, Logstash, Kibana, or Graylog for centralized logging and tracing.
- Application Performance Monitoring tools like New Relic or Dynatrace for deep insights.
- Docker Swarm or Kubernetes for container orchestration and observability.
- API gateways such as Zuul, Kong, or Netflix for collecting performance data.
These tools help you see how each part of your system behaves. Real-time analytics and alerting let you react quickly to issues.
Distributed Tracing
Request Flows
Distributed tracing lets you follow a request as it moves through your microservices. Each service adds its own processing time and network delay. Tracing tools like OpenTelemetry, Jaeger, and Zipkin connect the dots. They show you the full path of a request, making it easier to spot where delays happen.
- Distributed tracing provides visibility across services.
- It exposes bottlenecks and accelerates debugging.
- Teams can use traces to identify latency sources and improve system reliability.
Latency Sources
Latency can build up as requests pass through many services. Even small delays add up and affect users. Tracing reveals which service or operation causes the most delay. Logs and metrics alone cannot show this level of detail. Tracing keeps the request context as it moves, so you can pinpoint the exact source of latency.
Recognizing Hidden Slowdowns
Symptoms
Hidden slowdowns can hurt your system even if you do not see outages. You might notice slower response times, increased error rates, or higher resource usage. These issues often come from internal processes that are not visible to users. You need performance diagnostics to catch these problems early. Use correlation IDs to trace requests through multiple services. Set up proactive alerts based on your service level objectives. This approach helps you catch issues before they impact users.
Real-World Cases
Real-world examples show how important it is to find and fix bottlenecks. In one case, a Java Spring Boot application faced a major performance drop. Monitoring and observability tools helped the team find the issue. They changed a method to include a 'By' clause, which reduced queries per second from 300 to 30. This fix improved CPU usage and garbage collection. The team restored performance and improved scalability.
Tip: Always use metrics, logs, and traces together. This combination gives you a complete view of your system and helps you find hidden problems fast.
Solutions for Microservices Performance Problems
Asynchronous Communication
Messaging Benefits
You can solve many scaling problems in microservices architecture by using asynchronous communication. When you send asynchronous requests, you let services process messages at their own pace. This approach helps you avoid bottlenecks and improves reliability. Asynchronous systems use queues to handle spikes in traffic. You do not lose requests during outages or downtime. You can retry failed messages and use dead letter queues to keep your data safe.
| Performance Improvement | Description |
|---|---|
| Scalability | Asynchronous communication allows for virtually infinite scaling by using queues, which can handle spikes in traffic without losing requests. |
| Reliability | Asynchronous systems can retry failed messages and utilize dead letter queues, ensuring that messages are not lost during service downtime or network issues. |
| Testability | Testing becomes simpler as only the consuming service and a queue need to be set up, allowing for easier bug localization and varied scenario testing. |
You gain flexibility and deployment flexibility because you can add new features without affecting other services. Asynchronous requests help you build independently deployable services. You avoid microservices disasters like 14-hour outages caused by synchronous dependencies.
Implementation
You can implement asynchronous communication with message brokers such as RabbitMQ, Azure Service Bus, or Kafka. You send messages to a queue, and the receiving service processes them when ready. You can use publish-subscribe patterns to broadcast events to multiple services. You should monitor your queues and set up alerts for slow processing or message buildup. Asynchronous requests reduce the hidden tax of distribution by decoupling services and improving performance.
Bulkheads & Circuit Breakers
Isolation Strategies
You can protect your microservices architecture from failures by using bulkheads and circuit breakers. Bulkheads create separate pools for each service. This strategy prevents a failure in one service from affecting the entire system.
Bulkheads are designed to isolate failure domains by creating separate pools or quotas for different services, which prevents a failure in one service from affecting the entire system.
You can lock down failures to their origin and avoid widespread outages. You gain flexibility because you can scale and recover individual services without impacting others.
Failure Mitigation
Circuit breakers detect failures and stop requests from reaching unhealthy services. You can set thresholds for errors and timeouts. When a service fails, the circuit breaker opens and reroutes traffic. You avoid microservices disasters and reduce the impact of 14-hour outages.
The bulkhead pattern in microservice architecture is used to prevent faults in one part of a system from taking down the entire system, effectively locking down the failure to its origin.
You improve performance by isolating failures and keeping your system resilient.
Caching & Scaling
Data Store Selection
Caching helps you solve scaling problems and improve performance. You can cache database calls and API responses to reduce load on your backend. You should select the right data store for caching based on your needs. Redis and Memcached are popular choices. You can cache fragments based on their volatility and update frequency.
| Benefit | Description |
|---|---|
| Fine-grained control | Cache fragments based on their volatility and update frequency. |
| Reduced cache invalidation | Minimizes purging overhead by refreshing only affected data pieces. |
| Improved cache hit ratios | Enables smaller, more efficient cache entries leading to higher in-memory hit rates. |
| Dynamic/static hybrid handling | Supports caching static user profiles while dynamically fetching real-time stats. |
Independent Scaling
You can scale services independently by using caching and separating data stores. This approach gives you flexibility and deployment flexibility. You avoid scaling problems caused by shared resources. You can cache static user profiles and fetch real-time stats dynamically. You gain improved cache hit ratios and reduce cache invalidation overhead.
- Enhanced scalability
- Increased agility and faster time to market
- Fault isolation and system resilience
- Cost effectiveness
- DevOps integration and continuous delivery
- Technology flexibility and innovation
Caching helps you build features faster and avoid outages. You reduce the hidden tax of distribution and keep your microservices architecture efficient.
Reducing Dependencies
Decoupling
You can boost the reliability of your microservices by reducing dependencies between services. When you decouple services, you allow each one to operate and scale on its own. This approach gives you more control over resource allocation. You do not need to scale the entire system when only one service needs more capacity.
Decoupling means that each microservice can handle its own workload without waiting for others. This independence helps you avoid bottlenecks and keeps your system running smoothly.
Here are some key benefits you gain when you reduce dependencies:
- Each microservice can scale independently, which allows for better resource allocation.
- You minimize the risk of cascading failures, which enhances overall system reliability.
- Teams can deploy and update services without waiting for other teams.
- You can isolate problems quickly, making troubleshooting easier.
You should design your APIs and data contracts to limit direct connections between services. Use asynchronous messaging or event-driven patterns to keep services loosely coupled. This strategy helps you avoid tight links that can slow down your development and increase the risk of outages.
Simplification
Simplifying your microservices architecture makes your system easier to manage and understand. When you reduce the number of dependencies, you lower the cognitive load on your team. Developers can focus on their own services without worrying about the impact on others.
Note: Simple systems are easier to test, monitor, and secure. You can spot issues faster and respond to incidents with less stress.
You should also pay attention to how you measure reliability. Individual service level objectives (SLOs) may not show the full picture. Composite SLOs combine the goals of multiple services, giving you a clearer view of your system’s health.
| Approach | What It Means | Why It Matters |
|---|---|---|
| Individual SLOs | Track reliability for each service separately | May miss system-wide issues |
| Composite SLOs | Combine SLOs across services | Show overall reliability and health |
To simplify your architecture, you can:
- Limit the number of direct service-to-service calls.
- Use shared libraries only when necessary.
- Document service boundaries clearly.
- Regularly review and refactor dependencies.
By focusing on decoupling and simplification, you make your microservices architecture more robust and easier to scale. You also help your team deliver features faster and with fewer surprises.
Evaluating Microservice Architecture Fit
Choosing the right architecture for your team can shape your delivery speed and operational efficiency. The Microsoft Development Podcast highlights a growing trend: many organizations now consolidate microservices back into larger units. You need to weigh the trade-offs before making a decision.
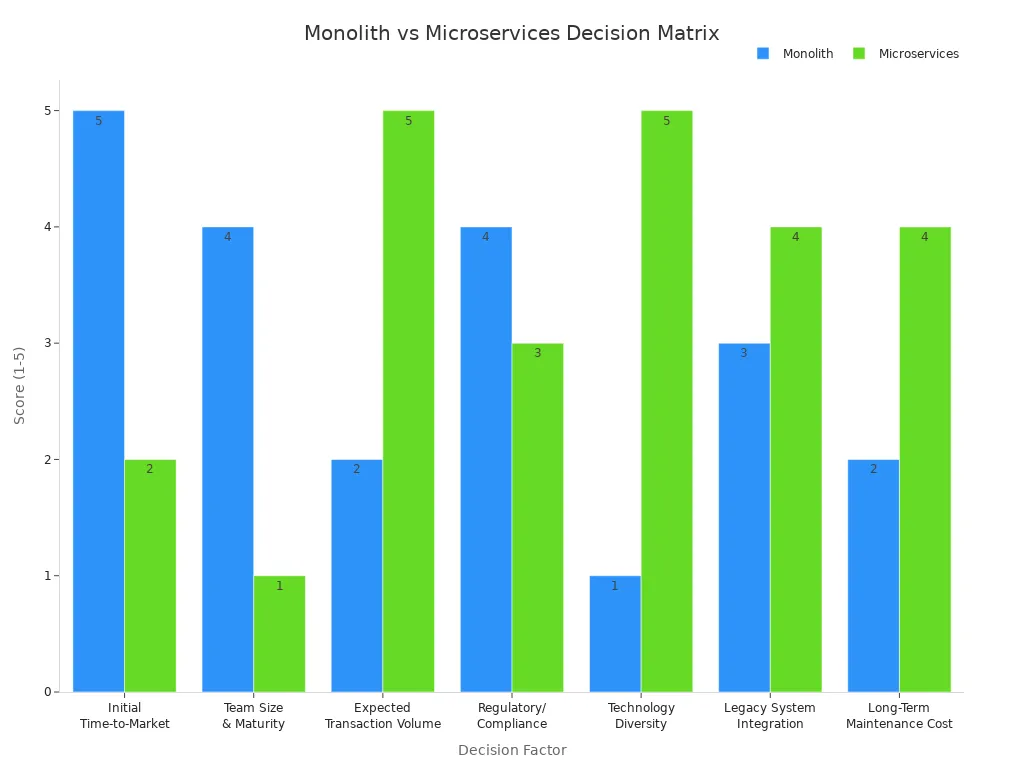
Decision Matrix
A decision matrix helps you compare monolithic and microservice architectures across key factors. You can use this table to score each option based on your needs:
| Decision Factor | Monolith Score (1-5) | Microservices Score (1-5) | Strategic Rationale |
|---|---|---|---|
| Initial Time-to-Market (Speed) | 5 | 2 | Monolith requires less infrastructure setup. |
| Team Size & Maturity (DevOps) | 4 | 1 | Microservices demand advanced CI/CD and observability. |
| Expected Transaction Volume (Scale) | 2 | 5 | Microservices allow granular, independent scaling of bottlenecks. |
| Regulatory/Compliance Complexity | 4 | 3 | Single artifact simplifies initial compliance checks. |
| Technology Diversity/Experimentation | 1 | 5 | Microservices allow teams to choose the best language/database per service. |
| Legacy System Integration | 3 | 4 | Microservices excel at isolating and modernizing legacy components. |
| Long-Term Maintenance Cost (TCO) | 2 | 4 | Microservices reduce the cost of feature delivery over time, but increase ops cost. |
Key Questions
Ask yourself these questions to assess your architecture fit:
- Does your team have strong DevOps and SRE skills?
- Are you expecting high transaction volumes or rapid scaling?
- Do you need to experiment with different technologies?
- Is compliance a major concern for your business?
- Are you integrating legacy systems?
You should align your repository strategy with your team’s structure. Small teams often benefit from simpler setups.
Signs to Reconsider
Watch for these signs that your microservice architecture may not fit:
- Delivery speed slows down due to coordination overhead.
- Operational costs rise faster than expected.
- Outages last longer and impact multiple services.
- Teams struggle to ship features or maintain services.
Tip: If you notice these symptoms, consider consolidating services or revisiting your architecture.
Monolith vs Microservices
You need to understand how team size and delivery speed affect your choice.
Team Size
| Architecture Type | Team Size Recommendation | Key Characteristics |
|---|---|---|
| Monolithic | < 8-10 developers | Simple deployment, limited operational expertise |
| Microservices | > 10-15 developers | Independent team deployments, complex coordination |
Smaller teams often succeed with monolithic architectures. Larger teams with strong DevOps skills can manage microservices more effectively.
Delivery Speed
Microservices can boost scaling but may slow delivery if your team faces coordination challenges. For example, a startup built dozens of microservices to scale but struggled with high cloud bills and long outages. They found it hard to ship features quickly.
| Aspect | Monolithic Architecture | Microservice Architecture |
|---|---|---|
| Performance | Shared-memory access is faster than IPC. | IPC can introduce latency. |
| Coupling | Tightly coupled, making it hard to isolate services. | Loosely coupled, allowing for independent scaling. |
| Deployment | Requires deploying all services together. | Allows for independent deployments of services. |
| Scalability | Scale all services together. | Scale individual services as needed. |
| Maintainability | Harder to maintain due to dependencies. | Easier to maintain due to autonomy of services. |
| Complexity | Simpler architecture overall. | Increased complexity with multiple services. |
| Cost | Generally lower operational costs. | Higher costs due to multiple services and network calls. |
| Cultural Shift | Minimal cultural change required. | Requires significant cultural and organizational changes. |
You should review your architecture regularly. Use the decision matrix and team size guidelines to find the best fit for your goals.
You face hidden complexity and performance risks with microservice architecture. Bottlenecks often appear in unexpected places. The Microsoft Development Podcast highlights how rapid delivery and evolving data models require careful analysis. To keep your system healthy, follow these steps:
- Manage third-party requests.
- Use load balancing and autoscaling.
- Choose the right data store.
- Cache database calls.
You should also enable architecture governance, use API gateways, and encourage regular reviews. Ongoing evaluation helps you adapt and maintain speed.
FAQ
What is a distributed monolith?
A distributed monolith looks like microservices but acts like a monolith. You see tight coupling, shared databases, and slow deployments. You lose the benefits of true service independence.
How do you spot performance bottlenecks in microservices?
You should monitor response times, error rates, and request flows. Use distributed tracing tools to follow requests across services. Look for slow endpoints or services with high resource usage.
Why does network latency matter in microservice architecture?
Network latency adds delay to every service call. In-process calls are much faster. When you use microservices, each network hop increases total response time. This can slow down your application.
How can you reduce coordination overhead between teams?
You can set clear roles and responsibilities. Use automation for API governance. Limit the number of meetings. Encourage asynchronous communication to keep teams focused and productive.
What tools help with observability in .NET microservices?
You can use tools like Prometheus, Grafana, and OpenTelemetry. These tools collect metrics, logs, and traces. They help you find issues quickly and keep your system healthy.
When should you consider consolidating microservices?
You should consider consolidation if delivery slows down, operational costs rise, or outages affect many services. Smaller teams often benefit from simpler architectures.
What is the best way to handle shared data in microservices?
Give each service its own database when possible. This reduces coupling and makes scaling easier. Avoid shared databases to prevent bottlenecks and coordination problems.
How does asynchronous communication improve microservice performance?
Asynchronous communication lets services process requests at their own pace. You avoid blocking calls and reduce bottlenecks. This approach increases reliability and helps your system scale.
🚀 Want to be part of m365.fm?
Then stop just listening… and start showing up.
👉 Connect with me on LinkedIn and let’s make something happen:
- 🎙️ Be a podcast guest and share your story
- 🎧 Host your own episode (yes, seriously)
- 💡 Pitch topics the community actually wants to hear
- 🌍 Build your personal brand in the Microsoft 365 space
This isn’t just a podcast — it’s a platform for people who take action.
🔥 Most people wait. The best ones don’t.
👉 Connect with me on LinkedIn and send me a message:
"I want in"
Let’s build something awesome 👊
1
00:00:00,000 --> 00:00:02,160
You picked microservices because you wanted speed,
2
00:00:02,160 --> 00:00:05,480
faster teams, faster deployers, faster change.
3
00:00:05,480 --> 00:00:09,600
But somewhere along the way, a simple feature stopped being simple.
4
00:00:09,600 --> 00:00:11,520
Now that same feature means a new ticket,
5
00:00:11,520 --> 00:00:14,280
two team handoffs and API review and contract checks.
6
00:00:14,280 --> 00:00:16,920
You have to manage retries, tracing, and rollout planning
7
00:00:16,920 --> 00:00:19,160
while someone asks who actually owns the change.
8
00:00:19,160 --> 00:00:20,760
The all bureaucracy didn't disappear.
9
00:00:20,760 --> 00:00:22,560
It just moved, it moved out of the org chart
10
00:00:22,560 --> 00:00:23,880
and directly into the runtime.
11
00:00:23,880 --> 00:00:25,240
And that's not just a feeling.
12
00:00:25,240 --> 00:00:27,680
Current research shows 42% of organizations
13
00:00:27,680 --> 00:00:30,800
are consolidating services back into larger deployment units.
14
00:00:30,800 --> 00:00:32,120
That should tell you something.
15
00:00:32,120 --> 00:00:34,640
In this video, I'll show you the model behind that slowdown.
16
00:00:34,640 --> 00:00:37,560
We will look at why net teams feel it early
17
00:00:37,560 --> 00:00:38,560
and what to do instead.
18
00:00:38,560 --> 00:00:40,200
Because if you keep the current model,
19
00:00:40,200 --> 00:00:42,320
you keep paying in latency, coordination,
20
00:00:42,320 --> 00:00:45,280
and delivery trust, although not the architectural illusion
21
00:00:45,280 --> 00:00:46,120
of progress.
22
00:00:46,120 --> 00:00:48,240
Microservices were sold as autonomy.
23
00:00:48,240 --> 00:00:50,080
The idea was to split the system up,
24
00:00:50,080 --> 00:00:52,880
give teams ownership, and deploy independently.
25
00:00:52,880 --> 00:00:55,120
You would scale only the parts that needed scaling.
26
00:00:55,120 --> 00:00:56,360
On paper, that sounds clean.
27
00:00:56,360 --> 00:00:57,040
It sounds modern.
28
00:00:57,040 --> 00:00:58,160
It sounds like maturity.
29
00:00:58,160 --> 00:00:59,960
But the model came with assumptions.
30
00:00:59,960 --> 00:01:01,880
Most teams skipped right past.
31
00:01:01,880 --> 00:01:04,200
It assumed your domain boundaries were already clear,
32
00:01:04,200 --> 00:01:05,520
and your teams were stable.
33
00:01:05,520 --> 00:01:07,280
It assumed your platform was mature enough
34
00:01:07,280 --> 00:01:08,880
to absorb the extra operating load
35
00:01:08,880 --> 00:01:10,360
without slowing down feature work.
36
00:01:10,360 --> 00:01:12,680
In a lot of companies, none of that was true,
37
00:01:12,680 --> 00:01:14,480
yet the architecture still shipped anyway.
38
00:01:14,480 --> 00:01:15,600
That's where it breaks.
39
00:01:15,600 --> 00:01:18,320
Because the architecture starts asking more from the organization
40
00:01:18,320 --> 00:01:20,400
than the organization can actually provide.
41
00:01:20,400 --> 00:01:22,640
Research around modular monoliths and microservices
42
00:01:22,640 --> 00:01:24,200
keeps landing on the same pattern.
43
00:01:24,200 --> 00:01:25,960
Microservices pay off later, not early.
44
00:01:25,960 --> 00:01:28,480
For teams under roughly 20 to 30 engineers,
45
00:01:28,480 --> 00:01:31,240
the coordination cost often beats the scaling benefit.
46
00:01:31,240 --> 00:01:32,400
You don't get independence.
47
00:01:32,400 --> 00:01:33,880
You get dependency with more steps.
48
00:01:33,880 --> 00:01:37,320
And one level deeper, the performance story gets distorted too.
49
00:01:37,320 --> 00:01:39,960
Inside one process, code talks at memory speed.
50
00:01:39,960 --> 00:01:42,080
Across services, that same conversation
51
00:01:42,080 --> 00:01:45,400
turns into network traffic, serialization, and auth checks.
52
00:01:45,400 --> 00:01:47,880
You deal with timeouts, retries, and logging.
53
00:01:47,880 --> 00:01:50,200
That move takes you from nanosecond level calls
54
00:01:50,200 --> 00:01:51,440
to millisecond level calls.
55
00:01:51,440 --> 00:01:54,280
People hear that and think milliseconds are still fast,
56
00:01:54,280 --> 00:01:55,760
but that misses the point.
57
00:01:55,760 --> 00:01:57,200
The problem isn't one call.
58
00:01:57,200 --> 00:01:59,200
The problem is what happens when business logic
59
00:01:59,200 --> 00:02:01,240
gets scattered across a chain of calls.
60
00:02:01,240 --> 00:02:03,040
Every small change now crosses boundaries
61
00:02:03,040 --> 00:02:04,000
that didn't need to exist.
62
00:02:04,000 --> 00:02:06,400
So what used to be one code change becomes many forms
63
00:02:06,400 --> 00:02:07,280
of coordination.
64
00:02:07,280 --> 00:02:08,840
A business rule changes in pricing.
65
00:02:08,840 --> 00:02:11,720
That now touches an API contract, a consumer expectation,
66
00:02:11,720 --> 00:02:12,920
and another repo.
67
00:02:12,920 --> 00:02:15,400
You have another pipeline, maybe a message schema,
68
00:02:15,400 --> 00:02:18,160
and maybe an approval from a team that's busy with something else.
69
00:02:18,160 --> 00:02:19,560
The code might take 30 minutes.
70
00:02:19,560 --> 00:02:21,480
The system around the code takes days.
71
00:02:21,480 --> 00:02:23,680
Still, it looks like progress from a distance.
72
00:02:23,680 --> 00:02:25,000
More boxes on the diagram.
73
00:02:25,000 --> 00:02:27,880
More service names, more ownership labels, more governance.
74
00:02:27,880 --> 00:02:29,600
It feels structured and structure often
75
00:02:29,600 --> 00:02:31,040
gets mistaken for capability.
76
00:02:31,040 --> 00:02:33,040
This is especially true in enterprise IT,
77
00:02:33,040 --> 00:02:35,960
where visible complexity can look like serious engineering.
78
00:02:35,960 --> 00:02:38,560
But adding boundaries doesn't automatically create clarity.
79
00:02:38,560 --> 00:02:41,440
A lot of the time, it just creates more places where work can stop.
80
00:02:41,440 --> 00:02:43,200
That's why so many teams end up rebuilding
81
00:02:43,200 --> 00:02:45,560
the same silo behavior they were trying to escape.
82
00:02:45,560 --> 00:02:47,240
Only now the silos are technical.
83
00:02:47,240 --> 00:02:50,760
One team controls one service, while another team controls a dependent one.
84
00:02:50,760 --> 00:02:52,560
Every boundary becomes a negotiation point.
85
00:02:52,560 --> 00:02:55,120
Every negotiation point slows the flow of change.
86
00:02:55,120 --> 00:02:57,720
And once the model fragments the flow of change like that,
87
00:02:57,720 --> 00:02:59,960
the tax starts showing up everywhere.
88
00:02:59,960 --> 00:03:02,280
The hidden tax of distributed complexity.
89
00:03:02,280 --> 00:03:03,800
Once the change path gets split,
90
00:03:03,800 --> 00:03:05,840
the next problem shows up in the system itself.
91
00:03:05,840 --> 00:03:08,640
A lot of teams think speed drops because the code got messy.
92
00:03:08,640 --> 00:03:10,280
And while that is sometimes true,
93
00:03:10,280 --> 00:03:13,520
the slow down in distributed systems often starts much earlier.
94
00:03:13,520 --> 00:03:15,440
It happens because the architecture forces work
95
00:03:15,440 --> 00:03:16,800
to travel across the network
96
00:03:16,800 --> 00:03:19,600
when it never actually needed to leave the process in the first place.
97
00:03:19,600 --> 00:03:21,800
That decision brings extra mechanics with it.
98
00:03:21,800 --> 00:03:23,960
And every single mechanic has a cost.
99
00:03:23,960 --> 00:03:26,120
One request becomes many moving parts.
100
00:03:26,120 --> 00:03:29,440
You serialize data, you send it over HTTP or GRPC,
101
00:03:29,440 --> 00:03:30,720
and then you authenticate it.
102
00:03:30,720 --> 00:03:32,880
You wait on another service, you handle timeouts,
103
00:03:32,880 --> 00:03:34,200
and you add retries.
104
00:03:34,200 --> 00:03:36,440
You lock correlation IDs, you emit spans,
105
00:03:36,440 --> 00:03:38,040
and you deal with partial failure.
106
00:03:38,040 --> 00:03:40,520
And if one downstream service slows down the service above,
107
00:03:40,520 --> 00:03:42,240
it starts carrying that pain too.
108
00:03:42,240 --> 00:03:43,520
None of this is fake work,
109
00:03:43,520 --> 00:03:45,880
and some of it is necessary in the right context.
110
00:03:45,880 --> 00:03:48,200
But a lot of teams are paying this price on flows
111
00:03:48,200 --> 00:03:50,720
that are still basically one business transaction.
112
00:03:50,720 --> 00:03:53,160
That's why distributed complexity is so deceptive.
113
00:03:53,160 --> 00:03:55,520
From the outside, each service can look small and need,
114
00:03:55,520 --> 00:03:57,400
but inside production, the full request path
115
00:03:57,400 --> 00:03:59,440
is heavier than the diagram suggests.
116
00:03:59,440 --> 00:04:02,000
The real system includes everything between those services,
117
00:04:02,000 --> 00:04:03,840
not just the services themselves.
118
00:04:03,840 --> 00:04:07,360
The payload formats matter, the network matters, and TLS matters.
119
00:04:07,360 --> 00:04:09,520
Under load, details like retry, behavior,
120
00:04:09,520 --> 00:04:11,640
and back-off settings stop being details.
121
00:04:11,640 --> 00:04:14,680
Observability shows this clearly, but it comes with its own bill.
122
00:04:14,680 --> 00:04:16,840
Distributed tracing gives you the map you need
123
00:04:16,840 --> 00:04:20,080
when one request touches five, eight, or maybe 12 services,
124
00:04:20,080 --> 00:04:21,400
but tracing isn't free.
125
00:04:21,400 --> 00:04:24,920
Research shows throughput can drop by 19% to 80%,
126
00:04:24,920 --> 00:04:28,400
and media latency can rise by 7% to 42%,
127
00:04:28,400 --> 00:04:31,120
depending on how instrumentation gets implemented.
128
00:04:31,120 --> 00:04:32,960
So the team ends up in a strange loop
129
00:04:32,960 --> 00:04:34,560
where they distribute the system,
130
00:04:34,560 --> 00:04:37,440
then add more infrastructure to explain the distribution,
131
00:04:37,440 --> 00:04:39,960
and that extra infrastructure adds more load again.
132
00:04:39,960 --> 00:04:43,520
Small teams feel this first because they don't have spare capacity.
133
00:04:43,520 --> 00:04:44,840
They're already building features,
134
00:04:44,840 --> 00:04:46,680
fixing incidents, maintaining pipelines,
135
00:04:46,680 --> 00:04:48,520
and answering questions from the business.
136
00:04:48,520 --> 00:04:51,960
Then the architecture asks them to become experts in telemetry,
137
00:04:51,960 --> 00:04:54,560
container networking, retry, policy design,
138
00:04:54,560 --> 00:04:56,800
and failure analysis across service boundaries.
139
00:04:56,800 --> 00:04:59,040
Now the team is not just writing a netcode.
140
00:04:59,040 --> 00:05:00,800
It's running a distributed platform.
141
00:05:00,800 --> 00:05:02,920
And in dot-net shops, service mesh decisions
142
00:05:02,920 --> 00:05:04,640
can push that cost even higher.
143
00:05:04,640 --> 00:05:07,200
The upside of a mesh is real because you get traffic control,
144
00:05:07,200 --> 00:05:08,720
M-TLS, and policy enforcement
145
00:05:08,720 --> 00:05:10,920
without baking all of it into every app.
146
00:05:10,920 --> 00:05:12,360
But the overhead is real too.
147
00:05:12,360 --> 00:05:15,440
Research on 2026 mesh trade-offs shows Istio side cars
148
00:05:15,440 --> 00:05:18,560
commonly add around 50 to 100 megabytes of memory per pod
149
00:05:18,560 --> 00:05:22,360
plus 2 to 5 milliseconds of P99 latency overhead under load.
150
00:05:22,360 --> 00:05:24,920
Linkard is lighter, often around 10 to 20 megabytes
151
00:05:24,920 --> 00:05:26,200
and under 1 millisecond.
152
00:05:26,200 --> 00:05:27,840
But even that still consumes capacity
153
00:05:27,840 --> 00:05:29,160
your app no longer owns.
154
00:05:29,160 --> 00:05:31,440
That matters when a net API pod
155
00:05:31,440 --> 00:05:33,360
already carries a heavier memory profile
156
00:05:33,360 --> 00:05:35,160
than many teams expect.
157
00:05:35,160 --> 00:05:36,760
Now add a side car proxy to every pod,
158
00:05:36,760 --> 00:05:38,280
multiply that across a cluster,
159
00:05:38,280 --> 00:05:40,640
and suddenly platform logic starts eating the app budget.
160
00:05:40,640 --> 00:05:42,160
The team thinks it bought safety,
161
00:05:42,160 --> 00:05:44,160
but what it also bought was more memory pressure,
162
00:05:44,160 --> 00:05:46,320
more node cost, and more tuning work.
163
00:05:46,320 --> 00:05:48,040
Then Kubernetes enters the picture
164
00:05:48,040 --> 00:05:49,760
and the learning curve climbs again,
165
00:05:49,760 --> 00:05:52,200
scheduling auto scaling probes, limits, requests,
166
00:05:52,200 --> 00:05:54,400
networking certificates, and policy ML.
167
00:05:54,400 --> 00:05:55,800
You can't call that free speed.
168
00:05:55,800 --> 00:05:58,360
Debugging is where the tax becomes impossible to ignore.
169
00:05:58,360 --> 00:06:00,560
In a single process, you follow one stack trace,
170
00:06:00,560 --> 00:06:02,000
but in a distributed chain,
171
00:06:02,000 --> 00:06:05,520
the truth is fragmented across logs, traces, message brokers,
172
00:06:05,520 --> 00:06:07,840
and timing gaps between services.
173
00:06:07,840 --> 00:06:10,240
Research comparing modular monoliths and microservices
174
00:06:10,240 --> 00:06:14,440
points to around 35% more debugging time in microservice environments.
175
00:06:14,440 --> 00:06:17,000
That sounds abstract until a production issue burns half a day
176
00:06:17,000 --> 00:06:19,040
and nobody can answer one basic question.
177
00:06:19,040 --> 00:06:20,760
Where did the request actually fail?
178
00:06:20,760 --> 00:06:23,080
So this stops being just an engineering taste debate.
179
00:06:23,080 --> 00:06:24,280
It becomes a staffing issue
180
00:06:24,280 --> 00:06:26,840
because distributed systems need more operational care.
181
00:06:26,840 --> 00:06:29,000
It becomes a cost issue because observability,
182
00:06:29,000 --> 00:06:31,800
proxies, and orchestration all land on the cloud bill.
183
00:06:31,800 --> 00:06:33,160
And it becomes a focus issue
184
00:06:33,160 --> 00:06:36,080
because the team spends more time explaining the platform
185
00:06:36,080 --> 00:06:37,440
than improving the product.
186
00:06:37,440 --> 00:06:39,120
And even if you could absorb all of that,
187
00:06:39,120 --> 00:06:42,800
the next layer of drag usually comes from the contract model itself.
188
00:06:42,800 --> 00:06:45,840
How rigid API contracts become digital red tape?
189
00:06:45,840 --> 00:06:49,160
Then the slowdown moves from runtime behavior into team behavior.
190
00:06:49,160 --> 00:06:51,080
API contracts are supposed to create trust
191
00:06:51,080 --> 00:06:52,240
and that part is real.
192
00:06:52,240 --> 00:06:54,360
A service should know what it can expect
193
00:06:54,360 --> 00:06:57,360
and a consuming team should not wake up to random breaking changes.
194
00:06:57,360 --> 00:07:00,640
The problem starts when the contract stops acting like a shared agreement
195
00:07:00,640 --> 00:07:02,480
and starts acting like a border crossing
196
00:07:02,480 --> 00:07:05,000
because every small change now needs permission,
197
00:07:05,000 --> 00:07:07,840
sequencing, review, and rollout choreography
198
00:07:07,840 --> 00:07:09,280
before anyone can ship.
199
00:07:09,280 --> 00:07:11,720
Take something boring like renaming one field
200
00:07:11,720 --> 00:07:14,840
in a tightly coupled business flow that should be a local refactor.
201
00:07:14,840 --> 00:07:18,040
In a rigid service landscape, it can trigger a whole chain of work,
202
00:07:18,040 --> 00:07:20,400
update the schema, notify consumers,
203
00:07:20,400 --> 00:07:23,560
debate whether the change is breaking, add a new version,
204
00:07:23,560 --> 00:07:25,080
keep the old version alive,
205
00:07:25,080 --> 00:07:26,320
coordinate release windows,
206
00:07:26,320 --> 00:07:29,720
and then wait for every dependent team to catch up.
207
00:07:29,720 --> 00:07:31,320
The technical change is tiny.
208
00:07:31,320 --> 00:07:33,320
The organizational motion around it is not.
209
00:07:33,320 --> 00:07:35,000
That's where contracts turn into red tape,
210
00:07:35,000 --> 00:07:36,520
not because contracts are bad,
211
00:07:36,520 --> 00:07:40,160
but because teams often lock them too early in domains that are still moving.
212
00:07:40,160 --> 00:07:43,800
Research on API contract rigidity points to low contract testing adoption
213
00:07:43,800 --> 00:07:45,520
around 17% of teams.
214
00:07:45,520 --> 00:07:49,560
So a lot of organizations don't have a fast, reliable way to verify consumer
215
00:07:49,560 --> 00:07:51,680
and provider expectations in the pipeline.
216
00:07:51,680 --> 00:07:54,760
They fall back to slower end-to-end testing, manual checks,
217
00:07:54,760 --> 00:07:56,680
or plain guesswork between teams.
218
00:07:56,680 --> 00:07:58,200
None of that scales well.
219
00:07:58,200 --> 00:08:01,000
And when confidence is low, governance gets tighter,
220
00:08:01,000 --> 00:08:04,640
more approval steps, more review boards, and more checklist thinking.
221
00:08:04,640 --> 00:08:07,600
More, don't merge this until architecture signs off.
222
00:08:07,600 --> 00:08:10,400
That response makes sense if you're trying to prevent outages,
223
00:08:10,400 --> 00:08:14,000
but in practice, it often pushes governance outside the developer flow
224
00:08:14,000 --> 00:08:16,480
where it turns into queue time instead of feedback.
225
00:08:16,480 --> 00:08:19,320
Research after 2025 is pretty clear on this point.
226
00:08:19,320 --> 00:08:22,600
Governance slows teams mostly when it stays manual, rigid,
227
00:08:22,600 --> 00:08:25,200
and disconnected from the tools people already use.
228
00:08:25,200 --> 00:08:26,440
So what do developers do?
229
00:08:26,440 --> 00:08:28,400
They work around it, they duplicate endpoints,
230
00:08:28,400 --> 00:08:30,280
they avoid changing old APIs,
231
00:08:30,280 --> 00:08:32,400
and they add translation layers nobody wanted.
232
00:08:32,400 --> 00:08:34,840
They ship another version and promise to clean it up later.
233
00:08:34,840 --> 00:08:37,120
Now the system has more surface area, more drift,
234
00:08:37,120 --> 00:08:38,480
and more hidden maintenance.
235
00:08:38,480 --> 00:08:40,080
The policy was meant to create order,
236
00:08:40,080 --> 00:08:41,640
but because the model is too stiff,
237
00:08:41,640 --> 00:08:43,600
it creates more exceptions instead.
238
00:08:43,600 --> 00:08:45,520
There are a few warning signs you can watch for.
239
00:08:45,520 --> 00:08:48,640
High contract churn usually means the domain isn't stable yet.
240
00:08:48,640 --> 00:08:52,200
Low verification success means teams don't actually share the same understanding
241
00:08:52,200 --> 00:08:53,200
of the interface.
242
00:08:53,200 --> 00:08:57,520
Flaky checks often mean the contract is too strict in places where variation is normal,
243
00:08:57,520 --> 00:09:00,800
like generated IDs, timestamps, or optional fields.
244
00:09:00,800 --> 00:09:03,960
If the contract fails all the time, people stop trusting the process.
245
00:09:03,960 --> 00:09:06,360
Then the contract becomes ceremony, not safety.
246
00:09:06,360 --> 00:09:08,840
This gets even stranger with AI coding tools.
247
00:09:08,840 --> 00:09:13,160
AI can help generate handlers, clients, tests, and schemas faster,
248
00:09:13,160 --> 00:09:14,800
but that does not remove the bottleneck.
249
00:09:14,800 --> 00:09:16,840
It just pushes more code into a pipeline
250
00:09:16,840 --> 00:09:19,720
that still depends on human approval, brittle checks,
251
00:09:19,720 --> 00:09:21,440
and cross-team synchronization.
252
00:09:21,440 --> 00:09:24,800
Research on the AI velocity paradox makes this point clearly.
253
00:09:24,800 --> 00:09:29,080
Local coding speed rises, while downstream validation becomes the new wall.
254
00:09:29,080 --> 00:09:33,360
So developers feel productive on their machine and blocked everywhere else that gap matters.
255
00:09:33,360 --> 00:09:35,680
Because from the inside the team thinks it's moving,
256
00:09:35,680 --> 00:09:38,600
pull requests are open, code exists, and stubs compile.
257
00:09:38,600 --> 00:09:41,000
But the system only changes when the contract path clears
258
00:09:41,000 --> 00:09:43,880
and in many companies that path is slower than the coding itself.
259
00:09:43,880 --> 00:09:48,520
That's digital bureaucracy in its cleanest form, not no work, but work that waits.
260
00:09:48,520 --> 00:09:50,400
The fix is not to throw governance away.
261
00:09:50,400 --> 00:09:54,360
The fix is to change the model, put policy in CI, run checks on pull requests,
262
00:09:54,360 --> 00:09:56,720
and fail fast where the developer can still act.
263
00:09:56,720 --> 00:10:00,600
Treat contracts as living products with owners, version rules, and feedback loops.
264
00:10:00,600 --> 00:10:03,880
Use tolerance where the domain needs room to evolve instead of pretending
265
00:10:03,880 --> 00:10:06,400
every response, shape, or stay frozen forever.
266
00:10:06,400 --> 00:10:08,120
Strong governance can help velocity,
267
00:10:08,120 --> 00:10:11,160
but only when it behaves like infrastructure and not committee process.
268
00:10:11,160 --> 00:10:12,920
Once contracts hard and too early,
269
00:10:12,920 --> 00:10:16,520
teams usually reach for one more tool to force certainty back into the flow,
270
00:10:16,520 --> 00:10:20,040
and that's where distributed transactions enter the picture.
271
00:10:20,040 --> 00:10:23,400
The category mistake, distributed transactions in modern-paint net.
272
00:10:23,400 --> 00:10:25,480
Once teams lock down their contracts too hard,
273
00:10:25,480 --> 00:10:27,840
they usually try to find certainty somewhere else.
274
00:10:27,840 --> 00:10:30,200
That is exactly where distributed transactions show up,
275
00:10:30,200 --> 00:10:33,080
and the thinking usually sounds pretty reasonable at first.
276
00:10:33,080 --> 00:10:36,920
We split the system into separate services with their own databases and release cycles,
277
00:10:36,920 --> 00:10:40,640
but we still want one clean, yes or no outcome across the whole flow.
278
00:10:40,640 --> 00:10:43,760
Payment succeeds, inventory commits, and the order status updates
279
00:10:43,760 --> 00:10:45,960
so that everything stays perfectly aligned.
280
00:10:45,960 --> 00:10:49,560
If any single part of that chain fails, we just roll the whole thing back.
281
00:10:49,560 --> 00:10:53,720
It sounds neat on paper, but it assumes a distributed system can behave like one machine.
282
00:10:53,720 --> 00:10:55,160
And that is the category mistake.
283
00:10:55,160 --> 00:10:57,720
You designed for network boundaries and independent failure,
284
00:10:57,720 --> 00:11:02,640
but then you asked the runtime for the kind of certainty that only works inside one process.
285
00:11:02,640 --> 00:11:04,720
Those two ideas pull in opposite directions.
286
00:11:04,720 --> 00:11:07,120
The more you spread a workflow across different services,
287
00:11:07,120 --> 00:11:08,800
the more fragile that promise becomes,
288
00:11:08,800 --> 00:11:12,880
because success now depends on connections and coordinators you do not fully control.
289
00:11:12,880 --> 00:11:16,600
In plain language, a two-phase commit tries to solve this by using a referee.
290
00:11:16,600 --> 00:11:19,760
The coordinator asks every participant if they are ready to commit,
291
00:11:19,760 --> 00:11:23,120
and if everyone says yes, it tells them all to finish the job.
292
00:11:23,120 --> 00:11:27,320
If even one participant says no, the coordinator tells the entire group to abort.
293
00:11:27,320 --> 00:11:29,800
This can work inside tightly controlled environments,
294
00:11:29,800 --> 00:11:33,200
but in cloud-native systems, it starts fighting the grain of the platform.
295
00:11:33,200 --> 00:11:35,600
Networks, wobble, and services restart,
296
00:11:35,600 --> 00:11:38,360
which means a timeout does not actually tell you if the work failed,
297
00:11:38,360 --> 00:11:40,480
it just means you stopped knowing what happened.
298
00:11:40,480 --> 00:11:42,960
That distinction matters more than most people realize.
299
00:11:42,960 --> 00:11:45,800
In modern.net, the situation gets even tighter,
300
00:11:45,800 --> 00:11:50,640
because distributed transaction support is no longer the smooth default it was in the old framework days.
301
00:11:50,640 --> 00:11:52,120
Starting with .NET 7,
302
00:11:52,120 --> 00:11:57,880
this support is Windows only and requires you to explicitly set implicit distributed transactions to true.
303
00:11:57,880 --> 00:12:02,120
If you forget that step, you will hit an exception telling you the feature is not enabled.
304
00:12:02,120 --> 00:12:05,680
Even the platform is telling you to slow down and think before you try to use it.
305
00:12:05,680 --> 00:12:09,440
Then there is the issue of promotion, which often catches teams of guard.
306
00:12:09,440 --> 00:12:12,320
You might start with what looks like a normal local transaction,
307
00:12:12,320 --> 00:12:16,400
but then an extra database connection appears through a query path you did not notice.
308
00:12:16,400 --> 00:12:21,360
Suddenly, that harmless looking query triggers a promotion into a far more complicated transaction.
309
00:12:21,360 --> 00:12:25,240
Research into .NET adoption failures shows this exact pattern over and over.
310
00:12:25,240 --> 00:12:27,440
The code is no longer simple or portable,
311
00:12:27,440 --> 00:12:31,440
and it becomes tied to a much narrower operating path than the team expected.
312
00:12:31,440 --> 00:12:34,120
The trouble only gets worse when you look at real distributed flows.
313
00:12:34,120 --> 00:12:37,280
If one service writes data and another one stores,
314
00:12:37,280 --> 00:12:40,040
your rollback logic is no longer clean or reliable.
315
00:12:40,040 --> 00:12:44,400
You might not know if the remote side committed the change or if it never saw the request at all.
316
00:12:44,400 --> 00:12:46,280
The system lands in an uncertain state,
317
00:12:46,280 --> 00:12:48,920
which is the exact problem architects try to design away
318
00:12:48,920 --> 00:12:51,480
after they have already created the conditions that cause it.
319
00:12:51,480 --> 00:12:55,200
That is why we see so much talk about sagas and outbox patterns.
320
00:12:55,200 --> 00:12:59,000
These patterns do not pretend the network is stable enough for one giant atomic unit,
321
00:12:59,000 --> 00:13:02,600
so they accept local transactions and coordinate through events and retrays.
322
00:13:02,600 --> 00:13:05,000
In the right scenario, that is definitely the better choice,
323
00:13:05,000 --> 00:13:07,680
but you have to remember that it adds orchestration work
324
00:13:07,680 --> 00:13:11,240
and more failure parts that your team now has to reason about every single day.
325
00:13:11,240 --> 00:13:13,760
The lesson here is not that you should use sagas for everything.
326
00:13:13,760 --> 00:13:15,920
The deeper shift happens much earlier than that.
327
00:13:15,920 --> 00:13:19,640
You should stop turning a cohesive business process into a cross-service workflow
328
00:13:19,640 --> 00:13:23,000
unless that physical separation solves a massive problem for you today.
329
00:13:23,000 --> 00:13:26,440
If the order flow and the pricing rules still move as one unit in the business,
330
00:13:26,440 --> 00:13:29,760
keeping them close together is almost always the simpler and safer design.
331
00:13:29,760 --> 00:13:33,160
Once teams see that text clearly, they have to ask a hard question,
332
00:13:33,160 --> 00:13:35,040
should these things be separate at all?
333
00:13:35,040 --> 00:13:37,000
What the market correction is telling us?
334
00:13:37,000 --> 00:13:40,680
The response to these architectural headaches is finally starting to show up in the market.
335
00:13:40,680 --> 00:13:43,240
This is not just a trend post or a branding shift,
336
00:13:43,240 --> 00:13:45,720
but a genuine correction in how we build software.
337
00:13:45,720 --> 00:13:50,000
A growing number of organizations are pulling services back into larger deployment units,
338
00:13:50,000 --> 00:13:53,800
and they are doing it because companies rarely undo their architecture for fun.
339
00:13:53,800 --> 00:13:58,320
They do it when the operating costs and the friction stop matching the value they were promised.
340
00:13:58,320 --> 00:14:00,880
This is not about being nostalgic for old systems,
341
00:14:00,880 --> 00:14:04,640
but a realization that many distributed setups were solving future problems
342
00:14:04,640 --> 00:14:06,640
by creating massive present-day drag.
343
00:14:06,640 --> 00:14:09,680
The Amazon Prime video case is a perfect example of this shift.
344
00:14:09,680 --> 00:14:13,480
One of their internal teams moved from a distributed design back to a monolith,
345
00:14:13,480 --> 00:14:17,160
and they managed to cut their infrastructure costs by more than 90%.
346
00:14:17,160 --> 00:14:18,840
While that number gets a lot of attention,
347
00:14:18,840 --> 00:14:22,800
the deeper lesson is that their product was video analysis rather than orchestration.
348
00:14:22,800 --> 00:14:25,520
The architecture had become too visible in the cost structure,
349
00:14:25,520 --> 00:14:29,440
which usually means the system is spending way too much energy just managing itself.
350
00:14:29,440 --> 00:14:32,240
Shopify shows us the same lesson from a slightly different angle.
351
00:14:32,240 --> 00:14:34,440
They have huge scale and a massive codebase,
352
00:14:34,440 --> 00:14:36,800
but they maintain strong internal boundaries,
353
00:14:36,800 --> 00:14:41,120
and only extract services when there is a reason strong enough to justify the weight.
354
00:14:41,120 --> 00:14:46,160
This model is important because it breaks the lazy argument that a single deployable unit equals amateur engineering.
355
00:14:46,160 --> 00:14:48,480
A single deployable can be disciplined and modular,
356
00:14:48,480 --> 00:14:52,440
but the difference is that separation stays as an option instead of being a forced default.
357
00:14:52,440 --> 00:14:54,600
The debate itself is what really needs fixing.
358
00:14:54,600 --> 00:14:57,600
Framing this as monolith versus microservices is a mistake,
359
00:14:57,600 --> 00:14:59,640
because it turns architecture into an identity.
360
00:14:59,640 --> 00:15:02,600
Teams start defending their camp instead of looking at the work.
361
00:15:02,600 --> 00:15:07,400
So the better question is simply where physical distribution creates real business value.
362
00:15:07,400 --> 00:15:12,640
You have to find where it creates value and where it just creates admin work around code that actually belongs together.
363
00:15:12,640 --> 00:15:16,040
That is where the modular monolith becomes incredibly useful.
364
00:15:16,040 --> 00:15:21,560
It is not a compromise, but a deliberate structure that gives you one deployable unit with clear internal boundaries.
365
00:15:21,560 --> 00:15:23,280
You still design for separation,
366
00:15:23,280 --> 00:15:28,080
but that separation stays inside the process until the pressure to move it outside becomes real.
367
00:15:28,080 --> 00:15:33,640
This means you keep the speed of local calls and the simplicity of one deployment path while keeping your transactions safe.
368
00:15:33,640 --> 00:15:37,480
For engineering teams, this changes the day-to-day work almost immediately.
369
00:15:37,480 --> 00:15:40,480
Tests are easier to run because the behavior lives in one place,
370
00:15:40,480 --> 00:15:44,560
and debugging is faster because the evidence is not scattered across six different systems.
371
00:15:44,560 --> 00:15:48,880
Refactoring becomes safer because a business change can stay local for a longer period of time.
372
00:15:48,880 --> 00:15:55,400
New developers get productive much faster because they can run the system and follow the flow without stitching together a miniature platform on their laptop.
373
00:15:55,400 --> 00:15:59,120
Executives feel the difference, too, even if they never look at a single line of code.
374
00:15:59,120 --> 00:16:05,520
They see lower total costs and fewer platform dependencies, which leads to less coordination overhead hiding inside their road maps.
375
00:16:05,520 --> 00:16:11,880
Delivery becomes more predictable, and onboarding gets simpler, especially in cases where hard isolation was never actually a requirement.
376
00:16:11,880 --> 00:16:18,000
In a world focused on phintops, architecture is no longer judged by how elegant it looks on a whiteboard, but by what it costs to run.
377
00:16:18,000 --> 00:16:20,800
None of this means that microservices are inherently wrong.
378
00:16:20,800 --> 00:16:26,160
They still fit cases with massive scaling differences or team structures large enough to support that kind of model.
379
00:16:26,160 --> 00:16:30,360
But the market correction is sending a very direct message that premature distribution is expensive.
380
00:16:30,360 --> 00:16:35,080
Many teams are finally admitting that a clean diagram is not the same thing as a fast or reliable system.
381
00:16:35,080 --> 00:16:38,240
The practical move right now is not to start a massive rewrite crusade.
382
00:16:38,240 --> 00:16:39,720
It is about triage.
383
00:16:39,720 --> 00:16:46,560
You need to look at which separations actually create business value and which ones only exist to preserve an idea of purity.
384
00:16:46,560 --> 00:16:51,440
Some services definitely need to stay separate, but others probably should have never been split in the first place.
385
00:16:51,440 --> 00:16:58,400
Once you accept that reality, the next step is figuring out how net teams decide what stays out and what should never leave the process.
386
00:16:58,400 --> 00:17:01,240
A practical decision model for net teams.
387
00:17:01,240 --> 00:17:04,680
So what do you do with this if you're running a net team right now?
388
00:17:04,680 --> 00:17:06,680
Start with one question and keep it blunt.
389
00:17:06,680 --> 00:17:09,400
What problem requires physical separation today?
390
00:17:09,400 --> 00:17:10,120
Not someday.
391
00:17:10,120 --> 00:17:11,480
Not if the company triples.
392
00:17:11,480 --> 00:17:15,200
Not because a reference architecture says it's cleaner today.
393
00:17:15,200 --> 00:17:17,080
If you can't answer that in one sentence,
394
00:17:17,080 --> 00:17:22,640
the safest default is usually to keep the capability in process and design the boundary inside the code first.
395
00:17:22,640 --> 00:17:26,120
The reasons for separation are real, but they're narrower than most teams admit.
396
00:17:26,120 --> 00:17:27,480
Uneven scaling is one.
397
00:17:27,480 --> 00:17:29,520
Compliance isolation can be another.
398
00:17:29,520 --> 00:17:32,240
And a large team with stable ownership lines can be one, two.
399
00:17:32,240 --> 00:17:37,240
A domain that has settled down enough to support durable contracts is also a valid reason.
400
00:17:37,240 --> 00:17:41,160
But if the answer sounds fuzzy like flexibility, future proofing, or best practice,
401
00:17:41,160 --> 00:17:43,320
that usually means the case is still too weak.
402
00:17:43,320 --> 00:17:46,880
This clicked for me when I started treating architecture like an expense account.
403
00:17:46,880 --> 00:17:51,920
Every new service spends something, another repo, another deployment path, another interface to maintain,
404
00:17:51,920 --> 00:17:54,640
another place to instrument, another source of failure.
405
00:17:54,640 --> 00:17:57,480
If that cost doesn't buy a clear business advantage now,
406
00:17:57,480 --> 00:18:00,080
you're just moving work out of the app and into coordination.
407
00:18:00,080 --> 00:18:02,720
That's why module design matters more than service count,
408
00:18:02,720 --> 00:18:09,760
split by business capability, not by technical layer and not by fashion orders, pricing, billing, inventory.
409
00:18:09,760 --> 00:18:13,080
Keep those boundaries explicit in the code and make access intentional.
410
00:18:13,080 --> 00:18:15,760
A modular monolith is not one giant shared mess,
411
00:18:15,760 --> 00:18:17,760
but rather one deployable with rules.
412
00:18:17,760 --> 00:18:21,480
The extraction path stays open later because the capability boundary already exists,
413
00:18:21,480 --> 00:18:23,960
which means you just haven't paid the runtime tax yet.
414
00:18:23,960 --> 00:18:25,760
The same discipline applies to governance.
415
00:18:25,760 --> 00:18:28,080
If a contract check matters, put it in CI.
416
00:18:28,080 --> 00:18:30,640
If a schema rule matters, validate it in pull requests.
417
00:18:30,640 --> 00:18:33,160
If an API standard matters, lint it automatically.
418
00:18:33,160 --> 00:18:36,560
Don't force developers to wait for a meeting to learn that a rule was broken.
419
00:18:36,560 --> 00:18:38,560
Fast feedback keeps governance real,
420
00:18:38,560 --> 00:18:41,160
while slow feedback turns it into queue management.
421
00:18:41,160 --> 00:18:45,120
Observability needs the same restraint, trace critical paths first.
422
00:18:45,120 --> 00:18:49,000
Revenue flows, failure prone flows, customer facing bottlenecks.
423
00:18:49,000 --> 00:18:52,400
Don't trace everything by default just because the platform can.
424
00:18:52,400 --> 00:18:56,240
Most teams don't have an observability problem, they have a prioritization problem.
425
00:18:56,240 --> 00:18:57,840
The same goes for service mesh.
426
00:18:57,840 --> 00:18:58,840
Don't start there.
427
00:18:58,840 --> 00:19:03,200
Use it when the traffic policy or security need is concrete enough to justify the extra moving parts.
428
00:19:03,200 --> 00:19:07,080
For consistency, prefer local transactions, where the work is still local.
429
00:19:07,080 --> 00:19:10,600
When systems do need to communicate, use patterns like outbox and events
430
00:19:10,600 --> 00:19:13,440
instead of forcing one giant commit across boundaries.
431
00:19:13,440 --> 00:19:16,360
That won't remove complexity, but it keeps the complexity honest.
432
00:19:16,360 --> 00:19:20,160
You're no longer pretending a distributed workflow is a single database right.
433
00:19:20,160 --> 00:19:23,240
And then measure the architecture by outcomes people can actually feel.
434
00:19:23,240 --> 00:19:28,280
Lead time for changes, debugging hours, deployment friction, cloud cost, onboarding time.
435
00:19:28,280 --> 00:19:32,480
If those numbers are getting worse, while the diagram gets cleaner, the diagram is lying to you.
436
00:19:32,480 --> 00:19:33,360
So here's the challenge.
437
00:19:33,360 --> 00:19:36,640
Pick one service in your estate that nobody can justify clearly anymore.
438
00:19:36,640 --> 00:19:39,480
One service that changes with another service almost every time.
439
00:19:39,480 --> 00:19:43,400
One service that exists mostly because it was split once and never questioned again.
440
00:19:43,400 --> 00:19:47,280
Ask whether it should still be a service or whether it should become a module again.
441
00:19:47,280 --> 00:19:51,320
Because the real decision was never about purity, it was always about delivery capacity.
442
00:19:51,320 --> 00:19:53,800
So the shift is simple even if the cleanup isn't.
443
00:19:53,800 --> 00:19:58,480
Stop treating distribution like maturity and start treating speed like the thing you protect.
444
00:19:58,480 --> 00:20:02,000
If small changes keep triggering coordination, the model is wrong.
445
00:20:02,000 --> 00:20:04,480
Ordered one recent feature from idea to production.
446
00:20:04,480 --> 00:20:08,720
Count the services touched, contracts changed approvals needed and tracing required.
447
00:20:08,720 --> 00:20:10,120
Then ask one hard question.
448
00:20:10,120 --> 00:20:13,240
Did that separation help the business or just the architecture diagram?
449
00:20:13,240 --> 00:20:17,440
If this change how you think, subscribe, leave a review and connect with me, Mercopeter's
450
00:20:17,440 --> 00:20:20,080
on LinkedIn with the next architecture problem you want unpacked.

Founder of m365.fm, m365.show and m365con.net
Mirko Peters is a Microsoft 365 expert, content creator, and founder of m365.fm, a platform dedicated to sharing practical insights on modern workplace technologies. His work focuses on Microsoft 365 governance, security, collaboration, and real-world implementation strategies.
Through his podcast and written content, Mirko provides hands-on guidance for IT professionals, architects, and business leaders navigating the complexities of Microsoft 365. He is known for translating complex topics into clear, actionable advice, often highlighting common mistakes and overlooked risks in real-world environments.
With a strong emphasis on community contribution and knowledge sharing, Mirko is actively building a platform that connects experts, shares experiences, and helps organizations get the most out of their Microsoft 365 investments.