

")
This episode explains how Microsoft Fabric can significantly elevate the work of Power BI professionals by unifying data engineering, governance, storage, and analytics into one platform. It shows how Fabric enhances existing Power BI workflows without forcing teams to redo their reports or models.
You’ll learn what Fabric means for your current Power BI environment, how it fits into Microsoft’s roadmap, and how it can impact your career. The episode includes practical migration guidance, tips for preserving datasets and semantic models, and warnings about common performance traps. It also walks through live demo scenarios such as creating a Lakehouse-backed semantic model and scaling it for enterprise use.
Key topics include centralized governance, lineage, compliance, and realistic discussions about cost and scaling — including when Fabric can save money and when it may not. Listeners leave with a clear evaluation checklist, a modernization plan, stakeholder talking points, and a playbook for combining Power BI with Fabric’s compute and storage capabilities.
It’s designed for Power BI creators, data engineers, and analytics leaders who want to modernize their data stack and take advantage of Fabric quickly and effectively.


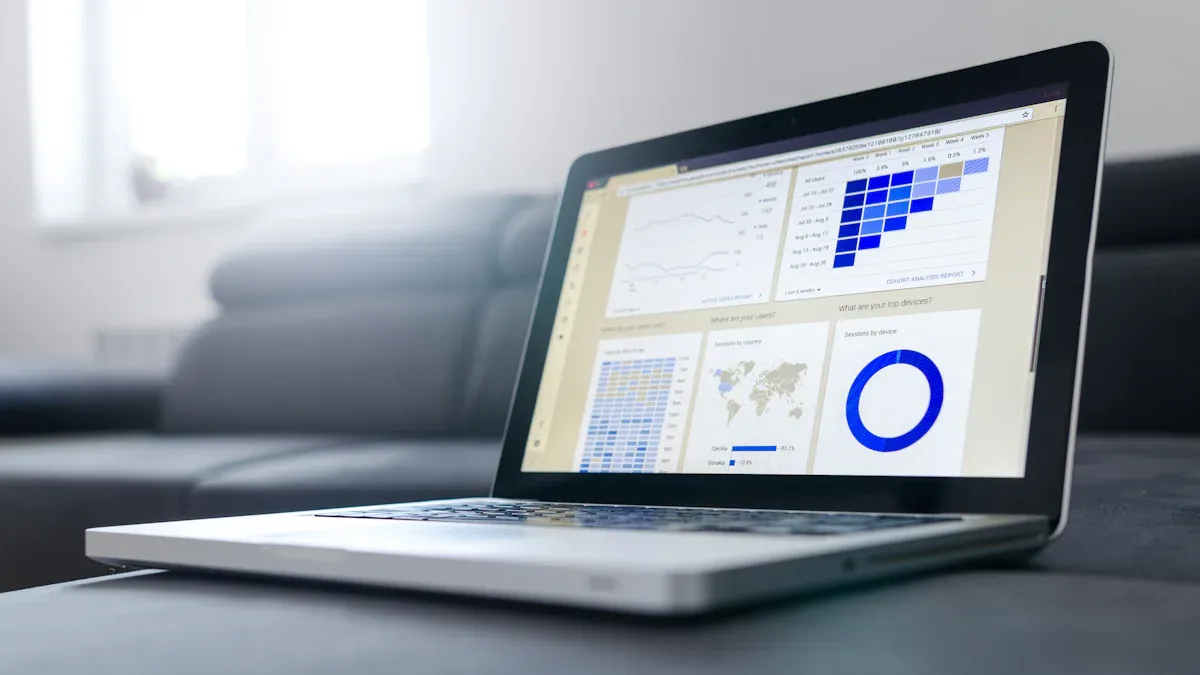
Microsoft Fabric has flipped the script for BI pros like you. You see your daily reporting turn from chaos to confidence, thanks to centralized data uploads and automated processes. Career paths shift as Microsoft aligns the BI roadmap with long-term intelligence goals. The urgency is real—Power BI users now get a unified analytics platform, live dashboards, and secure governance. Check out the table below for a snapshot of how Fabric changes your workflow:
| Aspect of Impact | Description |
|---|---|
| Workflow Efficiency | Centralized uploads and automation boost reliability and reduce reporting chaos. |
| BI Roadmap Alignment | Services align with enterprise intelligence goals for better decision-making. |
| Integration with Power BI | Certified models and governed self-service improve analytics quality. |
You get the benefits of streamlined processes and actionable insights, so it’s time to adapt and thrive.
Key Takeaways
- Microsoft Fabric simplifies BI workflows by centralizing data management and automating processes.
- The platform integrates seamlessly with Power BI, allowing for real-time analytics and live dashboards.
- OneLake serves as a unified data lake, eliminating data silos and enabling instant access to all data sources.
- BI professionals need to adapt by learning new skills, including SQL, data engineering, and AI tools.
- Effective migration to Microsoft Fabric requires careful planning, including a health check and workspace organization.
- Collaboration improves with real-time updates and shared dashboards, enhancing team efficiency.
- Strong governance and security features protect sensitive data and ensure compliance with regulations.
- Regular training and upskilling are essential for BI teams to fully leverage the capabilities of Microsoft Fabric.
7 Surprising Facts about Microsoft Fabric for BI Professionals
Microsoft Fabric for BI professionals represents the next evolution of Power BI and the broader analytics stack. Here are seven surprising facts that many BI practitioners find unexpected and impactful.
- Unified platform beyond Power BI: Although often introduced as Power BI's evolution, Microsoft Fabric converges data engineering, data science, real-time analytics, and business intelligence into a single integrated platform, reducing tool sprawl for BI teams.
- LakeHouse at the center: Fabric uses a LakeHouse architecture natively, unifying files, tables, and transactional workloads on top of a OneLake storage layer—making it easier to manage data lifecycle and governance from ingestion to reporting.
- Native support for multiple compute engines: Fabric includes specialized runtimes (Data Factory-like pipelines, Spark, SQL, Real-Time Analytics, and Power BI experiences) that run side-by-side and share metadata and security, enabling flexible processing patterns without moving data.
- OneLake provides cross-workspace data visibility: OneLake acts like a corporate data lake with a single namespace, allowing BI professionals to reference the same datasets across workspaces while retaining lineage, governance, and access controls.
- Fabric integrates notebooks and low-code experiences: BI pros can mix code-based notebooks (Python, Spark) with low-code Power Query and semantic modeling in the same environment, enabling collaboration between analysts, data engineers, and data scientists.
- Instant semantic models with Power BI experience: Fabric decouples the semantic model from specific reports: semantic models can be built, hosted, and reused across multiple reports and apps with enterprise-grade performance and incremental refreshes.
- End-to-end governance and observability: Fabric embeds lineage, cataloging, and monitoring across ingestion, transformation, modeling, and reporting, giving BI teams enterprise-grade observability without stitching multiple third-party tools together.
What Is Microsoft Fabric for BI Pros
Microsoft Fabric Overview
You might wonder what sets Microsoft Fabric apart from other tools you’ve used. Microsoft Fabric is an end-to-end analytics platform built for BI professionals like you. It brings together everything you need—data ingestion, transformation, storage, and visualization—into one seamless experience. You no longer have to jump between different tools or worry about moving data from one place to another. With Fabric, you get a unified environment that simplifies your daily workflow and lets you focus on delivering insights.
Here’s what makes this platform so powerful for BI:
- Power BI connects to your data sources and helps you build interactive dashboards.
- Integrated tools handle data ingestion, transformation, and visualization.
- The unified platform makes data handling and maintenance much easier.
You’ll notice that the familiar Power Query Editor is right there in the Fabric ecosystem, so you can get started without a steep learning curve. The platform supports both structured and semi-structured data, which means you can work with data warehouse tables or lakehouse files in the same place.
Key Features for BI
Fabric isn’t just about bringing everything together—it’s about making your BI life easier and more productive. Let’s look at some of the features BI pros rave about:
| Key Feature | Description |
|---|---|
| Unified Data Integration | Store, process, and analyze all your data in one place for maximum efficiency. |
| Real-time Analytics | Get up-to-the-minute insights, so your decisions are always based on the latest information. |
| AI-driven Automation | Let automation handle repetitive tasks and speed up your data experience. |
| Enhanced Collaboration Tools | Work with your team more easily, sharing data and insights across the organization. |
You can now build end-to-end analytics pipelines without switching tools. Copilot, the AI assistant, helps you create reports and analyze data faster. DirectLake lets you query data directly from OneLake, which boosts performance and cuts down on wait times.
OneLake and Unified Data
OneLake is the heart of Microsoft Fabric. Think of it as your single source of truth—a unified data lake that stores everything in an open format. You don’t have to worry about data silos anymore. OneLake lets you create shortcuts to external sources, so you can access all your data without moving it around.
Here’s how OneLake transforms your BI workflow:
- You can write directly to a lakehouse table, skipping unnecessary data movement.
- Power BI analysts can query data instantly using Direct Lake mode.
- Data scientists and SQL developers get immediate access, with no extra setup.
With OneLake, every workload in the fabric ecosystem taps into the same data foundation. This means your team can visualize KPIs across regions in real time, and everyone works from the same up-to-date information. You get a smoother, more connected data experience, whether you’re building a dashboard or running advanced analytics in your data warehouse.
Tip: OneLake’s unified approach means you spend less time managing data and more time uncovering insights that drive your business forward.
Microsoft Fabric and Power BI Integration

Seamless Data Transformation
You want your data to move smoothly from raw files to polished dashboards. Microsoft Fabric makes this easy. You can store both structured and unstructured data in one place. The Lakehouse architecture lets you switch between data lakes and warehouses without extra steps. You don’t waste time moving files or setting up new systems. Everything sits in a single location, ready for any BI workload.
Here’s what you get with seamless data transformation:
- You store all your data in one spot, so you don’t deal with silos.
- You access data instantly, no matter the format or source.
- You run analytics faster because Fabric connects storage and compute in a smart way.
- You use Power Query right inside Fabric, so you transform data with familiar tools.
You spend less time on setup and more time on analysis. Fabric’s unified approach means you can focus on finding insights, not managing files.
Real-Time Analytics with Power BI
You need answers now, not later. Microsoft Fabric gives you real-time intelligence by connecting streaming data to your dashboards. You see live numbers, spot trends, and react quickly. Fabric handles everything from data ingestion to analysis in one platform. You don’t have to wait for scheduled reports or batch updates.
Fabric boosts performance for real-time analytics. You use Event Streams to capture and process data instantly. Built-in ingestion lets you pull data from many sources without delay. You visualize live data in Power BI and set up automated alerts. You make decisions right when things happen.
Microsoft combines scalable Azure technology with Power BI’s easy-to-use analytics. You get enterprise-grade speed and reliability. Fabric unifies integration, engineering, warehousing, and business intelligence around OneLake. This setup improves responsiveness and makes your analytics smoother.
Enhanced Collaboration
You work better when your team shares the same data and insights. Fabric brings everyone together in one platform. You don’t juggle multiple vendors or deal with redundant tools. Real-time updates keep your team on the same page. You embed dashboards in Microsoft Teams, so you discuss numbers and take action right away.
Check out how Fabric improves collaboration:
| Feature | Benefit |
|---|---|
| Integration into a single platform | Reduces redundancy and vendor complexity, enhancing team efficiency. |
| Real-time updates | Facilitates dynamic collaboration and faster decision-making. |
| Embedding dashboards in Teams | Merges data insights with business communication for immediate action. |
You use shared semantic models to keep reports consistent across departments. You don’t rebuild dashboards or models. Fabric reduces model sprawl and scales as your analytics needs grow. Optimized storage and compute engines help you query large datasets efficiently. Your BI team works together, shares insights, and drives intelligence across the organization.
Tip: With Microsoft Fabric, you unlock a new level of teamwork and speed. You get reliable data, real-time intelligence, and a platform that grows with your business.
Migrating from Power BI Premium to Microsoft Fabric
Migration Guidance
Ready to start your transition to fabric? You want a smooth migration that keeps your bi projects running strong. Begin with a health check. Inventory all your content—reports, datasets, and dashboards. Identify anything stale or underused. This step helps you avoid moving unnecessary data and keeps your new environment clean.
Next, pick your migration approach. Automation speeds things up, but a manual process lets you clean up and realign governance. Organize your workspaces by domain or function. Set clear naming conventions and assign ownership. Enable fabric workloads like Lakehouse, DirectLake, Pipelines, and Real-Time Analytics as you go. Training is key. Make sure your admins and power users know how to use the new tools. Monitor usage and costs with built-in dashboards.
Here’s a quick look at best practices for transitioning from power bi premium:
| Best Practice | Description |
|---|---|
| Start with a Health Check | Inventory all content and identify what to keep or remove. |
| Choose Migration Approach | Use automation for speed or manual for cleanup and governance. |
| Restructure Workspaces | Organize by domain, set naming rules, and assign ownership. |
| Enable Fabric Workloads | Plan for Lakehouse, DirectLake, Pipelines, and Real-Time Analytics. |
| Train and Monitor | Educate users and track usage and costs. |
Tip: Start with a pilot migration. Test your steps before moving everything. This helps you catch issues early and keeps your bi projects on track.
Preserving Datasets and Models
When you move your data and models, you want everything to work just as well—or better—in fabric. The transition to fabric brings new storage and compute layers. Some existing data models may need updates to fit the new architecture. Large datasets might require a refresh strategy review. You may need to adjust refresh patterns to avoid performance issues.
You also need to map workspaces and capacities carefully. Assign each workspace to the right fabric capacity. This step helps you avoid performance slowdowns. Review your security settings. Fabric introduces new layers and tenant settings. Make sure your data access stays secure and your governance model remains strong.
Migrating datasets and models involves technical changes, but with careful planning, you can keep your bi environment reliable and efficient.
Licensing and Cost Considerations
Licensing changes when you move to fabric. Microsoft uses a different pricing model for fabric compared to power bi premium. You now choose from F-SKUs, which offer flexible capacity options. Analyze your current usage to pick the right size. Monitor costs closely, especially during the early stages of migration. New monitoring tools help you track usage and avoid surprises.
Workspace and capacity mapping can affect costs and performance. Assign workspaces thoughtfully to prevent overuse or underuse of resources. Feature transitions may bring new capabilities, so roll them out gradually. Keep your team informed about changes in licensing and features.
Note: Regularly review your usage and costs. Adjust your capacity as your bi needs grow. This proactive approach helps you get the most value from your transition to fabric.
BI Workflow Transformation with Microsoft Fabric
Unified Data Management
You want your data in one place, easy to find and ready to use. That’s what you get with fabric. OneLake acts as your single data lake, so you don’t have to search across different systems or worry about missing files. You store all types of data—structured, semi-structured, or unstructured—in one spot. This setup means you spend less time moving data and more time finding insights.
With fabric, you use data pipelines that connect everything together. You don’t need to build complex connectors or write custom code. You just set up your pipeline and let it run. Semantic models help your team speak the same data language. Everyone uses the same definitions, so reports stay consistent.
Here’s what makes unified data management with fabric stand out:
- OneLake keeps all your enterprise data in one place.
- Data pipelines simplify ETL, so you connect sources without headaches.
- Semantic models create a common language for your team.
- Built-in governance tools track data lineage and control access.
- Power BI connects directly for faster, smarter analytics.
You see the benefits right away. Teams work together in real time, sharing datasets and building reports. You don’t waste time on manual refreshes or third-party tools. Everything happens in one environment, which means leaner operations and faster development cycles.
Tip: Centralized data management reduces duplication and cuts down on infrastructure costs. You get reliable, decision-ready insights every time.
Check out how fabric boosts workflow efficiency:
| Metric | Value |
|---|---|
| ROI over three years | 379% |
| Payback period | Under 6 months |
| Benefits from improved data accessibility | $8.3M |
| Reduction in time spent on data preparation | 70% |
Streamlined Governance and Security
You want your data safe and your organization compliant. Microsoft fabric gives you both. You use Microsoft Purview to manage sensitivity labels and protect sensitive information. You tag data, so only the right people see it. This keeps you in line with privacy rules and builds trust with your users.
Fabric enforces governance policies across your entire data environment. You use data cataloging to know what you have and where it lives. Lineage tracking shows you how data moves from source to report. Auditing tools let you see who accessed what and when. You control access with role-based permissions, so only authorized users get in.
Here’s how fabric makes governance and security simple:
- Integration with Microsoft Purview for sensitivity labels.
- Consistent enforcement of compliance policies.
- Data encryption for all assets.
- Role-based access controls for secure sharing.
- Seamless workflows with Azure and Power BI.
You don’t have to worry about gaps in your security. Fabric keeps everything in one place, so you manage policies once and apply them everywhere. This approach saves you time and reduces risk.
Note: Strong governance means you can scale your BI operations with confidence. You protect your data and your reputation.
Scalability and Performance
You need your BI platform to grow with your business. Fabric gives you the capacity to handle more data, more users, and more complex analytics. You don’t have to rebuild your system every time your needs change. You just adjust your fabric capacity and keep going.
Fabric supports real-time intelligence, so you see live data and make quick decisions. You use direct integration with Power BI to build dashboards that update instantly. This speed helps you react to changes and stay ahead of the competition.
Organizations that move to fabric see big benefits. They get quicker time-to-value because everything works together. They save money by shutting down old systems and reducing infrastructure costs. Real-time analytics help you adjust your strategy and boost profitability.
Here’s what you gain with fabric scalability:
- Centralized visibility across all data assets.
- Reduced duplication and infrastructure waste.
- Consistent security and compliance.
- Fast access to reliable insights.
- Support for advanced analytics, real-time reporting, and AI.
You measure your success by the numbers. After migration, organizations report a three-year total cost of ownership of $15.2 million, with monthly savings of $124,154. The combined monthly benefit reaches $324,154, leading to a three-year ROI of about 36%.
Tip: Regularly review your capacity and optimize your data processes. This keeps your BI environment efficient and ready for growth.
You see how fabric transforms your workflow. You get unified data management, strong governance, and the power to scale. Your BI team spends less time on setup and more time delivering intelligence.
New Skills and Roles for BI Pros
Evolving BI Skillsets
You might notice that your role as a BI professional looks different with fabric. The days of just building reports are over. Now, you need to work with data at every stage, from ingestion to visualization. You want to master new technical skills to keep up with the pace of change. Here are some of the top skills you should focus on:
- SQL proficiency helps you write queries with joins, aggregations, and window functions.
- You need to understand Power BI deeply, including data modeling, DAX, and XMLA endpoints.
- Data engineering skills matter more than ever. You should get comfortable with PySpark, Jupyter Notebooks, and Delta Lake.
- Learn about change data capture, query optimization, and the difference between real-time and batch processing.
- Security is key. You want to know how to use Row-Level Security and Role-Based Access Control.
- KQL knowledge gives you an edge for real-time analytics.
You also want to get familiar with AI tools. These tools help you automate tasks and add intelligence to your dashboards. As fabric grows, you will see more features that use AI to speed up your work.
Upskilling for Microsoft Fabric
You don’t have to figure out this transition alone. Microsoft offers many ways to help you upskill and get ready for fabric. You can join free live sessions with Microsoft Fabric experts. These sessions prepare you for the DP-600 exam and help you earn your Fabric Analytics Engineer certification.
If you like hands-on learning, try Microsoft Applied Skills. These assessments let you practice real-world challenges and build your confidence. You can also follow a structured learning path on Microsoft Learn. This path covers everything from beginner to advanced topics, including roles like Data Analyst, Data Engineer, and Data Scientist.
Here’s a quick list to help you get started:
- Attend live sessions with Microsoft Fabric experts.
- Take hands-on assessments with Microsoft Applied Skills.
- Explore the Microsoft Learn path with 10 beginner modules.
You will find that these resources make your migration from Power BI Premium to fabric much smoother. They also help you get the most out of your fabric capacity and new analytics features.
Emerging Roles in Analytics
With fabric, you see new roles popping up in the world of analytics. You might move beyond your current BI title and step into a more specialized position. Here are some of the roles you could explore:
- Data Analyst
- Data Engineer
- Analytics Engineer
- BI Developer
- Cloud Data Architect
- AI & Machine Learning Engineer
Each of these roles lets you work with data in new ways. You might design data pipelines, manage fabric capacity, or build AI-powered dashboards. The transition to fabric opens up more paths for growth and lets you shape the future of business intelligence.
Tip: Stay curious and keep learning. The more you know about fabric and data engineering, the more valuable you become in your organization.
Challenges and Considerations for Microsoft Fabric Adoption
Adopting fabric brings a lot of promise, but you’ll want to prepare for a few bumps along the way. Let’s look at what you and your team might face as you move to this new platform.
Learning Curve for BI Teams
Switching to fabric means you’ll need to learn new skills and adjust your daily routines. Many teams notice a drop in productivity at first. You might see a 20-30% decrease for three to six months as everyone gets used to the new tools. Each team member usually needs 40-80 hours of training, and it can take over a year to become an expert. You’ll find that SQL engineers and BI analysts both need to upskill, especially when working with real-time intelligence and AI features.
| Metric | Value |
|---|---|
| Initial productivity drop | 20-30% decrease for 3-6 months |
| Training time | 40-80 hours per team member |
| Expert development timeline | 12-18 months |
You might also run into skill gaps. Some team members may feel overwhelmed by new concepts like fabric capacity or real-time analytics. It helps to set up regular training sessions and encourage everyone to share what they learn.
Integration with Existing Tools
You probably rely on a mix of tools, from Power BI Premium to other analytics platforms. The good news is that fabric works alongside Power BI, so you don’t have to rebuild your reports. You can modernize your data infrastructure while keeping your favorite dashboards. Fabric also connects with Office 365, Teams, and SharePoint, making it easy to share insights across your organization.
Here’s how fabric fits into your current setup:
- You can embed Power BI reports in Teams and SharePoint.
- Fabric uses Azure Active Directory for secure access.
- Built-in connectors and APIs let you keep using tools like Tableau.
- Real-time analytics help you monitor production or sales data without switching platforms.
Many companies in finance, manufacturing, and retail have used fabric to unify their data and boost reporting efficiency. You get a smoother transition and keep your existing investments working for you.
Change Management
Change can be tough, especially when it affects your whole team. You’ll want a clear plan for your transition to fabric. Start by engaging key stakeholders early. Make sure everyone understands the benefits and goals. A phased rollout works best—begin with a small pilot group, then expand as your team gains confidence.
Some organizations set up a center of excellence to support users and answer questions. Focus on data governance to create a single source of truth. Assign clear roles for managing the change, and provide resources for ongoing support.
Tip: Gradual implementation and open communication help your team adapt faster and get the most from fabric.
You may hear some misconceptions, like thinking fabric is just a rebranding or only for large enterprises. In reality, fabric offers a unified SaaS analytics platform that scales for any business size. It brings together data, real-time intelligence, and AI, so you can unlock new value no matter where you start.
You’ve seen how microsoft fabric changes the game for bi professionals. The platform brings everything together, so you spend less time juggling tools and more time driving results. With microsoft’s focus on real-time analytics and centralized data, your role evolves fast. Keep learning and stay curious—continuous training helps you future-proof your skills and unlock new opportunities. Embrace fabric now, and you’ll lead the way in modern analytics.
Checklist: Learn Microsoft Fabric for BI Professionals
FAQ
What is Microsoft Fabric?
You get an end-to-end analytics platform that brings data engineering, storage, and visualization together. Microsoft fabric helps you manage all your data in one place and makes your BI workflow easier.
Do I need to rebuild my Power BI reports?
No, you can keep your existing reports. You connect them to new data sources in fabric and use familiar tools like Power Query. Your dashboards stay up-to-date.
How does OneLake help my team?
OneLake gives you a single data lake. You store, access, and share data without moving files. Your team works from the same source, so everyone sees the latest information.
Can I use real-time analytics?
Yes, you can. Fabric lets you connect streaming data to your dashboards. You see live numbers and react quickly. Event Streams and built-in ingestion make this possible.
What skills should I learn for fabric?
You want to know SQL, Power BI, and data engineering basics. Try learning PySpark, Jupyter Notebooks, and AI tools. Microsoft offers training and certifications to help you grow.
How do I migrate from Power BI Premium?
Start with a health check. Inventory your reports and datasets. Choose a migration approach, organize workspaces, and train your team. Use built-in dashboards to monitor usage and costs.
Is my data secure in fabric?
Yes, your data stays safe. You use Microsoft Purview for sensitivity labels and role-based access controls. Encryption and auditing tools protect your information.
Can fabric work with other tools?
You connect fabric to Office 365, Teams, and SharePoint. Built-in APIs let you use other analytics platforms. You share insights across your organization without extra steps.
What is Microsoft Fabric and how does it relate to business intelligence professionals?
Microsoft Fabric is an all-in-one data and analytics platform that brings together storage, compute, and semantic models to support business intelligence workflows. Fabric provides unified experiences for data engineering, warehousing, real-time analytics, and semantic modeling so business intelligence professionals and power bi users can build, share, and consume trusted data and reports within the fabric.
What is the Fabric semantic model and why does it matter for Power BI users?
The Fabric semantic model (also called the semantic layer) is a curated, reusable model of business logic, measures, and relationships that sits between raw data and BI reports. Power bi users and power bi developers can connect to this semantic model to ensure consistent metrics across dashboards, reduce duplication, and enable governed self-service analytics. Announcing the fabric semantic emphasizes centralized, enterprise-grade semantics accessible to both BI users and developers.
How do Power BI and Microsoft Fabric work together for BI users?
Power BI can access data and semantic models within Fabric directly, enabling power bi users to author reports against fabric datasets or semantic models. Fabric integrates with Power BI experiences so power bi developers can use familiar tools (Power BI Desktop, DAX) while benefiting from Fabric's scale, governance, and shared semantic assets—power bi to microsoft fabric scenarios streamline collaboration between business users and developers.
What components of Microsoft Fabric should BI developers know about?
Key components of Microsoft Fabric include OneLake (data lake), data factory-like orchestration, the semantic model/Power BI dataset layer, a lakehouse, and a data warehouse (fabric data warehouse). Power bi developers should learn how to use fabric items such as notebooks, dataflows, and pipelines to transform data, then publish semantic models that business users consume in Power BI. Microsoft Fabric introduces end-to-end capabilities for modern analytics.
Can existing Power BI datasets be migrated to Microsoft Fabric?
Yes, power bi datasets and semantic models can be migrated or connected into Fabric. Power BI developers can bring datasets into Fabric to take advantage of improved performance, centralized semantics, and governance. Fabric provides tools to move or reference Power BI assets so organizations can transition from scattered datasets to shared fabric semantic models and power bi and fabric integration.
How does Microsoft Fabric handle governance and Microsoft Purview integration?
Microsoft is integrating governance across Fabric with Microsoft Purview to provide lineage, cataloging, and access control. Fabric can be used with Purview to classify data, track data in the fabric, and enforce policies so business intelligence professionals and power bi users can trust the data powering their reports. This integration helps maintain security while enabling self-service analytics.
What are the differences between BI users and BI developers in a Fabric environment?
BI users (business users, power bi users) typically consume reports and dashboards, explore data via semantic models, and create ad-hoc visuals. BI developers (power bi developers, data engineers) build the underlying transformations, data models, DAX measures, and semantic models that serve those users. Fabric enables both roles: fabric is built to let developers create governed assets while allowing business users to use those assets without deep technical complexity.
How does Microsoft Fabric compare to traditional data platforms for business intelligence?
Fabric represents a shift to a unified platform where ETL, storage, semantic modeling, and BI converge. Unlike fragmented toolchains, Fabric offers integrated components of microsoft fabric—warehouse, lakehouse, semantic model, and orchestration—reducing integration overhead. For power bi and microsoft fabric scenarios, Fabric can improve speed to insight, centralize metrics, and bring the power of Microsoft Fabric to power bi workflows.
Can Fabric support advanced analytics and predictions inside BI reports?
Yes, fabric can be used to incorporate advanced analytics and predictions into BI reports. Fabric provides compute and services for machine learning and predictive scoring that power bi users can surface through semantic models and visuals. Developers can integrate predictions into the fabric semantic model so business users can view predictive insights directly within Power BI reports.
What is the role of Data Factory–style capabilities within Microsoft Fabric?
Fabric includes data factory-like orchestration for ingestion and transformation (pipelines, dataflows) that emulate traditional data factory features. These capabilities allow teams to design ETL and ELT processes within Fabric to prepare data for the semantic model and fabric data warehouse. Using microsoft fabric's integrated pipelines simplifies moving data into the fabric and preparing it for consumption by power bi developers and business users.
Do I need Power BI Premium to use Microsoft Fabric?
While power bi premium capacity provides advanced features for large-scale Power BI deployments, Microsoft Fabric can be adopted alongside Power BI licensing. Some Fabric capabilities overlap with Power BI Premium features, and organizations using power bi pro may evaluate upgrades depending on scale and governance needs. The combination of power bi premium capacity and Fabric delivers enterprise-grade performance and management for BI at scale.
How can teams get started using Microsoft Fabric for BI projects?
Teams should start by identifying key datasets, defining a semantic model for consistent business metrics, and piloting a Fabric workspace that includes ingestion pipelines and a semantic model. Power bi developers can test publishing datasets to the fabric and power bi users can validate report consumption. Microsoft fabric community resources and documentation can help teams learn how microsoft fabric offers capabilities and how to use the fabric to accelerate BI initiatives.
What are common migration considerations when moving Power BI assets to Fabric?
Considerations include assessing existing power bi dataset dependencies, DAX compatibility, governance and security policies, and performance requirements. Teams should plan how to consolidate data in OneLake or a fabric data warehouse, migrate semantic models, and update report connections. Testing and change management are important so business users experience minimal disruption as power bi to microsoft fabric transitions occur.
🚀 Want to be part of m365.fm?
Then stop just listening… and start showing up.
👉 Connect with me on LinkedIn and let’s make something happen:
- 🎙️ Be a podcast guest and share your story
- 🎧 Host your own episode (yes, seriously)
- 💡 Pitch topics the community actually wants to hear
- 🌍 Build your personal brand in the Microsoft 365 space
This isn’t just a podcast — it’s a platform for people who take action.
🔥 Most people wait. The best ones don’t.
👉 Connect with me on LinkedIn and send me a message:
"I want in"
Let’s build something awesome 👊
If you’ve been comfortable building dashboards in Power BI, the ground just shifted. Power BI alone is no longer the full story. Fabric isn’t just a version update—it reworks how analytics fits together. You can stop being the person who only makes visuals. You can shape data with pipelines, run live analytics, and even bring AI into the mix, all inside the same ecosystem. So here’s the real question: are your current Power BI skills still enough? By the end of this podcast, you’ll know how to provision access, explore OneLake, and even test a streaming query yourself. And that starts by looking at the hidden limits you might not realize have been holding Power BI back.
The Hidden Limits of Traditional Power BI
Most Power BI professionals don’t realize they’ve been working inside invisible walls. On the surface, it feels like a complete toolkit—you connect to sources, build polished dashboards, and schedule refreshes. But behind that comfort lies a narrow workflow that depends heavily on static data pulls. Traditional Power BI setups often rely on scheduled refreshes rather than streaming or unified storage, which means you end up living in a world of snapshots instead of live insight. For most teams, the process feels familiar. A report is built, published to the Power BI service, and the refresh schedule runs once or twice a day. Finance checks yesterday’s numbers in the morning. Operations gets weekly or monthly summaries. The cadence seems manageable, and it has been enough—until expectations change. Businesses don’t only want to know what happened yesterday; they want visibility into what’s happening right now. And those overnight refreshes can’t keep up with that demand. Consider a simple example. Executives open their dashboard mid-afternoon, expecting live figures, only to realize the dataset won’t refresh until the next morning. Decisions get made on outdated numbers. That single gap may look small, but it compounds into missed opportunities and blind spots that organizations are less and less willing to tolerate. Ask yourself this: does your team expect sub-hourly, operational analytics? If the answer is yes, those scheduled refresh habits no longer fit the reality you’re working in. The challenge is bigger than just internal frustration. The market has moved forward. Organizations compare Power BI against entire analytics ecosystems—stacks built around streaming data, integrated lakehouses, and real-time processing. Competitors showcase dashboards where new orders or fraud alerts appear second by second. Against that backdrop, “refreshed overnight” no longer feels like a strength; it feels like a gap. And here’s where it gets personal for BI professionals. The skills that once defined your value now risk being seen as incomplete. Leaders may love your dashboards, but if they start asking why other platforms deliver real-time feeds while yours are hours behind, your credibility takes the hit. It’s not that your visuals aren’t sharp—it’s that the role of “report builder” doesn’t meet the complexity of today’s demands. Without the ability to help design the actual flow of data—through transformations, streaming, or orchestration—you risk being sidelined in conversations about strategy. Microsoft has been watching the same pressures. Executives were demanding more than static reporting layers, and BI pros were feeling boxed in by the setup they had to work with. Their answer wasn’t a slight patch or an extra button—it was Fabric. Not framed as another option inside Power BI Desktop, but launched as a reimagined foundation for analytics within the Microsoft ecosystem. The goal was to collapse silos so the reporting layer connects directly to data engineering, warehousing, and real-time streams without forcing users to switch stacks. The shift is significant. In the traditional model, Power BI was the presentation layer at the end of someone else’s pipeline. With Fabric, those boundaries are gone. You can shape data upstream, manage scale, and even join live streams into your reporting environment. But access to these layers doesn’t make the skills automatic. What looks exciting to leadership will feel like unfamiliar territory to BI pros who’ve never had to think about ETL design or pipeline orchestration. The opportunity is real, but so is the adjustment. The takeaway is clear: relying on the old Power BI playbook won’t be enough as organizations shift toward integrated, real-time analytics. Fabric changes the rules of engagement, opening up areas BI professionals were previously fenced out of. And here’s where many in the community make their first misstep—by assuming Fabric is simply one more feature added on top of Power BI.
Why Fabric Isn’t Just ‘Another Tool’
Fabric is best understood not as another checkbox inside Power BI, but as a platform shift that redefines where Power BI fits. Conceptually, Power BI now operates within a much larger environment—one that combines engineering, storage, AI, and reporting under one roof. That’s why calling Fabric “just another tool” misses the reality of what Microsoft has built. The simplest way to frame the change is with two contrasts. In the traditional model, Power BI was the end of the chain: you pulled from various sources, cleaned with Power Query, and pushed a dataset to the service. Scheduling refreshes was your main lever for keeping data in sync. In the Fabric model, that chain disappears. OneLake acts as a single foundation, pipelines handle transformations, warehousing runs alongside reporting, and AI integration is built in. Instead of depending on external systems, Fabric folds those capabilities into the same platform where Power BI lives. For perspective, think about how Microsoft once repositioned Excel. For years it sat at the center of business processes, until Dynamics expanded the frame. Dynamics wasn’t an Excel update—it was a shift in how companies handled operations end to end. Fabric plays a similar role: it resets the frame so you’re not just making reports at the edge of someone else’s pipeline. You’re working within a unified data platform that changes the foundation beneath your dashboards. Of course, when you first load the Fabric interface, it doesn’t look like Power BI Desktop. Terms like “lakehouse,” “KQL,” and “pipelines” can feel foreign, almost like you’ve stumbled into a developer console instead of a reporting tool. That first reaction is normal, and it’s worth acknowledging. But you don’t need to become a full-time data engineer to get practical wins. A simple way to start is by experimenting with a OneLake-backed dataset or using Fabric’s built-in dataflows to replicate something you’d normally prep in Power Query. That experiment alone helps you see the difference between Fabric and the workflow you’ve relied on so far. Ignoring this broader environment has career consequences. If you keep treating Power BI as only a reporting canvas, you risk being viewed as the “visual designer” while others carry the strategic parts of the data flow. Learning even a handful of Fabric concepts changes that perception immediately. Suddenly, you’re not just publishing visuals—you’re shaping the environment those visuals depend on. Here’s a concrete example. In the old setup, analyzing large transactional datasets often meant waiting for IT to pre-aggregate or sample data. That introduced delays and trade-offs in what you could actually measure. Inside Fabric, you can spin up a warehouse in your workspace, tie it directly to Power BI, and query without moving or trimming the data. The dependency chain shortens, and you’re no longer waiting on another team to decide what’s possible. Microsoft’s strategy reflects where the industry has been heading. There’s been a clear demand for “lakehouse-first” architectures: combining the scalability of data lakes with the performance of warehouses, then layering reporting on top. Competitors have moved this way already, and Fabric positions Power BI users to be part of that conversation without leaving Microsoft’s ecosystem. That matters because reporting isn’t convincing if the underlying data flow can’t handle speed, scale, or structure. For BI professionals, the opportunity is twofold. You protect your relevance by learning features that extend beyond the visuals, and you expand your influence by showing leadership how Fabric closes the gap between reports and strategy. The shift is real, but it doesn’t require mastering every engineering detail. It starts with small, real experiments that make the difference visible. That’s why Fabric shouldn’t be thought of as an option tacked onto Power BI—it’s the table that Power BI now sits on. If you frame it that way, the path forward is clearer: don’t retreat from the new environment, test it. The good news is you don’t need enterprise IT approval to begin that test. Next comes the practical question: how do you actually get access to Fabric for yourself? Because the first roadblock isn’t understanding the concepts—it’s just getting into the system in the first place.
Getting Your Hands Dirty: Provisioning a Fabric Tenant
Provisioning a Fabric tenant is where the shift becomes real. For many BI pros, the idea of setting one up sounds like a slow IT request, but in practice it’s often much faster than expected. You don’t need weeks of approvals, and you don’t need to be an admin buried in Azure settings. The process is designed so that individual professionals can get hands-on without waiting in line. We’ve all seen how projects stall when a new environment request gets buried in approvals. A team wants a sandbox, leadership signs off, and then nothing happens for weeks. By the time the environment shows up, curiosity is gone and the momentum is dead. That’s exactly what Fabric is trying to avoid. Provisioning puts you in charge of starting your own test environment, so you don’t have to sit on the sidelines waiting for IT to sign off. Here’s the key point: most people find they can spin up a personal Fabric tenant faster than they assumed—often in the same day. Think of it less as a technical build-out and more like filling out a sign-up form. Microsoft offers developer tenants specifically for Fabric, and while trial details can differ by account or region, many report being able to register quickly. Before you dive in, always check Microsoft’s current enrollment documentation to verify trial terms—especially the exact length of trial access, since that can change. So what does “provisioning” look like here? It isn’t hardware. It isn’t finding budget for servers. It’s simply setting up a space under your login with three key components: First, you get the organizational shell—the container where your Fabric services live. Second, you have identity control—it’s tied to your sign-in, so you’re in charge of access. And third, you get sandboxed resources—an environment to test everything Fabric promises without risking production data. Think of it as pressing a button and watching your own lab environment appear. A simple way to picture it is with a small story. You sit down curious about Fabric but assume it’s going to be complicated. Instead of endless documentation and IT back-and-forth, you walk through a short form, select a Fabric tenant option, and within the same coffee break you’re exploring a clean workspace. The barrier you expected isn’t there, and you’re already testing a pipeline or seeing how DirectLake might behave. That moment turns Fabric from abstract to hands-on very quickly. One caution to keep in mind: trials come with names that sound alike. You might see options for a Power BI Premium Per User trial or a Fabric developer tenant trial. Watch closely. The first affects premium reporting features; the second is what gives you access to the broader Fabric ecosystem. Always review what trial you’re activating so you don’t wonder later why your screen looks different from the demos. This is an easy place to mix things up, so confirm the scope of your trial against the documentation for your specific tenant. Once the signup is squared away, what you end up with is a safe playground. It’s outside your company’s production environment, so mistakes don’t hurt anyone. You can create a pipeline, test a warehouse, or connect a dataset without waiting for permissions. For BI pros used to being gated by IT processes, that’s a big inversion. Suddenly you own the pace of your learning. Here’s a quick challenge you can try once you’ve signed up: give yourself 15 minutes, create a single pipeline or dataset, and just see what happens. It’s a low-stakes way to move from theory into action. You’re not aiming to master Fabric in one sitting—you’re just proving to yourself that this environment is open and ready. The act of building even one object shifts your perspective. What makes this valuable isn’t just speed; it’s the freedom to test and explore without risking production. Nobody is waiting for approvals, nobody’s worried about governance policies being broken, and nobody’s blocked from trying ideas. For the first time, BI pros can approach Fabric with the same curiosity developers bring into new environments. And that hands-on approach accelerates learning far faster than reading feature lists ever could. From here, the natural question is obvious: once you’ve got this sandbox, what should you build that will actually show Fabric’s differences? The answer sits at the foundation of everything Fabric does. It starts with the way your data is stored and shared, and that’s where the idea of OneLake comes in.
OneLake and Beyond: Engineering Your Own Data
When you first start working inside Fabric, one of the most immediate shifts you’ll notice is how the platform approaches storage. This is where OneLake enters the picture. It’s designed to serve as a single storage layer for data across Fabric, reducing the scattering of sources that most BI professionals have had to manage piecemeal for years. Instead of juggling SQL here, SharePoint there, and half a dozen Excel files acting as “sources of truth,” every component of Fabric points back to the same foundation. You can think of OneLake as the connective layer that makes Fabric feel cohesive. If Power BI represents your reporting canvas and Data Factory provides the pipeline tooling, OneLake is where they converge. Without a shared layer, you’d still be stuck with multiple silos, each demanding its own refresh and upkeep. With it, the reporting, engineering, and storage pieces line up around the same data objects. It isn’t something you toggle on and off—it’s the storage model Fabric is set up to use. That design choice is what makes learning its role so important early on. For anyone who’s lived deep in the traditional Power BI workflow, the difference is easy to recognize. Normally, you construct reports against whatever connections IT makes available and spend your days policing gateway errors or mismatched refresh schedules. You’ve probably seen the chaos of multiple “final_v2.xlsx” files drifting through Teams folders while departments argue over who’s right. That fragmented approach may get you through when teams are small, but it collapses at scale, especially when executives expect clean and aligned numbers. OneLake shifts that balance by letting everyone operate against the same shared storage location, where duplication is minimized and disagreements over timing start to disappear. A good way to picture it is by drawing on Microsoft’s own playbook. OneDrive consolidated scattered file shares into one cloud surface—people edit and share a file directly, instead of emailing copies around. OneLake applies the same principle to datasets. Instead of making multiple extracted versions of the same transaction table, teams query the same underlying object. The net benefit is as simple as it is practical: fewer copies drifting around and far better alignment across teams. Take a basic scenario: finance analyzing P&L reports while operations reviews sales performance. In a traditional setup, the two departments could be looking at different refresh cycles, reporting lags, or even different extracts of the same database. The result? Discrepancies in numbers at the worst time—midway through a meeting. With OneLake, both point at the same object, reducing that misalignment. Different views, yes, but anchored to the same data foundation. That shift doesn’t just simplify reporting—it reshapes your role. Before, BI teams were consumers at the edge of IT-managed pipelines. You pulled what you were given and hoped it was current. With Fabric’s shared lake, you’re now on the same footing as the engineers who set up the flows. Instead of requesting data prep, you gain access to objects in a way that cuts down on waiting and rework. While governance still matters, the wall between “engineers who control” and “BI pros who consume” isn’t as rigid as it used to be. Another feature here is DirectLake. Instead of relying on scheduled refresh cycles to load snapshots into your models, reports can connect straight into OneLake for queries. The promise is that you minimize the lag between source activity and reporting availability. Many users describe this as reducing their need for scheduled refresh in significant ways—but behavior varies depending on environment and data structure. If you’re testing this in your own sandbox, verify how it behaves with your datasets. For some workloads, it may transform how often you touch refresh at all. Here’s a small, actionable way to explore this for yourself: once you’ve provisioned a Fabric trial or developer tenant, connect a Power BI report to a dataset stored in OneLake. Pay attention to whether refresh management changes compared to your usual model. Does the report update more seamlessly? Is there less overhead in scheduling? Treat it as an experiment. The goal isn’t to master the entire system on day one—it’s to see firsthand what’s different about working off a shared layer rather than a patched-on extract. What becomes clear from this pattern is that Fabric alters the normal division of labor. BI professionals now have a direct line into the storage environment, which used to sit squarely on the IT side. That visibility brings responsibility but also influence. You’re not just making pages of visuals—you’re operating in the same environment that handles raw ingestion and transformation. The overlap of roles creates opportunities for you to step into strategy conversations that might have been off-limits before. Summing it up: OneLake isn’t another optional feature. It’s the foundation Fabric is built to run on, and understanding how it changes the way data is stored is essential for seeing how BI roles evolve. It reduces reliance on copies, cuts down refresh headaches, and brings teams onto the same page by anchoring everything to a single, shared layer. But storage alignment only goes so far. Some decisions can’t wait for the next dataset to be updated, even if refresh cycles are gone. The next challenge is dealing with events as they happen—and that’s where Fabric takes BI professionals into a space many haven’t touched before.
Real-Time Thinking with KQL Databases
Dashboards that wait around for refresh schedules feel outdated. The expectation now is that data should be visible as it happens, not hours later. This is exactly where real-time analytics meets Fabric, and where KQL databases take center stage. KQL, short for Kusto Query Language, has been part of Microsoft’s ecosystem for some time. It has powered several services in Azure (note: confirm exact list of services like Azure Data Explorer and Log Analytics against Microsoft documentation before recording). What matters here is that BI professionals can now use KQL databases directly inside Fabric, not just watch from the sidelines. Instead of working with datasets frozen until the next refresh, you can connect dashboards to event streams and run queries as those events arrive. For BI pros, this changes Power BI from being a look-back mirror into something closer to a live operational tool. If you already know SQL, KQL won’t feel completely foreign. Many describe it as approachable for SQL users, though it’s optimized for streams and telemetry rather than static tables (verify this point against product documentation). The mindset shift is important: instead of importing rows, shaping them, and waiting for the next scheduled pull, you’re watching data flow in and querying it as it lands. That change takes dashboards out of “recap mode” and into “action mode.” Here’s a simplified example. Imagine a support center running on daily CRM extracts. Yesterday’s call volume, ticket backlog, and resolution times appear on screens the following morning. Useful, but too late to stop a service slip in real time. With a KQL database sending new tickets straight to a report, managers see the spikes as they form. Backlogs don’t sit unseen until tomorrow—they’re visible mid-shift, giving leaders a chance to reassign staff or respond right away. Seeing tickets as they come in lets managers intervene immediately, and that’s the direct benefit you can’t get from a refresh cycle. This isn’t just about call centers. Many industries already expect data to refresh continuously. Retail operations monitor sales by location minute by minute and adjust staffing on the fly. Financial services screen transactions the second they occur to cut fraud losses. Logistics companies don’t just batch delivery updates—they track GPS signals streaming in all day. None of these scenarios can run on nightly refreshes. They rely on systems tuned for streams, and KQL brings that capability inside the Microsoft stack BI pros already know. The good news is you don’t need to be a developer to start here. Many find KQL straightforward if they’re familiar with SQL—expect a learning curve, but not a wall. The payoff is significant: moving from reporting on history to influencing live operations. And that move matters inside organizations. If your dashboards help leadership react before a problem escalates, you’re no longer the person wrapping things up after the fact. You become someone steering actions while they still matter. This shift also breaks down old boundaries. In the past, BI professionals stuck to visuals and let developers or IT teams handle streaming feeds. With KQL available inside Fabric, those lines blur. You’re no longer locked out of event-driven datasets. You can build dashboards tied to streams yourself, owning the models that inform operational decisions. That expansion of scope changes how your role is perceived—and in many cases, how central you are to outcomes. So what’s a low-barrier way to try this? If you’ve set up a Fabric tenant, see if your environment lets you run a basic KQL query against an event stream. Even something small, like querying a sample log or telemetry feed, will show you how results update in real time. Treat it as an experiment, not a guarantee that every tenant tier or trial includes KQL. The takeaway is whether you experience how different it feels to watch data update continuously rather than wait for a scheduled push. For BI professionals, that moment changes what “building a dashboard” means. It’s no longer a static artifact that lags behind operations—it’s a live surface where decisions happen. Leaning into KQL broadens your toolkit, but more importantly, it shifts you into the stream of operational analytics where the business is already moving. This isn’t theory; it’s a structural change in how reporting fits inside organizations. And as these changes accumulate—from shared storage layers like OneLake to streaming queries in KQL—the old definition of Power BI work starts to look too narrow. The larger message is clear: relying on yesterday’s playbook won’t cover tomorrow’s demands.
Conclusion
In many organizations, Power BI alone is starting to feel insufficient for the kind of operational analytics leaders expect. Fabric expands those options by pulling BI work into the full data pipeline, from storage to real-time feeds. The opportunity for BI pros is to step into that wider environment instead of staying at the reporting edge. If you want a practical path forward: assess where your own workflow gaps are, set up a sandbox tenant, and try one small experiment—maybe creating a dataset in OneLake or running a basic KQL query. Then, share in the comments which part of Fabric feels most challenging for you: provisioning, OneLake, or KQL. If this video gave you a clearer view of how your role can grow beyond dashboards, consider liking and subscribing. It helps the channel reach more BI professionals rethinking their skills for what comes next.
This is a public episode. If you'd like to discuss this with other subscribers or get access to bonus episodes, visit m365.show/subscribe

Founder of m365.fm, m365.show and m365con.net
Mirko Peters is a Microsoft 365 expert, content creator, and founder of m365.fm, a platform dedicated to sharing practical insights on modern workplace technologies. His work focuses on Microsoft 365 governance, security, collaboration, and real-world implementation strategies.
Through his podcast and written content, Mirko provides hands-on guidance for IT professionals, architects, and business leaders navigating the complexities of Microsoft 365. He is known for translating complex topics into clear, actionable advice, often highlighting common mistakes and overlooked risks in real-world environments.
With a strong emphasis on community contribution and knowledge sharing, Mirko is actively building a platform that connects experts, shares experiences, and helps organizations get the most out of their Microsoft 365 investments.