


In the evolving world of Microsoft Fabric, the Digital Twin Builder preview emerges like a quiet shift that changes everything without announcing itself loudly. You start by taking the world you already know—machines, rooms, sensors, movements, transactions—and giving it a second life inside the Fabric environment. This second life isn’t static or symbolic; it breathes with real-time data, always adjusting, always reflecting what’s happening right now. Data from sensors, logs, or operational systems flows into the Fabric lakehouse, and the builder reshapes it into a digital form that mirrors the physical world. The semantic canvas becomes the place where these connections come alive, letting you see how everything relates, how one action affects another, and how the digital counterpart shifts as the real world does. You wire event streams into the model, and suddenly the quiet digital structure begins to pulse with updates—temperature changes, equipment activity, stock movement, environmental readings—whatever the system needs to understand itself. Power BI ties into this digital twin with its own language of charts and visuals, turning raw signals into insights you can feel and respond to. Problems show themselves before they happen, patterns emerge where there was only noise, and maintenance becomes a prediction instead of a reaction. Even though the tool is in preview, there’s already a sense that this is where operations are headed: more connected, more aware, more immediate. With documentation, examples, and community support, the foundation is already in place, and the path forward looks like deeper AI integration, smoother modeling, and richer connections to every kind of data source Fabric can touch. In the end, the Digital Twin Builder becomes a quiet partner—observing, learning, and helping you understand your world by recreating it in real time.


You face tough challenges in managing data from machines, sensors, and different systems. Microsoft Fabric Digital Twin gives you a smarter way to bridge physical and digital worlds. You gain real-time intelligence and actionable insights with low code or no code tools.
Here is a look at common data management challenges:
| Challenge Type | Description |
|---|---|
| Unified Data Representation | The need for a cohesive way to represent data across different systems and sources. |
| Real-Time Insights | The requirement for immediate access to data insights for timely decision-making. |
| Integration of Diverse Data Sources | The challenge of harmonizing various data inputs into a single, coherent framework. |
Key Takeaways
- Microsoft Fabric Digital Twin bridges physical and digital worlds, providing real-time intelligence for better decision-making.
- Digital twins allow you to run simulations and optimize processes, helping you make informed choices based on accurate data.
- The low code/no code features of Digital Twin Builder make it accessible for everyone, enabling easy modeling of assets and processes.
- Real-time data sync keeps your operations updated, allowing you to respond quickly to changes and reduce downtime.
- Integrating Power BI with Digital Twin Builder transforms complex data into clear visuals, enhancing collaboration and insight sharing.
- Using digital twins helps break down data silos, creating a single source of truth that improves communication across teams.
- Predictive analytics in digital twins allows you to anticipate issues before they arise, minimizing risks and optimizing outcomes.
- Establishing strong data management practices and promoting user adoption are key to maximizing the benefits of Digital Twin Builder.
9 Surprising Facts about Digital Twin Builder in Microsoft Fabric
- Low‑code visual modeling: The Builder provides a drag‑and‑drop canvas to create complex twin models and relationships without writing DTDL by hand, accelerating model design for non‑developers.
- Auto‑generate models from data: It can infer entity types and relationships from existing telemetry or tabular data sources to bootstrap a twin graph automatically.
- Direct Lakehouse integration: Twins built in Fabric connect natively to the Fabric Lakehouse, enabling seamless access to raw telemetry, enriched features, and single‑store analytics.
- Kusto (KQL) queryability: Digital Twin graphs are queryable using Kusto Query Language inside Fabric, letting analysts run familiar, powerful queries against live twins and historical time series.
- Built‑in templates and industry accelerators: The Builder ships with predefined templates (assets, sensors, facilities) and accelerators that speed up common industry scenarios such as manufacturing and smart buildings.
- Exportable standard definitions: Models created visually can be exported as standard definitions (JSON/DTDL), supporting interoperability and reuse across tools and environments.
- Relationship‑first topology design: The interface emphasizes relationships and topology (not just properties), making it easier to model complex networks like supply chains or multi‑floor facilities.
- Security and governance via Fabric identities: Access, roles, and governance for twins leverage Fabric’s identity and workspace controls so enterprise policies apply consistently to twin artifacts and data.
- Built for operational analytics and automation: Beyond visualization, the Builder is designed to feed operational analytics, automation, and real‑time alerts—making it practical to go from model to action inside the Fabric ecosystem.
What is Microsoft Fabric Digital Twin?

Digital Twin Definition
You can think of a digital twin as a dynamic software model that mirrors real-world environments and processes. In enterprise data management, a digital twin represents your organization and its operations. This model uses real-time data to reflect the current state of your systems. You gain the ability to run simulations and test different scenarios. Digital twins help you optimize processes and make better decisions. They connect various system-level twins, giving you a complete view of your business activities. You can monitor, analyze, and improve operations with this technology.
- Digital twins let you:
- Run simulations to test processes.
- Use real-time data for accurate representations.
- Generate insights to optimize your organization.
A digital twin provides a holistic view by integrating data from different departments. You can track performance and support leadership in making strategic decisions.
Microsoft Fabric Integration
Microsoft fabric digital twin builder fits seamlessly into the Microsoft Fabric ecosystem. You use this tool to create digital twins of assets, processes, and relationships. The builder organizes information using namespaces, entity types, and properties. You map real-world objects to digital models, making your data easy to manage and understand.
| Component | Description |
|---|---|
| Namespace | Groups entity types, properties, and relationships for clear organization. |
| Entity type | Defines concepts like equipment or processes. |
| Entity instance | Represents specific objects, such as a particular machine. |
| Property | Adds details, like temperature or status, to each entity. |
| Relationship type | Shows how entities connect, such as dependencies or interactions. |
| Relationship instance | Tracks specific links, like one machine being part of another. |
You use microsoft fabric digital twin builder to create a digital representation that updates in real time. This integration makes your data more accessible and actionable.
Real-World Applications
Microsoft fabric digital twin technology has transformed many industries. You see its impact in aerospace, automotive, retail, and architecture. In aerospace, you predict issues in airframes and engines before they happen. Automotive companies use digital twins to develop connected vehicles and improve safety. Retailers model customer behavior to enhance experiences. Architects visualize designs and support building lifecycles.
- Predictive maintenance and diagnostics help you anticipate equipment needs.
- Simulations decrease time to market by identifying problems early.
- Streamlining product development reduces costs and environmental impact.
Microsoft fabric digital twin lets you harness real-time data for smarter decisions. You can optimize operations, reduce downtime, and improve efficiency across different sectors.
Key Features of Digital Twin Builder
Real-Time Data Sync
You need immediate access to accurate information to make smart decisions. Digital twin builder in microsoft fabric gives you real-time data sync, so you always see the latest state of your operations. This feature helps you respond quickly to changes and keeps your team on the same page.
Continuous Updates
Digital twin builder connects to your data sources and updates your digital twin as soon as new information arrives. You see live changes from machines, sensors, and systems. This continuous flow of data means you can monitor site conditions and project progress without delay. You get immediate insights that help you solve problems before they grow.
- You track machinery states in real-time.
- You spot issues early and act fast.
- You reduce downtime and improve safety.
Data Silos Reduction
Many organizations struggle with data trapped in separate systems. Digital twin builder breaks down these silos by bringing all your data together in one place. You get a single, reliable source of truth for your operations. This unified view improves cooperation and communication across teams. You avoid errors and delays that come from outdated or missing information.
Tip: Use digital twin builder to streamline workflows and maintain continuity throughout your project lifecycle.
Low Code/No Code Modeling
You do not need to be a developer to use digital twin builder. Microsoft fabric designed this tool with low code and no code features, so you can build and manage digital twins with simple drag-and-drop actions. This approach makes digital twin technology accessible to everyone in your organization.
Business Concept Mapping
You can map your business concepts directly into the digital twin builder. Define assets, processes, and relationships using familiar terms. This mapping helps you organize your data in a way that matches your real-world operations. You create models that reflect how your business works, making it easier to analyze and improve.
- Map equipment, rooms, or workflows as entities.
- Link them with relationships that show how things connect.
- Add properties like temperature, status, or location.
Ease of Use
Digital twin builder focuses on simplicity. You use visual tools to create and update your digital twin without writing code. This ease of use speeds up adoption and lets more people contribute to data management. You can quickly adjust models as your needs change, keeping your digital twin accurate and useful.
Note: Low code and no code modeling in microsoft fabric helps you save time and resources while building powerful digital twins.
Semantic Relationships
Understanding how assets and processes connect is key to smart data management. Digital twin builder in microsoft fabric lets you define semantic relationships that mirror your real-world environment. You gain deeper insights by modeling these connections.
Asset Mapping
You use digital twin builder to map assets like machines, buildings, or vehicles. Each asset becomes a digital entity with its own properties and status. You can track performance, monitor health, and plan maintenance using real-time data. This mapping supports predictive analytics and helps you optimize asset usage.
Process Modeling
You can model complex processes by linking assets and actions in digital twin builder. Define workflows, dependencies, and interactions to see how everything fits together. This process modeling gives you a clear picture of your operations. You spot bottlenecks, improve efficiency, and make better decisions with the help of ai-powered insights.
- Visualize process flows and dependencies.
- Identify areas for improvement.
- Use ai to predict outcomes and recommend actions.
Callout: Semantic relationships in microsoft fabric digital twin builder unlock new levels of understanding and control for your organization.
Power BI Integration
You can unlock the full potential of your digital twin builder by connecting it with Power BI. This integration gives you the power to visualize complex operations and gain real-time insights. You see your digital twin come alive through interactive dashboards that update as your data changes. Microsoft fabric makes it easy to turn raw information into clear, actionable visuals.
Interactive Dashboards
You use Power BI to create dashboards that display the current state of your digital twin. These dashboards help you track assets, monitor performance, and spot trends. You can run simulations and test different scenarios before making decisions. This approach helps you avoid costly mistakes and improve your management strategies.
| Benefit | Description |
|---|---|
| Advanced Simulation | Run 'what-if' scenarios to assess impacts of decisions before implementation. |
| Improved Efficiency and ROI | Enhance capital and operational efficiency by 20% to 30%, minimizing disruptions and costs. |
| Operational Optimization | Identify bottlenecks and streamline operations, leading to significant cost reductions. |
| Visualize BIM Dimensions | Connect models to analyze 4D (time) and 5D (cost) data for better tracking of schedules and budgets. |
| Integrate with ERP Data | Link design and construction data with financials for a holistic view. |
| Centralize Information | Create a single source of truth for all stakeholders, breaking down data silos. |
| Build a Historical Record | Capture data for future forecasting and optimization, improving project tracking. |
You can use these dashboards to share information with your team. Everyone stays informed and can make decisions based on the same real-time data. This transparency supports better collaboration and faster problem-solving.
Actionable Insights
You gain more than just visuals with Power BI integration. You receive insights that help you act quickly and confidently. Microsoft fabric uses AI and predictive analytics to highlight trends and suggest next steps. You can spot issues before they become problems and take action to keep your operations running smoothly.
Tip: Use Power BI with digital twin builder to turn complex data into clear, actionable insights. This combination helps you make smarter decisions every day.
Scalability and Security
You need a solution that grows with your business and keeps your information safe. Microsoft fabric digital twin builder delivers enterprise-grade management and strong security features. You can trust that your digital twin will perform well, even as your operations expand.
Enterprise-Grade Management
You manage digital twins at scale with Microsoft fabric. The platform supports large numbers of assets and data sources without slowing down. You can add new models, connect more systems, and handle increased workloads as your needs change. Microsoft fabric ensures that your digital twin builder remains reliable and responsive.
You also benefit from centralized management tools. These tools help you monitor performance, track changes, and maintain consistency across your digital twin environment. You save time and reduce errors by using a single platform for all your digital twin needs.
Compliance Support
You protect sensitive information with advanced security features built into Microsoft fabric digital twin builder. The platform uses role-based access control, so only authorized users can view or change data. Fine-grained data partitioning lets you share insights with the right people while keeping other information private.
| Security Feature | Description |
|---|---|
| Role-Based Access Control | Stakeholders only see data they are authorized to access, protecting proprietary information. |
| Fine-Grained Data Partitioning | Selective exposure of insights relevant to each participant's operational role. |
| Immutable Data Lineage | Maintains a traceable record of data origins, crucial for audits and compliance. |
| Containerized Deployments | Ensures consistent behavior across different environments, enhancing security and integrity. |
| Compliance with DOE Standards | Supports confidentiality and availability controls to protect sensitive data across cloud infrastructures. |
You can also track the origin and flow of your data with immutable data lineage. This feature is important for audits and regulatory compliance. Microsoft fabric supports containerized deployments, so your digital twin builder works securely in any environment. You meet industry standards and keep your operations protected.
Note: Microsoft fabric digital twin builder gives you the confidence to scale your digital twin projects while maintaining strong security and compliance.
Microsoft Fabric Real-Time Intelligence
Microsoft fabric real-time intelligence gives you the power to make faster and smarter decisions. You see what is happening in your operations as it unfolds. This technology brings together data from many sources and uses AI to turn it into actionable real-time insights. You can spot problems early, respond quickly, and keep your business running smoothly.
Real-Time Analytics
You use real-time analytics in digital twin builder to create virtual models of your physical assets and processes. These models track state changes and simulate behavior as new data arrives. You can monitor machines, buildings, or supply chains and see updates instantly. This helps you test scenarios, optimize processes, and improve operational efficiency.
- Microsoft fabric real-time intelligence centralizes your data in OneLake, removing silos.
- You get a single source of truth for your team.
- CXOs and managers access AI-driven insights in real time, which means quicker actions and better results.
- You transform raw data into clear visuals and reports, supporting every step from intake to visualization.
Tip: Use real-time insights to stay ahead of challenges and make decisions with confidence.
Predictive Insights
With predictive analytics, you do more than react to problems—you anticipate them. Digital twin builder lets you monitor assets and spot unusual patterns before they become failures. For example, telecom providers use digital twins to predict fiber degradation. This reduces unplanned outages and keeps services reliable.
- You detect anomalies that might go unnoticed with manual checks.
- You simulate capacity needs and adjust resources before launching new projects.
- Microsoft fabric real-time intelligence helps you minimize risks and optimize outcomes.
Callout: Predictive insights give you the edge to solve issues before they impact your business.
Operational Optimization
You can see the impact of microsoft fabric real-time intelligence across many industries. Digital twin builder supports manufacturing, energy, transportation, and retail. Each sector uses digital twins to boost performance and cut costs.
| Industry | Example of Optimization |
|---|---|
| Manufacturing & IoT | Digital representations of machines and lines reduce downtimes and improve quality. |
| Energy & Utilities | Digital twins of power grids enhance efficiency and compliance. |
| Transportation & Logistics | Rail operators use digital twin builder for precise fuel consumption predictions. |
| Consumer Goods & Retail | Digital twins help monitor inventory and reduce costs in supply chains. |
You use machine learning models to predict failures and improve product quality. Microsoft fabric real-time intelligence empowers you to act on actionable real-time insights, making your operations smarter and more competitive.
Impact on Data Management

Efficiency Gains
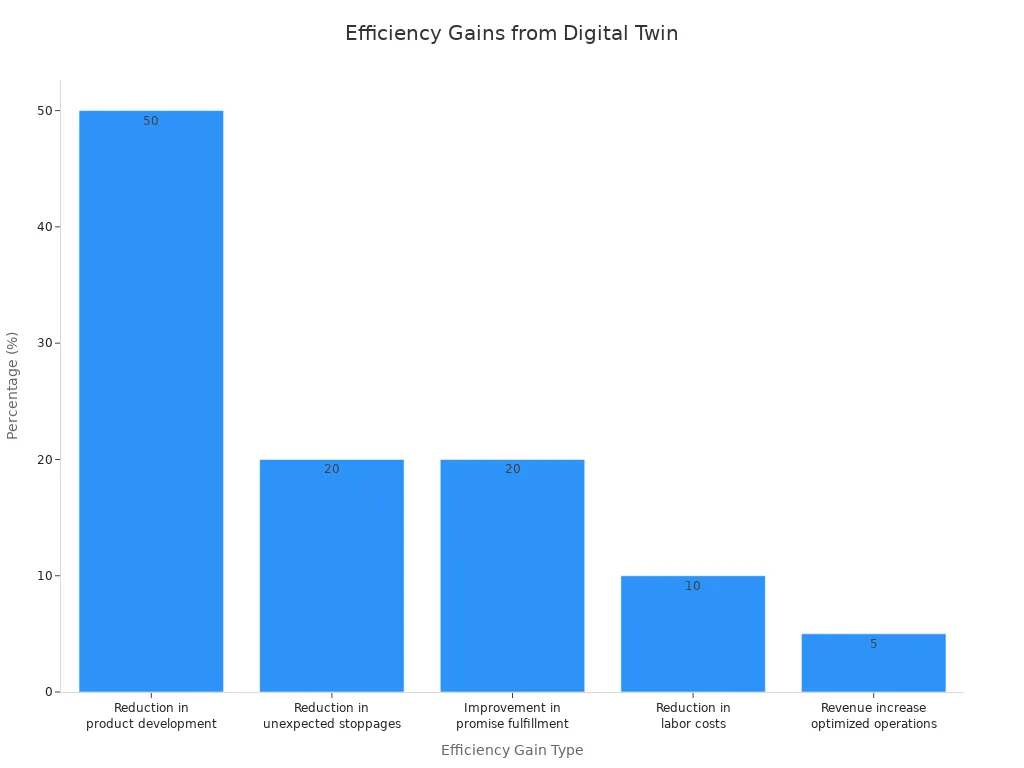
You see measurable improvements in efficiency when you use Digital Twin Builder for data management. Many organizations report faster project timelines and lower costs. You can track these gains in several ways. For example, you reduce project timelines by up to 20%. You save millions of dollars on single projects through better resource allocation. You also decrease design errors and safety incidents, which leads to smoother operations.
| Efficiency Gain Type | Percentage/Value |
|---|---|
| Reduction in project timelines | 10-20% |
| Cost reduction on a single project | $3 million |
| Cost savings through better resource allocation | 5-30% |
| Reduction in design errors | 32% |
| Enhancement in design cooperation | 27% |
| Decrease in safety incidents | 15-25% |
You also see improvements in product development times and labor costs. Digital Twin Builder helps you avoid unexpected work stoppages and boosts your ability to fulfill consumer promises. Optimized operations can increase revenue by 5%. The chart below shows how these efficiency gains add up across different areas.
Data Accuracy
You improve data accuracy by using Digital Twin Builder. Real-time data collection ensures your models stay current and reliable. You update your digital twin regularly, which reduces discrepancies between the digital and physical environments. Machine learning techniques, such as rolling learning, refine your models with each new data point. You focus on detecting sensor defects and maintaining high data quality. This approach gives you confidence in your data management and supports better decision-making.
| Aspect | Description |
|---|---|
| Real-time Data Collection | Digital twins utilize real-time data from physical entities to ensure models are up-to-date and accurate. |
| Model Updating | Regular updates to the twin model reduce discrepancies between the digital and physical entities. |
| Machine Learning Integration | Techniques like rolling learning help in continuously refining model parameters with real-time data. |
| Data Reliability | Focus on detecting sensor defects and ensuring data quality enhances the overall accuracy of models. |
Tip: You gain a competitive advantage when you trust your data and act on accurate information.
Unified Data Views
You benefit from unified data views when you use Digital Twin Builder. You aggregate structured, semi-structured, and unstructured data from multiple data sources. This aggregation creates a single source of truth for your organization. You ensure consistency and reliability in your asset and product master data. Disciplined data management leads to strong business outcomes. You connect diverse data sources flexibly, which gives you a holistic view of your business.
| Advantage | Description |
|---|---|
| Data Aggregation | Digital twins combine structured, semi-structured, and unstructured data from various sources. |
| Single Source of Truth | Unified asset and product master data ensures consistency and reliability in data management. |
| Reliable and Governed Data | Successful implementations rely on disciplined data management for strong business outcomes. |
| Holistic Business View | Flexibility in connecting diverse data sources provides a comprehensive view of the business. |
Note: Unified data views help you make informed decisions and support collaboration across teams.
Enhanced Decision-Making
You make better decisions when you have clear, up-to-date information. Digital Twin Builder gives you a transparent path from planning to action. You see how your choices affect your business in real time. This tool connects your strategy with daily operations, so you can move quickly from ideas to results.
You can use Digital Twin Builder to test different plans before you act. You change business rules and see the impact right away. This helps you avoid mistakes and find the best way forward. You do not need to wait for reports or guess what might happen. Instead, you use live data and smart models to guide your next steps.
Here are some ways Digital Twin Builder improves your decision-making process:
- You create a clear link between your goals and your actions. This makes it easier to track progress and adjust your plans.
- You adjust key business levers, such as production rates or resource allocation, and see instant feedback on outcomes.
- You use real-time communication across your organization. This means everyone stays informed and can respond to changes quickly.
- You automate routine decisions, freeing up time for you to focus on bigger challenges.
- You spot trends and risks early, so you can act before small issues become big problems.
Tip: Use Digital Twin Builder to bring together data from across your business. This unified view helps you make choices based on facts, not guesses.
You also benefit from the integration of digital twins into a Distributed Intelligence System. This setup lets your systems talk to each other and share insights. You get intelligent responses to new business conditions. For example, if a machine shows signs of wear, the system can alert you and suggest maintenance before a breakdown happens.
You gain confidence in your decisions because you rely on accurate, real-time information. You see the whole picture, not just a snapshot. This approach leads to better outcomes for your business and helps you stay ahead of the competition.
Digital Twin vs. Traditional Data Management
Manual vs. Automated
Traditional data management often relies on manual processes. You might enter data into spreadsheets, update records by hand, or move files between systems. These steps take time and can lead to mistakes. When you use Digital Twin Builder, you automate many of these tasks. The system collects data from machines, sensors, and other sources in real time. You see updates instantly, so you do not have to wait for someone to input new information. Automation helps you catch problems early and respond faster. You spend less time on routine work and more time making decisions that matter.
Tip: Automation reduces errors and frees up your team to focus on higher-value tasks.
Fragmented vs. Unified Systems
Many organizations struggle with fragmented data. You might have different teams using separate systems or spreadsheets. This makes it hard to get a clear picture of your operations. Digital Twin Builder brings all your data together in one place. You create a unified model that connects information from across your business.
- SPI, a major real estate company, used Digital Twin Builder to combine property data from many offices. Before, each office kept its own records, which caused confusion and wasted time.
- With Digital Twin Builder, SPI integrated all their data into a single model. Now, they get near real-time insights for every property.
- You can use the same approach to break down silos and improve teamwork.
Digital Twin Builder uses a direct-on-lake, ontology-first model. This means you can add new data sources easily, without writing custom code. You use a visual canvas to define how your data connects. Even if you have unstructured data, you can map it into a clear digital twin. This lets you build dashboards and run predictive analytics, so you always know what is happening in your business.
Note: Unified systems help you make better decisions and avoid the confusion of scattered data.
ROI and Business Value
When you invest in Digital Twin Builder, you see real business value. The technology helps you save time, reduce costs, and improve productivity. Many companies report strong returns after their first major project.
| Evidence Type | Details |
|---|---|
| Market Growth | The digital twin technology market in construction is projected to grow from $2.0 billion to over $93 billion by 2029. |
| Initial Investment | The typical initial investment ranges from $275,000 to $750,000, with companies reporting justifiable returns within the first major project. |
| Schedule Compression | Digital twins can reduce project duration by 8–15%, translating to significant time and cost savings on large projects. |
| Rework Reduction | Digital twins can reduce rework costs by 60–80%, leading to substantial savings on project budgets. |
| Material Waste Elimination | Accurate takeoffs can reduce material waste by 10–20%, resulting in savings of $200,000 to $500,000 on major projects. |
| Labor Productivity Gains | Labor productivity can improve by 15–25%, enhancing overall project profitability. |
You gain more than just cost savings. Digital Twin Builder helps you finish projects faster, reduce waste, and boost your team’s productivity. You also get a tool that grows with your business and supports smarter, data-driven decisions.
Callout: Digital Twin Builder turns your data into a valuable asset, helping you achieve better results with less effort.
Getting Started with Microsoft Fabric
Readiness Assessment
You should start your journey with Microsoft Fabric by checking your organization's readiness. Begin by reviewing your current data landscape. List all the systems, sensors, and machines that produce data. Identify gaps in your data collection. Make sure your team understands the goals of a data-driven approach. You need to know if your staff has the skills to use Digital Twin Builder. If not, plan for training. Assess your IT infrastructure to confirm it can support real-time data flows. Strong network connections and secure cloud access are important for success.
Tip: Involve key stakeholders early. Their support helps you overcome challenges and speeds up adoption.
Implementation Steps
You can follow a clear path to set up Digital Twin Builder. Start by defining your business objectives. Decide what you want to achieve with digital twins. Next, select the assets or processes you want to model. Gather data from these sources and check its quality. Clean and organize your data before you begin data integration. Set up your Microsoft Fabric environment and connect your data sources. Use the low code tools to build your first digital twin model. Test the model with real data. Adjust your setup based on feedback from users. Roll out the solution to more teams or departments as you gain experience.
- Define goals and select assets.
- Prepare and clean your data.
- Set up your environment and connect sources.
- Build and test your digital twin.
- Expand usage across your organization.
Note: Start small and scale up. Early wins build confidence and show the value of a data-driven strategy.
Integration Tips
You want your Digital Twin Builder to work smoothly with your existing systems. Good integration ensures you get the most from your data-driven efforts. Focus on these key areas:
| Tip | Description |
|---|---|
| Data Quality | Set clear standards for accuracy, completeness, and timeliness. Monitor your data often to catch and fix problems quickly. |
| Integration Architecture | Use publish/subscribe patterns and protocols like DDS, MQTT, or AMQP. RESTful or GraphQL APIs help keep your systems in sync. |
| Governance Framework | Create rules for decision-making and data ownership. Involve stakeholders to manage your digital twin project well. |
| Adherence to Standards | Follow industry standards for security and data management. This helps your systems work together and keeps your data safe. |
You should always check that your data integration methods support your business needs. High-quality data and strong governance lead to better results. When you follow best practices, you build a solid foundation for your data-driven future.
Callout: Good integration practices help you unlock the full power of Microsoft Fabric and support smarter, data-driven decisions.
Best Practices
You can maximize the value of Digital Twin Builder by following a set of proven best practices. These steps help you get the most from your data and ensure your digital twin projects succeed.
Establish Strong Data Management and Quality Protocols
Start by setting up clear rules for how you collect, store, and use data. Use advanced analytics tools to check your data for errors or gaps. Clean and organize your data before you build your digital twins. High-quality data leads to accurate models and better decisions.Promote User Adoption and Change Management
Involve key stakeholders early in your project. Explain the benefits of Digital Twin Builder to your team. Offer training sessions and hands-on workshops. Encourage feedback and address concerns quickly. When everyone understands the value, you see faster adoption and less resistance to new technology.Practice Continuous Optimization and Iteration
Review the insights you gain from your digital twins regularly. Use this information to improve your real-world processes. Update your models as your business changes. Test new ideas and measure their impact. This cycle of learning and improvement keeps your operations efficient and competitive.
Tip: Make best practices part of your daily routine. Regular reviews and open communication help you spot issues early and keep your digital twin projects on track.
Community and Support
You have access to a wide range of community resources and support channels when you use Microsoft Fabric Digital Twin Builder. These resources help you learn, solve problems, and connect with other users.
| Resource Type | Description |
|---|---|
| Forums | Join discussions on Power BI, Data Engineering, Data Warehouse, Data Science, and more. |
| Inspiration | Explore contests and galleries to share and discover new ideas and projects. |
| Ideas | Submit your suggestions and view the Microsoft Fabric roadmap for upcoming features. |
| Communities | Connect with user groups and find events focused on Microsoft Fabric. |
| Blogs | Read updates and insights on Power BI and Microsoft Fabric from experts and the community. |
| Learning | Access certifications, tutorials, and documentation to build your skills and knowledge. |
| Support | Get help from community forums and official product support channels when you need assistance. |
You can join forums to ask questions or share your experiences. Inspiration galleries let you see what others have built and spark your creativity. If you have ideas for new features, you can submit them and help shape the future of Microsoft Fabric. User groups and events give you a chance to network and learn from peers. Blogs and tutorials keep you updated on the latest trends and best practices. When you need help, support channels are ready to assist you.
Note: Take advantage of these resources to stay informed, solve challenges, and grow your expertise with Digital Twin Builder.
You can transform your data management with Microsoft Fabric Digital Twin Builder. Real-world users like CSX Corporation and SPIE Nederland B.V. have improved decision-making and streamlined operations by unifying their data. You benefit from real-time intelligence, easy modeling, and operational excellence.
Looking ahead, you will see these trends shape the future:
- Enhanced real-time intelligence for actionable insights
- Seamless integration of diverse data sources
- Broader accessibility through democratized digital twin technology
Explore Digital Twin Builder to unlock smarter, easier data for your organization.
Microsoft Fabric Digital Twin Builder Checklist
This checklist helps teams plan, build, and operate digital twins using Microsoft Fabric Digital Twin Builder.
How does the ontology in digital twin builder enable better digital twin creation?
The ontology in the digital twin builder provides a semantic model that defines entities, relationships and properties, allowing you to structure data into an ontology and create comprehensive digital replicas. By using an ontology you can map disparate data and OT data into a consistent schema, which simplifies digital twin creation, digital twin development and the creation of digital representations of real-world environments within Microsoft Fabric.
What data sources can Microsoft Fabric integrate for digital twin data?
Microsoft Fabric supports a wide range of data sources including IoT/OT data streams, telemetry, relational databases, CSV and Parquet files, Azure services, and external APIs. Fabric enables ingest data workflows and data integration so you can bring disparate data into the digital twin builder's environment to create and manage digital replicas and structure to create comprehensive digital models.
Can I use Azure services alongside microsoft fabric digital twin features?
Yes—fabric stands with Azure by enabling integration with Azure Digital Twins, Azure IoT Hub and other Azure services. You can combine microsoft fabric's all-in-one platform with Azure resources for storage, compute and device connectivity, enabling real-time intelligence workload in Microsoft and hybrid scenarios that use both Fabric and Azure Digital Twins for large-scale digital twin creation.
What is the new digital twin builder and how does it simplify digital twin development?
The new digital twin builder in Fabric provides a visual interface and tools for semantic model authoring, data mapping, and digital twin creation. The digital twin builder item helps you define entities, relationships and business logic, accelerating digital twin development and enabling non-experts to create comprehensive digital replicas and digital representations of real-world environments with less code.
How does Microsoft Fabric enable real-time insights and real-time dashboards for digital twins?
Fabric enables real-time analytics by ingesting streaming telemetry and combining it with historical data, supporting real-time dashboards and real-time intelligence in Microsoft Fabric. By connecting digital twin data to Fabric’s analytics and visualization tools you can produce dashboards that surface live status, alerts and predictive insights for physical operations using data.
What role does data mapping and data engineering play in creating complex digital twins?
Data mapping and data engineering are critical for transforming raw inputs into the semantic model used by the digital twin. Data engineering pipelines clean, enrich and map data into the ontology, ensuring that complex digital twins accurately reflect assets and relationships. This process supports creation of digital twins that combine telemetry, contextual metadata and business KPIs.
How do I get access to digital twin instances and manage permissions in Fabric?
Access to digital twin resources in Fabric is controlled through workspace-level and item-level permissions, integrating with Azure AD for identity and role-based access control. You can invite collaborators, assign roles for digital twin creation or viewing, and audit activity to ensure secure access to digital twin data and semantic model artifacts.
Is there a tutorial data summary or Microsoft Learn path for getting started?
There are tutorial introduction guides, Microsoft Learn modules and a microsoft fabric blog with examples that summarize key steps: ingest data, define an ontology, map data into the semantic model, and create visualizations. These tutorial data summary resources help you follow a repeatable path to create digital representations and begin digital twin development within Microsoft Fabric.
How do semantic model and ontology in digital twin builder handle disparate data types?
The semantic model and ontology allow you to normalize disparate data types by defining canonical entity types and relationships. Whether data comes from OT devices, enterprise systems or CSV files, you can harmonize it into the same model so the digital twin can represent assets, events and states consistently across systems.
Can microsoft fabric digital twin consume OT data and integrate it with business systems?
Yes—fabric enables OT data ingestion and can combine that telemetry with ERP, maintenance systems and other business data. By unifying operational and business context in the digital twin, organizations can create comprehensive digital replicas of assets and use them for predictive maintenance, process optimization and digital transformation initiatives.
What are best practices for data integration and data mapping into the digital twin builder?
Best practices include: establish a clear ontology before mapping, use schema validation and transformation pipelines, enrich telemetry with metadata, maintain a single source of truth for identity resolution, and document mapping rules. Following these steps makes digital twin creation repeatable and reduces errors when mapping data into an ontology or digital twin data store.
How do I use Microsoft Fabric to create real-time intelligence workloads for operational scenarios?
To build real-time intelligence workloads in Microsoft Fabric, ingest streaming data, apply real-time processing and join it with historical and contextual data in the semantic model. Connect the results to real-time dashboards and alerting; this approach lets you create and manage digital replicas that drive operational decisions and bring real-time intelligence to physical operations using data.
🚀 Want to be part of m365.fm?
Then stop just listening… and start showing up.
👉 Connect with me on LinkedIn and let’s make something happen:
- 🎙️ Be a podcast guest and share your story
- 🎧 Host your own episode (yes, seriously)
- 💡 Pitch topics the community actually wants to hear
- 🌍 Build your personal brand in the Microsoft 365 space
This isn’t just a podcast — it’s a platform for people who take action.
🔥 Most people wait. The best ones don’t.
👉 Connect with me on LinkedIn and send me a message:
"I want in"
Let’s build something awesome 👊
Summary
Exploring Microsoft Fabric’s Digital Twin means asking: is it finally the tool that tames messy data — or just another layer of complexity? In this episode, I walk through what the Digital Twin Builder (in Fabric’s Real-Time Intelligence) promises, how it plugs into OneLake, and whether it truly simplifies modeling, mapping, and dashboards — or adds new headaches.
We’ll break down the semantic canvas, ontology modeling, mapping noisy data sources, and building real-time dashboards. You’ll see the trade-offs: how low-code aims to democratize modeling, but how dirty source data, mapping mistakes, or ontology missteps can turn the twin into a liability.
By the end, you’ll have a clearer view of when a digital twin is worth building, the kind of governance and prep work required, and whether Fabric’s version is a fix for chaos or just another project you’ll regret.
What You’ll Learn
* What a digital twin really is — and why it matters
* How Fabric’s Digital Twin Builder leverages OneLake, RTI, and semantic modeling
* What the semantic canvas / ontology is and how it governs modeling
* How to map messy sources (IoT, ERP, raw feeds) into twin structures
* How Fabric supports real-time dashboards, anomaly alerts, and ML overlays
* The low-code promise vs the governance burden — when it helps, when it hurts
* Pitfalls and tradeoffs: dirty data, mapping chaos, evolving definitions, and scale
Full Transcript
Okay admins, you saw the title. You’re wondering: is Fabric’s Digital Twin Builder the answer to our messy data, or just another data swamp wearing lipstick? Quick fact check: it’s in preview inside Fabric’s Real-Time Intelligence, and the twin data lands in OneLake — so this plugs straight into Power BI and Fabric’s real‑time tools.
Here’s the deal. In this video, we’ll hit three things: modeling with the semantic canvas, mapping noisy data sources into a coherent twin, and building real‑time dashboards in Power BI and RTI. Cheat sheets and the checklist are at m365.show.
So before we start clicking around, let’s rewind: what even is a digital twin, and why should you care?
What Even Is a Digital Twin, and Why Should You Care?
You’ve probably heard the phrase “digital twin” tossed around in strategy decks and exec meetings. Sounds flashy, maybe even sci-fi, but the reality is much more grounded. A digital twin is just a dynamic virtual model of something in the real world—equipment, buildings, processes, or even supply chains. It’s fed by your actual data—sensors, apps, ERP tables—so the digital version updates as conditions change. The payoff? You can monitor, predict, and optimize what’s happening without waiting three days for someone to email you a stale spreadsheet.
That’s the clean definition, but in practice, building one has been brutal. The old way meant wrangling fragmented data sources that all spoke different dialects: scripts grabbing IoT feeds, half-baked ERP exports, brittle pipelines that cracked every time upstream tables shifted. It wasn’t elegant architecture; it was a glue-and-duct-tape IT project. And instead of a reliable twin, you usually ended up with a wobbly system that toppled as soon as something changed—earning you angry tickets from operations.
Take the “simple” factory conveyor example. You’d think blending sensor vibration data with ERP inventory and logistics feeds would give you a clear real-time view. Instead, you’re hit with schema mismatches, unstructured telemetry, and exports in formats older than your payroll system. ETL tools demanded rigid modeling, one bad join could choke the whole thing, and “real time” usually meant “come back next week.” That messy sprawl is why so many digital twin attempts collapsed before they delivered real ROI.
Still, companies push through because when twins work, they unlock tangible wins. Instead of making decisions on lagging snapshots, you gain predictive maintenance and operational foresight. Problems can be caught before equipment grinds to a halt, resource use can be optimized across sites, and supply chain bottlenecks can be forecast rather than reacted to. The benefits aren’t theoretical—real organizations have shown it works. For example, CSX used an ontology-based twin model to unify locomotive data with route attributes. That allowed them to predict fuel burn far more accurately, saving money and improving scheduling. That’s the kind of outcome that convinces leadership twins aren’t just another IT toy.
The trouble has always been the build. Old-school pipelines were fragile—you spent more time fixing ETL failures than delivering insight. One update upstream and suddenly your twin was stale, your dashboards contradicted each other, and no one trusted the numbers. That was the real root cause of “multiple source of truth” disasters: not bad KPIs, just bad plumbing.
Microsoft Fabric’s Digital Twin Builder is Microsoft’s attempt to break that cycle. By unifying models directly in OneLake and layering an ontology on top, it gives you a structured way to harmonize messy sources. In plain English, it’s like swapping out your drawer of mismatched dongles and adapters for a single USB-C hub. Instead of custom wiring every new data feed, you connect it once and it plugs into the twin model cleanly. It doesn’t remove every headache—you’ll still find some malformed CSVs at the bottom of the pile—but it reduces the chaos enough to move from constant repair mode to actual operations.
And here’s a key point: this isn’t just about making it work for data engineers with three PhDs. Fabric’s twin builder explicitly democratizes and scales twin scenarios. The tooling is designed with low-code and no-code approaches in mind—modeling, mapping, relationships, and extensions are all provided in a way that subject matter experts can engage directly. That doesn’t mean admins throw away their SQL, but it does mean fewer scenarios where IT is the choke point and more cases where operators or analysts can extend the model themselves.
So why should you care? Because a robust digital twin equates to fewer late-night tickets, cleaner insights, and actual alignment between operations, finance, and IT. When one system of truth lives in OneLake and updates in real time, arguments across departments drop. Dashboards reflect reality, not guesswork. For admins and operators, that’s less firefighting and more control over the environment you’re supposed to be governing.
Bottom line: digital twins aren’t slideware anymore. They can be a unifying layer that trims waste, cuts outages, and bridges the data silos that make your work miserable. The fact they’ve been historically hard to build doesn’t erase their real value—it just means the “how” has been the bottleneck. Fabric is Microsoft’s bet that low-code tools can finally make this practical, at least for more organizations.
So Microsoft says: low-code. But does that actually save admins time? Let’s test the promise.
Low-Code or Low-Patience? The Promise and the Catch
Fabric’s Digital Twin Builder puts its cards on the table with the “semantic canvas.” That’s the visual drag‑and‑drop surface where you define entities, their types, and specific instances, then wire them up with relationships. Namespaces, types, instances — it’s how Microsoft docs describe it, and that’s what you actually see on screen. The aim here is straightforward: cut down engineering friction so subject‑matter experts can participate in modeling without waiting two weeks for IT to hack together joins. Microsoft and even InfoWorld both frame this as a low‑code experience — but let’s be clear. You still need to understand your data sources and do some mapping prep before the canvas makes sense. This is not a “press button, twin built” fairytale.
If you’ve suffered through low‑code tools before, your reflex is probably suspicion. “Drag‑and‑drop” often morphs into click‑and‑regret — endless diagrams, broken undo functions, and more mouse miles than a Fortnite session. We’ve seen tools where moving one shape snapped the whole screen into spaghetti. Here’s the difference: the semantic canvas enforces consistent structure. Every relationship you draw locks into the defined ontology, killing the bad habit of ad‑hoc columns or “creative” field naming. It’s less paint‑by‑numbers, more guardrails that keep contributors from turning your data into chaos.
Picture this through the lens of a frontline engineer who couldn’t write a JOIN if their job depended on it. In the old model, pulling them into a twin project meant feeding requirements to IT, then waiting while pipelines choked and broke. In the Fabric builder, that engineer can open a workspace, drop in “Pump #12,” link it to “Sensor Vibration A,” and then tie that chain back to maintenance schedules in ERP. They’re not coding queries — they’re connecting dots. And because it all sits inside an ontology, their sketch isn’t random art that dies next upgrade; it’s a structure that admins can actually trust long‑term.
The payoff isn’t just toy demos. SPIE, for example, used Twin Builder to unify property data across its real estate portfolio. Instead of different offices juggling isolated asset systems and spreadsheets, everything dropped into one consistent model. That shift gave them portfolio‑wide, near real‑time insights into what was happening across properties, without resorting to custom regional exports. That’s not marketing‑deck theory — that’s an operations team cutting noise and getting clarity.
Now, admin honesty time. This is still “low‑code,” not “no‑work.” Messy inputs don’t magically fix themselves. If your IoT feed is spewing null values or your HR tables are riddled with free‑text “departments” (hello, “IT‑ish”), you’re just feeding the canvas garbage. The builder won’t transform broken signals into gold. What it does is give you structured, reusable building blocks once you’ve cleaned the sources. No more building the same relationship map five different times for five different twins. One model, reused everywhere. That’s a meaningful cut in repetitive cleanup cycles.
So where does this leave admins? Somewhere between “life‑changing” and “GUI purgatory.” The Digital Twin Builder won’t make non‑technical staff into SQL wizards, but it will let domain experts model their world without opening service tickets every ten minutes. For the data team, that means fewer nights wasted merging CSVs for the hundredth time. And for admins, it means guardrails that hold shape while you scale, instead of every department inventing their own naming scheme like it’s SharePoint 2010 all over again.
Upfront work still matters — you need to know your sources, and you need governance discipline — but the canvas gives you reusable blocks that drastically reduce integration fatigue. That leads neatly to the next piece of the puzzle, because once you’re building inside the canvas, you run headfirst into the concept that makes or breaks the whole thing: ontology.
Mastering the Semantic Canvas Without Losing Your Sanity
When you step onto the semantic canvas, the first thing you have to deal with is structure. Fabric forces you to describe your world using three building blocks: namespaces, types, and instances. This is the “hierarchical ontology” Microsoft loves to mention, and it’s the part that actually keeps your twin useful instead of turning into a pile of sticky notes. Namespaces are the top categories, like “factory,” “building,” or “fleet.” Types sit inside those namespaces, like “pump,” “conveyor,” or “employee.” And then instances are the real‑world things you’re tracking: Pump #12, Conveyor Line A, or yes, Bob who keeps tripping the safety sensor. The canvas enforces that order, and you apply it everywhere, so “temperature” doesn’t mean six different things depending on who imported the data.
That’s the practical angle. A lot of admins hear “ontology” and recoil, picturing academic diagrams full of bubbles and arrows no one remembers by the next meeting. But in Fabric, think simpler. It’s labeling boxes in your garage so you can actually find the wrench instead of digging every time. Nobody’s grading you on philosophy here. The only goal is consistency so your teams don’t reinvent definitions each time a new project spins up.
This structured layer isn’t just a filing cabinet, either. The ontology maps both metadata and relationships across data types so analytics can use consistent definitions every time. That means ERP, IoT, and HR data suddenly align. No more juggling three dialects where one feed says “asset_id,” another says “machine_id,” and HR just casually labels it “workstation.” The semantic canvas gives all of them one dictionary. Once that dictionary exists, your analytics and dashboards quit arguing and actually align on the same objects.
The benefit shows quickly when new signals pour in. Without a structure, every new feed means messy joins and hours of trial‑and‑error. With an ontology, Fabric just slots data into the right namespace, type, and instance. Add another temperature sensor, and it files under the pump you already modeled. Add another employee, and it slides under the same type you defined before. It’s like writing an index once, then letting every new chapter drop neatly into place without you standing watch.
Collaboration also stops being an accident waiting to happen. Left unchecked, every team will build its own flavor of “motor” or “pump.” You’ll end up reconciling dozens of overlapping definitions that all mean almost the same thing — but not quite. Fabric’s semantic canvas shuts that down. One definition per type. Everyone inherits the same design. That’s guardrails, not handcuffs, and it keeps the zoo of data at least somewhat tamed.
Of course, it’s not magic. You still need subject‑matter experts at the start to define the vocabulary. Fabric expects you to know — or be able to discover — the real entities you care about. If you don’t have experts weighing in during setup, you risk designing a structure that looks nice on the canvas but doesn’t match reality in the field. The builder reduces friction, but it doesn’t replace domain knowledge.
That combination — reusable structure, consistent definitions, and domain‑driven vocabulary — is the sanity‑saving piece. Instead of drowning in schema mismatches and fighting over what counts as “signal_dt” versus “sensor_reading,” you’ve got a single agreed layer. The payoff for admins is hours back and fewer cross‑team food fights over mislabeled data.
Bottom line: the semantic canvas isn’t theory. It’s a practical way to create a real‑world map your organization can share, update, and trust. Once it’s there, you stop arguing about labels and start building actual insight. With the ontology in place, the next job is mapping your noisy feeds into those types and instances.
Mapping Your Data Chaos Into Something Useful
Your data chaos doesn’t politely line up—it shouts over itself. Sensor streams ticking every few seconds, ERP tables spawned in a dozen dialects, HR still sitting on some Access database dug up from 2008. In the old world, you’d spin up nightly ETL jobs, cross fingers that column formats didn’t betray you, and brace for SQL Server wheezing through millions of rows. One malformed date? Pipeline gone, ops staff angry, and you’re in triage mode by dawn.
Fabric takes a different route. Instead of hammering every source into a single rigid schema, it lands data in OneLake as-is: time-series streams, CSV dumps, ERP extracts—no pre-mangling required. On top of that raw lake, the digital twin builder applies a semantic overlay aligned with the ontology. That overlay supplies the meaning: asset_id and machine_id don’t have to merge into one column; they map against the same entity definition instead. Metadata does the harmonizing, not endless field surgery.
That small distinction matters. OneLake holds the native formats, and the ontology maps them to usable structures. You cut out half the busywork because the builder doesn’t rebuild data—it translates it. It’s more like giving each system a name tag at a party: different outfits, same introduction. Analytics then sees “This is Pump #12” rather than arguing whether the source called it “pump_id” or “asset_id.”
The payoff is easiest to see in companies already pushing production limits. CSX is a textbook case. Locomotives constantly shift between train lines, and the data behind them is messy: engine specs, route details, operational constraints. Their old database model crumbled under the churn. With Fabric’s ontology-driven mapping, they stitched those feeds into one frame—locomotive plus line attributes—leading to better fuel burn predictions and a foundation for natural language queries and even ML inputs. That’s why mapping isn’t a side chore; it’s what makes twins functional.
Of course, smart mapping doesn’t mean lazy mapping. Left alone, the layer degenerates into renaming hell. One team records “machine_temp,” the next pushes “temperature,” the third swears “coreTemp” is the truth, and soon nobody trusts the twin at all. The fix here is procedural: enforce naming and mapping hygiene early. A small mapping contract and a steward per namespace keeps order. It feels like overhead until you compare it to the nightmare of doing a retrofit governance cleanup when five dashboards already depend on conflicting fields.
Done right, mapping is what collapses scattered silos into a working mirror. Instead of managing twelve dashboards shouting conflicting metrics, you get one coherent twin that answers basic but urgent questions: Which assets are running? Which are sliding toward failure? Where is today’s bottleneck? The ontology gives the structure, but mapping gives that structure meaning. Without it, your “twin” is just a catalog. With it, you’ve got a model that tracks reality closely enough to guide actual decisions.
So the win here isn’t academic. Fabric trimming ETL overhead means you’re not burning cycles on fragile pipelines. Storing native formats in OneLake lets you ingest broadly without fear of breakage every patch cycle. The semantic overlay maps fields into something everyone can read the same way. Your data chaos doesn’t vanish, but with discipline, it becomes usable.
That’s the bridge we’ve been after: raw feeds on one side, semantic order on the other, connected without you pulling nightly firefights. And the natural question once you’ve mapped all this? Whether admins and managers can actually see it in action—on screens they trust, at the pace the business needs, not buried in exports nobody checks. And that’s where things start to move from a well-structured twin into something truly visible across the org.
Turning Twins Into Insights: Dashboards, Real-Time Streams, and AI
Digital Twin Builder isn’t just about modeling. Because it’s part of Fabric Real-Time Intelligence, the twin data you store in OneLake can feed straight into Power BI through Direct Lake and into Fabric’s real-time dashboards. That means everything you just mapped doesn’t sit quietly—it becomes something you can monitor, trend, and act on without waiting for exports or stitched-together pipelines.
Here’s the blunt test: if your VP is still glued to half-broken Excel pivots while your neat ontology hums quietly in the background, you’ve built a very expensive screensaver. A digital twin that never leaves the canvas is furniture, not a tool. The real point is lining it up with dashboards and alerts people outside IT can actually use.
That’s why the integration with Power BI and Real-Time Dashboards is the turning point. Because it’s native to OneLake, you don’t juggle connections or refresh chains—Power BI and RT dashboards see the twin data instantly. Instead of emailing PDFs full of lagging charts, you deliver live feeds leaders actually respond to.
Of course, dashboards have a history of wasting everyone’s time. They’re either late, so all you get is last week’s scrapbook, or they vomit chart spam until nobody trusts them. Fabric skips that mess by making them real-time and scoped to actual events. It’s not twelve graphs you can’t parse—it’s the single signal that matters now.
Here’s how it actually fires: an Eventstream ingests the live IoT feed, KQL queries run anomaly detection in sub-seconds, an Activator rule raises the alert, and that alert flows out into Power BI or the RT dashboard your ops team stares at all day. Conveyor vibration spikes? The alert arrives as it happens, not as a red entry in tomorrow’s post-mortem. Maintenance jumps on it early, downtime avoided.
This is anchored in Fabric’s hot/cold architecture. Hot is Eventstream plus KQL—the data path watching live signals for anything weird. Cold is Delta in OneLake—the historical twin data you rely on for context and for training models. Together, you get the “alarm bell” and the “long memory.” Old platforms usually forced you to pick one. Here, you get both, and that combination is what makes the insights credible instead of superficial.
SPIE showed the point in practice. By rolling twin data into dashboards, they connected building performance across a whole property portfolio in seconds. What used to take days now updates instantly, which means sustainability metrics and investment decisions aren’t lagging behind reality. It’s not a fluffy “faster insights” slide—it’s a team shaving days of wait into seconds.
Now, mid-roll reminder: want the step-by-step checklist? It’s in the free cheat sheet at m365.show. If you’re already sold and want the cliff notes to survive rollout, grab it there.
But dashboards are only the start. The real kicker comes from Extensions and ML. Because Fabric has native support for Data Science and AutoML models, you can layer predictions right on top of the twin. That means you don’t just alert when a machine starts failing—you flag that it’s on track to fail before it does. That’s predictive maintenance baked in, not duct-taped after the fact.
Microsoft isn’t stopping at 2D dashboards either. They’re already working with NVIDIA to link Fabric twins into Omniverse—think combining twins with 3D models and robotics data. The goal isn’t overhyped sci-fi, it’s a richer operational view: spatial simulations, sensor data mapped visually, training environments where ops can rehearse fixes without touching production.
So the rule of thumb looks like this: Dashboards confirm what’s happening now. Real-time Eventstream plus KQL gives the instant anomaly check. Extensions let you predict the next failure. And Omniverse ties it into 3D models for the future. Each layer builds so the twin isn’t ornamental—it’s functional, and eventually proactive.
Dashboards plus the hot/cold path plus ML = the twin becomes actionable, not decorative. And that leads us straight into the reality check every admin needs to hear before they strap this thing into production.
Conclusion
Here’s the bottom line on Fabric’s Digital Twin Builder: it doesn’t wave a wand and fix bad source data. What it does give you are real guardrails—structure through the semantic canvas, straight mapping into OneLake, and native outputs into Power BI and real-time dashboards. Industry users report measurable wins in predictive maintenance and operational visibility; CSX and SPIE are proof this can move from theory to production reality.
For admins, the trade-off is clear. You still need governance and domain experts, but you finally get modeling guardrails and fewer dashboard fights. See the tool, try it in preview, enforce your mappings, and you’ll get real-time visibility instead of stale reports.
Subscribe to the podcast and leave me a review—I put daily hours into this, and your support really helps. Thank you!
This is a public episode. If you'd like to discuss this with other subscribers or get access to bonus episodes, visit m365.show/subscribe

Founder of m365.fm, m365.show and m365con.net
Mirko Peters is a Microsoft 365 expert, content creator, and founder of m365.fm, a platform dedicated to sharing practical insights on modern workplace technologies. His work focuses on Microsoft 365 governance, security, collaboration, and real-world implementation strategies.
Through his podcast and written content, Mirko provides hands-on guidance for IT professionals, architects, and business leaders navigating the complexities of Microsoft 365. He is known for translating complex topics into clear, actionable advice, often highlighting common mistakes and overlooked risks in real-world environments.
With a strong emphasis on community contribution and knowledge sharing, Mirko is actively building a platform that connects experts, shares experiences, and helps organizations get the most out of their Microsoft 365 investments.