The Ultimate Copilot Success Metrics Framework for Microsoft Environments

If you’re implementing Copilot in your Microsoft stack, you can’t afford to guess at its impact. This guide lays out a tiered Copilot success metrics framework built for real-world Microsoft 365 and GitHub environments. You’ll see how to measure developer productivity, experience, and the ROI that leadership cares about—using data, not gut feelings. Beyond just tactical reporting, this framework covers practical tools, actionable insights, and responsible AI governance to make sure your Copilot results are secure, fair, and truly valuable. Whether you’re an IT leader or a business decision-maker, you’ll find clear strategies to track what matters, minimize risks, and connect Copilot adoption to bottom-line outcomes.
Building a Tiered Copilot Metrics Framework for Business Impact
In today’s Microsoft-heavy enterprises, measuring Copilot’s influence can be a challenge. Copilot isn’t just a neat add-on—it’s a workforce accelerator, but only if you know how to measure success the right way. That’s where a tiered metrics framework comes into play. Rather than a flat list of numbers, this structured approach breaks down Copilot’s impact into three strategic tiers: developer productivity, developer experience, and organizational velocity.
Why tiers? Each level tackles a different part of the Copilot equation, from day-to-day developer efficiency to the broader momentum across business units. When you break it down, you get sharper insights. It also helps leaders compare apples to apples, set realistic targets, and identify what’s working (and what isn’t) as Copilot adoption grows.
This section introduces the “what” and “why” behind each tier, setting up practical deep-dives into which metrics to collect, how to interpret them, and how they tie back to real business goals. Whether you’re building business cases or driving culture change, a tiered framework ensures you’re tracking the right signals—not just vanity stats. Let’s get ready to look at each layer and see how it all comes together for big impact.
Tiered Developer Productivity: Actionable Metrics for Measuring Copilot Impact
- Code Velocity (Lines or Features Delivered): Track how many lines of code, features, or pull requests get completed per sprint or month, comparing before and after Copilot. If output jumps while quality holds steady, you know you’re onto something.
- Time to Complete Coding Tasks: Measure the average time it takes for developers to finish common tasks or user stories. Copilot’s real value often appears as faster cycle times—less clicking around, more finishing up.
- Copilot-Assisted Commit Frequency: Analyze the percentage of commits or code changes generated with Copilot’s help. This shows where Copilot is actually shifting work from manual to automated, especially in GitHub environments.
- Completion and Acceptance Rates: Review how many Copilot-generated suggestions are accepted, edited, or discarded. High acceptance usually means relevant suggestions and efficient workflows.
- Deployment Frequency: If code with Copilot gets shipped faster and more often, track those release or deployment stats, especially for teams looking to scale DevOps best practices.
Evaluating Developer Experience and Satisfaction Across Productivity Tiers
- Pulse Surveys and Sentiment Analysis: Regularly ask developers how Copilot impacts their work. Are they less frustrated? More engaged? Short, focused surveys can uncover pain points and adoption hesitancy early.
- Behavioral Usage Patterns: Track shifts from basic prompts to more sophisticated, natural language queries. Do developers start leveraging Copilot more creatively as they grow comfortable, or do they stick to simple tasks?
- Feedback and Qualitative Data: Collect free-text comments in retros, standups, or feedback tools. Look for themes—ease of learning, usefulness, areas for improvement—to direct your rollout and support.
- Adoption Depth and Habit Formation: Monitor how Copilot moves from a novel tool to an embedded workflow standard. Signs of deeper behavioral change include increased prompt complexity and reduced manual coding over time.
Driving Tiered Organizational Velocity With Copilot
- Time-to-Market Acceleration: Track reductions in project timelines or time needed to launch new features/products. Use pre- and post-Copilot benchmarks to quantify real speed gains.
- Cross-Team Collaboration: Analyze trends in knowledge sharing, code reviews, and AI-driven documentation. Are teams working together more seamlessly because Copilot lifts communication barriers?
- Innovation Rate: Measure the number of new prototypes, experiments, or creative solutions delivered per quarter. If Copilot is freeing up more time for experimentation, you’ll see it here.
- Business KPI Alignment: Always map Copilot usage data directly to business outcomes—customer satisfaction, revenue, or compliance scores. This shift turns IT numbers into boardroom-ready results.
Avoiding Vanity Metrics and Choosing What Moves the Needle
It’s easy to get dazzled by big numbers when rolling out Copilot. But not all metrics are created equal. Some stats look great in a slide deck, but tell you nothing about whether Copilot is actually helping your people or boosting your bottom line. That’s why separating vanity metrics from true performance indicators is so important.
This section unpacks why tracking simple activity and usage can be misleading and sometimes downright risky for your adoption strategy. As you dig deeper, you’ll see how to focus on metrics that actually tie back to productivity, value add, and strategic goals, rather than just surface-level engagement.
By understanding which KPIs are meaningful and which ones are noise, you’ll be able to direct resources where they count, avoid chasing misleading benchmarks, and present a Copilot story that resonates with decision-makers. Up next, we’ll call out the classic vanity traps—and give you the shortlist of metrics that truly drive improvement.
The Problem With Vanity Metrics in AI Adoption
Vanity metrics in the AI world typically show off big, easy numbers—like user logins, frequency of autocomplete usage, or generic “active session” stats. But these numbers don’t prove that Copilot is solving real problems or delivering business value. Relying on them can mislead stakeholders, waste resources, and hide critical adoption issues.
Organizations that judge Copilot’s success by these metrics risk missing early warning signs, such as shallow engagement or poor quality outcomes. While a spike in logins might look promising, it doesn’t prove people are using Copilot for the right tasks—or at all after the initial excitement fades. To avoid wasted investment and missed opportunities, shed the vanity stats and get clear on what truly matters.
Metrics That Move the Needle and Drive Real Copilot Value
- Time and Cost Savings: Quantify reductions in manual work hours or budget spend directly attributable to Copilot’s assistance.
- Successful AI Prompt Completion: Track how often users start and finish meaningful tasks with Copilot, rather than just logging in.
- Improvement in Code Quality or Document Accuracy: Monitor error rates, bug counts, or quality scores on outputs generated with Copilot.
- Downstream Business Outcomes: Connect Copilot activity to broader results like customer satisfaction, revenue growth, or compliance improvements.
Quantifying Copilot ROI and Measurable Business Impact
Every leader wants to see proof: Does Copilot actually deliver a return? This section dives into how you can translate usage data and team experiences into quantifiable ROI for Microsoft 365 Copilot—and back it up with credible, industry-standard benchmarks. Hard numbers and real outcomes matter most to executives making future investment decisions.
You’ll see how to leverage frameworks like Forrester’s Total Economic Impact (TEI) and other research-backed studies to benchmark your own results. This isn’t just about efficiency stats; it’s about putting a solid business case behind continued Copilot investments, from cost savings to increased innovation powers.
The focus here is on connecting your Copilot journey to measurable gains: time recovered, errors avoided, and newfound business capacity. You’ll gain practical models, industry research, and expert benchmarks to help you quantify—and clearly communicate—Copilot’s real value.
Copilot ROI: Quantifiable Metrics and Business Outcome Benchmarks
Microsoft’s own studies show impressive numbers: Microsoft 365 Copilot pilots reported up to 29% faster task completion and a 70% reduction in information search time, according to Microsoft-published research. For software teams, GitHub Copilot data shows developers code up to 55% faster on repetitive or boilerplate tasks.
Organizations have reported tangible outcomes, such as a 20% reduction in low-level support tickets or measurable improvements in document accuracy for knowledge workers. These data points can be used to benchmark your own efficiency gains. Tracking before-and-after metrics gives leaders credible evidence for Copilot ROI beyond the hype.
Forrester and Industry-Specific ROI Metrics for Microsoft 365 Copilot
Forrester’s Total Economic Impact report on Microsoft 365 Copilot found a 3x to 4x payback period, with studied organizations realizing nearly $5.90 in value for every $1 spent. Industries like financial services and healthcare saw operational cost cuts and time-to-market acceleration. Forrester’s research also highlights increased employee satisfaction and lower attrition risk.
Using these external benchmarks as comparison tools, IT and business leaders can set clear ROI targets aligned with sector standards. The combination of Forrester’s findings and industry-specific benchmarks creates a powerful, credible foundation for making the business case—and adjusting expectations accordingly.
Aligning Metrics to Organizational Maturity and Adoption Goals
No two organizations are in the same place on their Copilot journey. So your success metrics shouldn’t be one-size-fits-all. This section guides you in tailoring your KPIs and reporting approach to match your company’s AI maturity—whether you’re just piloting Copilot, starting departmental rollouts, or scaling enterprise-wide.
Adjusting which metrics to track (and how to measure them) at each stage keeps your data meaningful and actionable. Early on, it’s about learning and user engagement. Later, it’s about business outcomes, compliance, and embedding Copilot into daily operations. Each phase brings new focus for your measurement strategy.
You’ll learn how to use feedback and results to shape the next phase of adoption—whether that’s tweaking training, nudging more users onboard, or refining governance for scale. The result? Data-driven, strategic Copilot adoption that keeps evolving as your organization matures.
Matching Metrics With Organizational Maturity
- Pilot Stage: Focus on adoption rates, initial user engagement, and qualitative feedback. Look for early signals of value and pain points through pulse surveys and activity tracking.
- Departmental Rollout: Add metrics on team-level productivity, workflow integration, and usage trends. Here’s where you watch for habit formation and process improvements tied to Copilot use.
- Enterprise Deployment: Measure organization-wide business outcomes—like cost savings, compliance, operational velocity, and cross-platform consistency. At this level, governance and ethical AI usage tracking are critical, ensuring responsible scale-up.
Using Results to Inform Adoption and Guide Expansion
- Refine Training Initiatives: Leverage usage data to tailor upskilling, focusing on teams or features that need support.
- Identify and Address Resistance: Track feedback trends to spot adoption barriers—then act with communications and hands-on demos.
- Course-Correct Implementation: Use continuous measurement to pivot tactics quickly if initial pilots stall or workflows don’t improve.
- Justify Scale to Executives: Provide evidence—cost savings, ROI, improved satisfaction—to secure buy-in for broader rollout from leadership.
Operationalizing Copilot Metrics in Microsoft 365 and GitHub
Even the best framework falls flat without practical measurement tools. This section bridges strategy and execution, showing how to track Copilot’s impact with the Microsoft 365 Admin Center, Viva Insights, and GitHub analytics. It’s about turning plans into reality so teams, managers, and executives all get clear, live visibility into Copilot’s value across workstreams.
We’ll walk through the reporting options available natively in both Microsoft 365 and GitHub ecosystems, with a nod to integrating results for a cross-platform view. Whether you care about project delivery, compliance, or developer happiness, these tools can make your metrics actionable—not just shelfware.
Along the way, you’ll see how to connect reporting with secure and compliant governance practices. Robust measurement can support not just productivity, but also responsible AI use and risk management across your Microsoft landscape. Don’t forget to check out best practices on Copilot governance over at this guide and operational security details in this compliance resource.
Tracking Microsoft 365 Copilot Success With Admin Center and Viva Insights
- Adoption Dashboards: Use the Microsoft 365 Admin Center to track Copilot provisioning, license assignment, and which users are actively engaging with Copilot features.
- Productivity and Collaboration Reports: Viva Insights provides metrics on time spent collaborating, meeting overload, and workflow patterns. These reports reveal how Copilot is helping teams reduce busywork or shift to higher-value tasks.
- User Feedback Collection: Surveys embedded in Teams or Outlook, alongside platform analytics, uncover usability barriers and quick wins for future iterations.
- Compliance and Governance Monitoring: Leverage features like activity logs, role-based access monitoring, and DLP alerts to support secure Copilot adoption. Dive deeper into governance at this policy guide and review compliance best practices via this security deep dive.
Designing a GitHub Copilot Metrics Framework
- Copilot Usage Analytics: Track how often Copilot suggestions are used, accepted, or modified. GitHub offers built-in telemetry for monitoring active users and prompt adoption trends over time.
- Developer Productivity Metrics: Monitor metrics like code completion time, commit frequency, and branch merge rates. Compare output pre- and post-Copilot to reveal efficiency shifts.
- Code Quality and Review Outcomes: Use static analysis and peer review stats to evaluate if Copilot-assisted code passes checks and is less prone to bugs and vulnerabilities.
- Integration with External Tools: Connect GitHub data to external dashboards (like Power BI or custom analytics solutions) for enterprise-level reporting and unified cross-platform tracking.
- Behavioral and Security Observability: Include prompt hygiene, responsible AI usage, and possible bias detection in your reporting framework—ensuring Copilot’s benefits don’t come at a compliance or quality cost.

Founder of M365 Show, M365con.net & m365.fm
Mirko Peters is a Microsoft 365 expert, content creator, and founder of m365.fm, a platform dedicated to sharing practical insights on modern workplace technologies. His work focuses on Microsoft 365 governance, security, collaboration, and real-world implementation strategies.
Through his podcast and written content, Mirko provides hands-on guidance for IT professionals, architects, and business leaders navigating the complexities of Microsoft 365. He is known for translating complex topics into clear, actionable advice, often highlighting common mistakes and overlooked risks in real-world environments.
With a strong emphasis on community contribution and knowledge sharing, Mirko is actively building a platform that connects experts, shares experiences, and helps organizations get the most out of their Microsoft 365 investments.
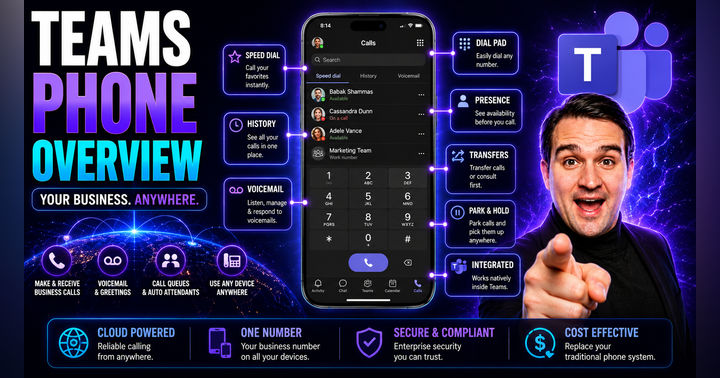
Microsoft Teams Phone Overview: Transforming Communication for Modern Businesses