Audit Log Delay Fix: Optimizing Logging for Microsoft 365, Azure, and Google Workspace

If you’re wrangling audit logs in Microsoft 365, Azure, or Google Workspace, you know firsthand how painful log delays can be. A slow audit logging system isn’t just an annoyance—it’s a security and compliance risk that can leave you flying blind when something goes wrong. Whether you’re chasing a regulatory report or responding to a potential incident, waiting for logs to show up can stall your entire process, sometimes by hours.
This guide breaks down exactly why these audit log delays happen and gives you practical solutions for fixing them in enterprise cloud environments. We’ll dig into the technical and architectural reasons for log latency, highlight specific challenges with Google and Microsoft’s audit pipelines, and show you how queue-based logging puts you back in the driver’s seat. Get ready to learn what’s slowing things down—and how to speed them up for good.
Understanding Audit Log Delays in Cloud Platforms
Modern cloud platforms like Microsoft 365, Azure, and Google Workspace promise you robust audit trails, but delays in log availability are a stubborn reality. Anytime you depend on these logs for compliance, threat hunting, or tracing changes, waiting for events to show up in reports or your SIEM can be frustrating. In critical scenarios, latency in audit data doesn’t just slow down your work—it introduces risks you can’t ignore.
The main culprits behind audit log delays are often rooted in the design of the cloud provider’s architecture. Instead of instant write-and-read cycles, platforms funnel data through layers of services, export pipelines, and sometimes throttled APIs. This results in log entries arriving minutes—or sometimes hours—after the actual event. Sometimes, the data’s even missing key fields, making the logs less useful when they finally do show up.
Understanding these delay patterns is crucial before you can fix them. In the sections ahead, we’ll focus on the classic challenges unique to Google Workspace and Microsoft 365, from pipeline lags to omitted fields. These overviews will set up a technical foundation, so you can better diagnose symptoms in your own environment and know exactly where to look for the underlying causes of slowness or incomplete data in your audit logs.
Troubleshooting Logs Audit Google Workspace and Field Omissions
Google Workspace audit logs are notorious for sometimes arriving late or showing up incomplete in Cloud Logging and related tools. This delay often stems from how events pass through Cloud Logging’s multi-stage architecture, export pipelines, and integration points. It’s not uncommon for certain fields—like user IDs or IP addresses—to be missing, especially when third-party connectors or downstream exports are involved.
Regularly, administrators find “field missing” warnings in their log entries, pointing to a breakdown or mismatch between source data and the system’s export or API layer. If you notice delays or data gaps, start by checking the raw logs within Google Workspace’s admin console, then trace where those records get omitted along the path to your SIEM or third-party logging tools. Keep an eye on pipeline health and consider automated regular checks for log completeness to spot workflow gaps early.
Microsoft 365 Unified Audit Log Delays and Reports Latency Azure
Microsoft 365’s unified audit logging makes life easier by centralizing events across services, but this unified approach isn’t always speedy. Latency issues are frequent, driven by the complex layering of Microsoft’s logging framework and dependencies on Azure’s analytics and reporting infrastructure. You might notice that fresh activity in Exchange, SharePoint, or Teams takes a while to appear in unified audit logs and usage reports.
The bottlenecks typically surface in the back-end processing and aggregation stages. Administrators should expect log delays particularly when viewing tenant-wide activity or pulling data through APIs for compliance or security reviews. For extra insight on how to audit user activity with Microsoft 365 and Microsoft Purview Audit, check out this detailed guide. Understanding these architectural realities can help you anticipate where log staleness is most likely to hit.
Architectural Synchronous Bottlenecks in Audit Logging
Synchronous audit logging is like insisting every car at a green light waits for the guy in the front to tie his shoes. In these setups, each application or service thread pauses to record an audit entry before moving on. It might sound careful, but in high-traffic cloud environments, this quickly stacks up into a traffic jam of blocked threads and delayed transactions.
Every time an application halts for the database or storage layer to confirm a log write, it eats up compute resources. This synchronous bottleneck is a root cause for sluggish log delivery, resource spikes, and timeouts in cloud-scale applications. If you want reliable auditability—especially under stress—you can’t have your entire system waiting on every audit entry to be logged before doing anything else. For a look at how real-time, auditable compliance relies on immediate data flow (such as in VAT reporting), see this deep dive on auditable ERP architectures.
Implementing a Queue Transport Solution for Audit Log Scalability
To escape the mess of slow audit logging, moving to a queue-based, asynchronous setup is the smart play. Instead of every action waiting its turn to write directly to storage, events get sent to a message queue for later, batch processing. This breaks the chokehold of synchronous bottlenecks and lets your application get back to work—even when log volumes spike.
Platforms like Symfony’s Messenger, RabbitMQ, and Azure Service Bus make this shift possible by offering reliable message transport between your app and the audit log database. The queue decouples the generate-and-store steps, which means no more blocked threads and much quicker throughput. And since each message follows the same process, you get consistent logging with far less resource contention.
In the next sections, you’ll learn the steps to set up this architecture using Symfony Messenger as one example, and see how to configure, run, and monitor your background log consumer for robust, scalable logging. While we use Symfony for illustration, these patterns apply to almost any app framework or queueing tech—if you need audit logs to keep up, queue transport is the proven fix.
Install Bundle and Configure Symfony Messenger for Audit Log Queueing
- Install the Messenger Bundle: For Symfony apps, add the Messenger component with composer require symfony/messenger to enable asynchronous messaging infrastructure.
- Configure Your Transport: Define a queue transport in your Symfony config, using a local stack (Doctrine, Redis) or cloud queue (RabbitMQ, Azure Service Bus), tailored to your scale needs.
- Set Up Audit Event Handlers: Code your audit log write logic as a Messenger handler so events are pushed onto the queue, not written directly to your storage or database.
- Check Framework Compatibility: For non-Symfony environments, identify equivalent queue bundles/modules—most modern frameworks (Node, .NET, Java) provide similar async queue plugins.
Running the Audit Log Consumer and Monitoring Service Health
- Start the Consumer Process: Run your background worker, like php bin/console messenger:consume audit, to pull queued audit events and process them asynchronously into your log database.
- Monitor Queue Metrics: Watch queue depth, processing time, and failed job counts using built-in dashboards or external tools—early spikes can signal trouble or backlog.
- Track Consumer Lag: Keep an eye on “consumer lag” (how many unprocessed messages sit on the queue)—high lag means logs are dribbling in late, which is what you’re trying to avoid.
- Automate Alerts: Set up alerts for stalled consumers or oversized queues. Silent failures here can mean silent compliance risks downstream, so a healthy consumer is top priority.
Inside the Asynchronous Logging Mechanism: How It Works Under the Hood
At its core, asynchronous audit logging breaks the tight link between what your app does and when data lands in your log store. When your application needs to log an audit event—maybe a user login or file change—it creates a log record and places it on a queue, like RabbitMQ or Azure Service Bus, instead of writing immediately to disk or a database.
The queued message then waits its turn to be picked up by a background consumer or worker. This consumer reads messages in batches or asynchronously, and commits them to persistent storage (like an audit database or cloud logging service). The beauty of this setup? Your main app never needs to wait on slow storage or downstream service bottlenecks, massively boosting throughput and reliability.
Failures—say, a database crash—won’t drop your audit events, because messages stick around in the queue until handled or retried. Best practices involve setting up dead-letter queues for failed messages, heartbeat monitoring for worker health, and tracking both message age and processing time metrics. With this pattern, your audit trail maintains integrity, even under extreme system load.
Data Benchmarks: Measuring Audit Log Delay Before and After the Fix
Real-world benchmarks show dramatic improvements after shifting to async, queue-based audit logging. In synchronous setups, log processing latency can spike from milliseconds to several seconds or even minutes under high load, with observable slowdowns in user-facing transactions and background tasks.
After migration, async architectures regularly deliver audit logs with 5–10x better throughput. Typical latency drops from several seconds down to under 100 milliseconds per log record, even at high event rates. Resource usage smooths out, reducing CPU spikes and freeing up memory for core application functions. Case studies from 2023 back this up: organizations routinely cut log-related compute overhead by 40%–60%, turning audit delays from a compliance risk to a solved problem with measurable ROI.
Getting Answers and Support from Google Cloud and Microsoft
- Contact Provider Support: If your audit logs are consistently delayed despite local fixes, reach out to Google Cloud or Microsoft’s official support—platform-level issues or backend outages may be in play.
- Document the Delay: Provide detailed logs and timestamps to help support teams diagnose ingestion pipeline or reporting bugs.
- Use Community Channels: When official channels stall, head to trusted forums—submit your answer or troubleshooting case and track responses from peers and experts familiar with your platform.
- Review Security and Compliance Guidance: Microsoft 365 admins may find actionable tips for monitoring data loss and security in this podcast episode on DLP and Copilot, which often ties back to audit log health.
Engage with Top Comments, Community Categories, and Recent Posts
- Scan Top Comments: Tap into real-world troubleshooting from peers—check the comment sections for valuable insights on audit logging challenges and solutions.
- Browse Related Categories: Dive into curated categories for focused discussion—see what’s trending or unresolved by checking out sections like Categories.
- Use Search and Archives: Looking for legacy guidance or repeating troubles? Sift through past posts in the Archives for hidden gems and lessons learned.
- Subscribe to Updates: Stay ahead by subscribing to the site’s RSS feed or notifications—fresh posts can often respond fastest to new audit logging issues or vendor changes.
Conclusion: Key Takeaways for Long-Term Audit Log Optimization
Fixing audit log delays means confronting the root cause: blocking, synchronous writes just can’t cope at cloud scale. By switching to async queue-based architectures, you break the bottlenecks and put reliability—and timeliness—back into your logging process. Remember, healthy audit logging isn’t a fire-and-forget affair; it needs ongoing validation and proactive monitoring to stay robust, especially as your stack evolves.
Integrate audit log health with your broader compliance and governance routines, so reporting and incident response never suffer silent failures. For inspiration on weaving auditable controls into enterprise systems, see this deep-dive into real-time, automatable compliance architecture at Anatomy of an Auditable ESG Stack. Keep optimizing—your security, compliance, and peace of mind depend on it.

Founder of M365 Show, M365con.net & m365.fm
Mirko Peters is a Microsoft 365 expert, content creator, and founder of m365.fm, a platform dedicated to sharing practical insights on modern workplace technologies. His work focuses on Microsoft 365 governance, security, collaboration, and real-world implementation strategies.
Through his podcast and written content, Mirko provides hands-on guidance for IT professionals, architects, and business leaders navigating the complexities of Microsoft 365. He is known for translating complex topics into clear, actionable advice, often highlighting common mistakes and overlooked risks in real-world environments.
With a strong emphasis on community contribution and knowledge sharing, Mirko is actively building a platform that connects experts, shares experiences, and helps organizations get the most out of their Microsoft 365 investments.
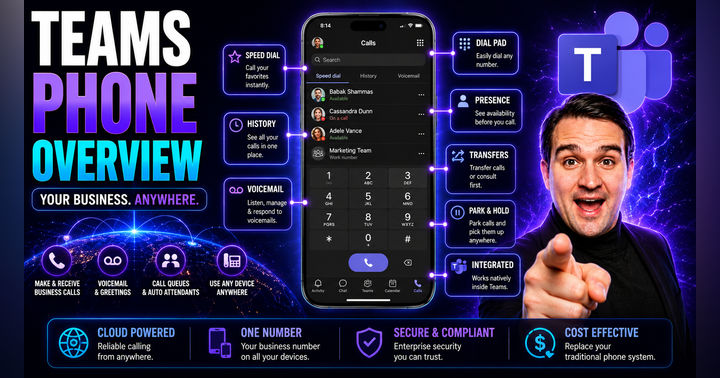
Microsoft Teams Phone Overview: Transforming Communication for Modern Businesses