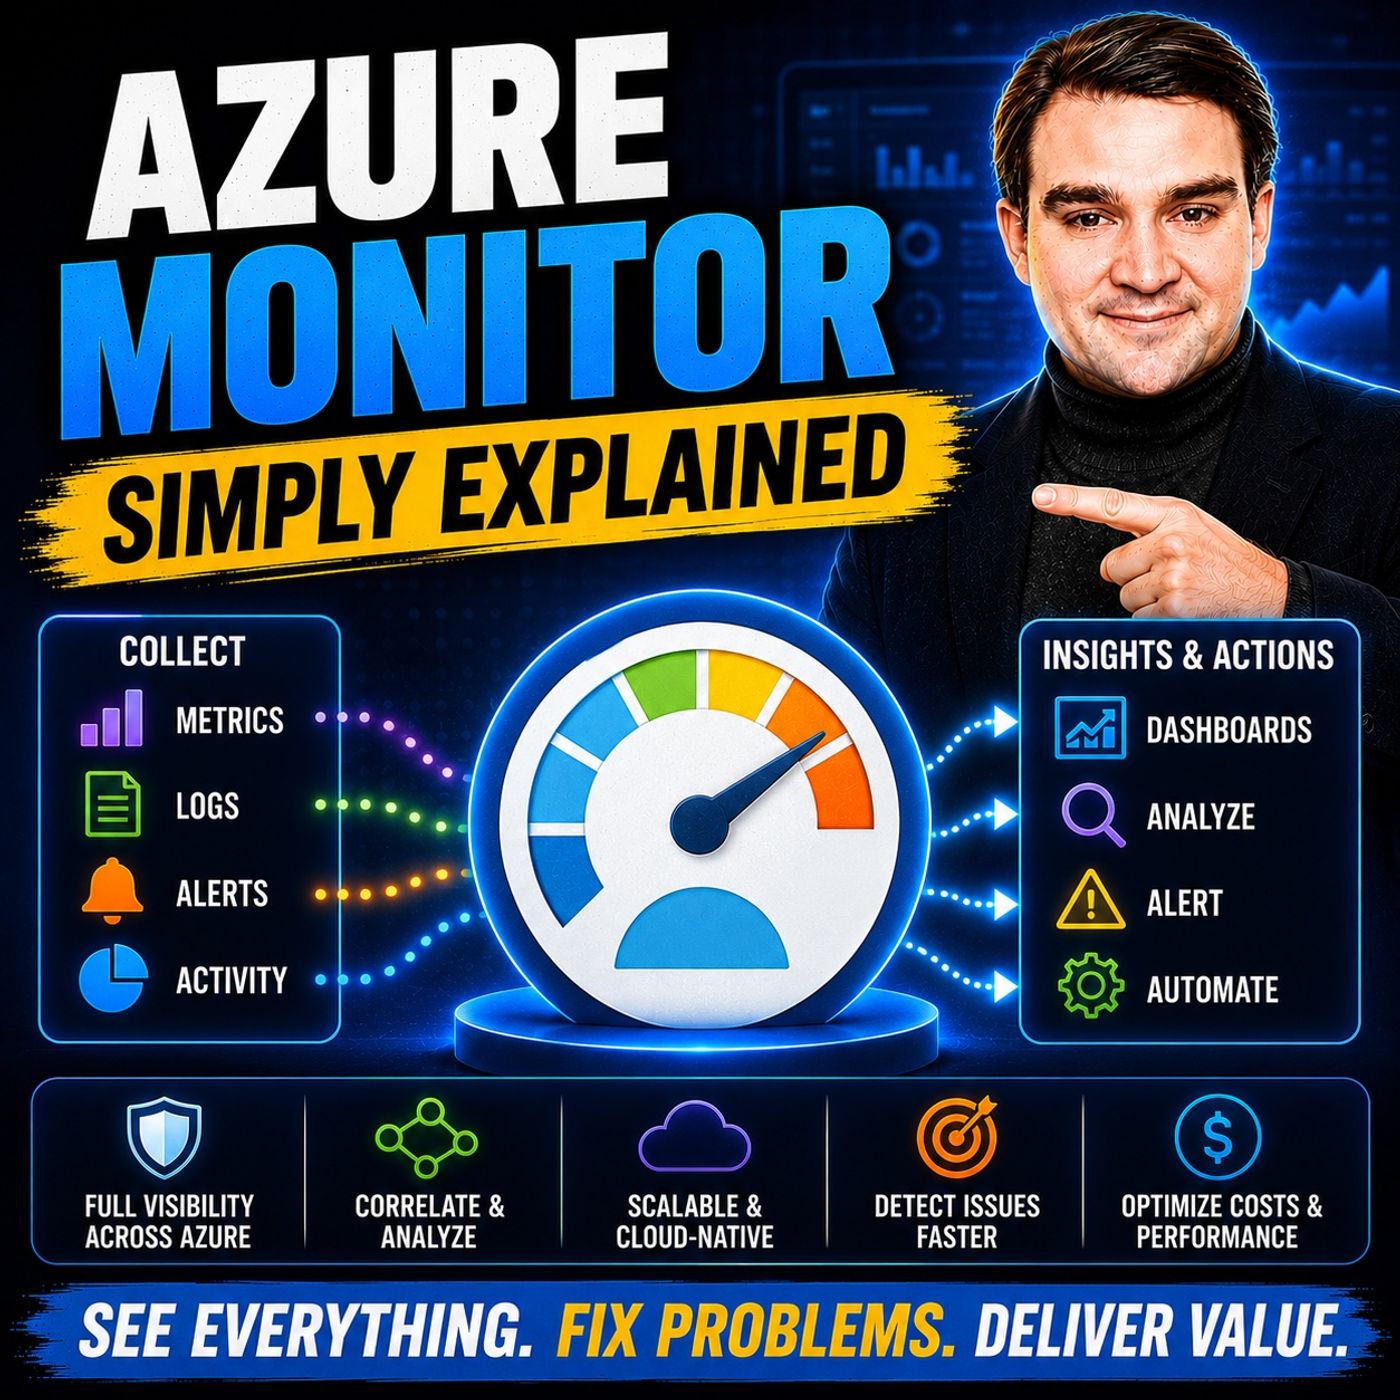
Mastering Cost Management in Azure Monitor
Welcome back to the podcast companion blog! In today's post, we are diving deep into a topic that keeps many cloud architects, developers, and IT administrators up at night: cost management in Azure Monitor. As cloud environments scale to meet growing enterprise demands, monitoring data tends to balloon right along with them. Without proper oversight, your monthly Azure bill can quickly spiral out of control simply due to the sheer volume of logs, metrics, and telemetry being ingested.
Fortunately, maintaining deep operational visibility and observability does not mean you have to break the bank. By implementing smart configuration strategies, leveraging modern data pipelines, and adopting a proactive governance mindset, you can drastically reduce your monitoring spend. If you want a foundational understanding of how these concepts fit together, be sure to check out our related podcast episode, Azure Monitor — Simply Explained. Let us explore the actionable strategies you can use today to master your Azure Monitor costs.
Introduction to Azure Monitor Cost Management
Azure Monitor is undeniably the lifeblood of modern cloud operations. It collects, analyzes, and acts on telemetry from your entire Azure infrastructure, hybrid architectures, and applications. However, this level of comprehensive telemetry comes with a pricing model primarily driven by data ingestion and retention. When teams spin up new environments without establishing guardrails for logging, ingestion rates skyrocket.
Cost management in Azure Monitor is not about cutting corners or flying blind. Rather, it is about intentional design. It requires understanding the difference between valuable telemetry that drives business resilience and redundant data that merely inflates your invoice. By treating telemetry data as a finite resource that requires optimization, organizations can achieve a healthy balance between absolute observability and strict financial discipline.
Understanding Azure Monitor Pricing and Ingestion
To effectively manage and lower your cloud monitoring bills, you must first understand how Azure calculates those costs. The vast majority of your Azure Monitor expenses originate from the Log Analytics workspace. Specifically, you are billed based on two primary factors: the volume of data ingested (measured in gigabytes per day) and the duration of data retention.
Standard pay-as-you-go ingestion charges can accumulate rapidly if every application component, container, and network interface is configured to output verbose debugging logs by default. Furthermore, long-term retention policies can silently compound these costs over months and years. Recognizing how data flows into your workspaces allows you to identify noisy sources—such as runaway application loops, excessive web requests, or verbose trace statements—that contribute heavily to your daily ingestion quota without providing proportional operational value.
Transitioning to Workspace-Based Application Insights
One of the single most impactful architectural shifts you can make to control your monitoring expenses is migrating your legacy classic Application Insights resources over to the modern workspace-based model.
Legacy Application Insights stored its data in isolated, proprietary silos, which limited your flexibility in applying cost-saving features. Workspace-based Application Insights, on the other hand, directs all application telemetry straight into a standard Log Analytics workspace. This unification unlocks powerful native cost optimization tools, such as:
- Basic Logs: A lower-cost ingestion tier designed for high-volume, verbose diagnostic logs that you may need for troubleshooting or compliance audits, but do not require heavy interactive analytics.
- Commitment Tiers: Similar to Azure reserved instances, these pricing tiers allow you to commit to a daily data volume threshold in exchange for a significantly discounted per-gigabyte rate.
- Unified Data Governance: Centralizing your application telemetry alongside infrastructure logs makes it much easier to apply data retention rules, access controls, and query budgets across your entire environment.
Implementing Telemetry Sampling and Tuning
Not every single transaction, heartbeat, and HTTP request needs to be recorded with 100% fidelity to give you a clear picture of application health. This is where telemetry sampling becomes an essential weapon in your cost-optimization arsenal.
Application Insights and the broader Azure Monitor agent framework support both fixed-rate and adaptive sampling. Adaptive sampling, in particular, automatically adjusts the volume of telemetry sent from your application based on traffic spikes, ensuring that you stay beneath a designated maximum telemetry rate without manually tuning parameters every time traffic surges.
Beyond sampling, you should perform regular audits of your instrumentation settings. Developers often enable verbose logging during local testing and inadvertently push those configurations to production. By pruning unneeded instrumentation, limiting excessive Ajax call tracking, and filtering out routine, uninformative health-probe requests, you can dramatically trim the fat from your daily telemetry streams while retaining full visibility into actual system anomalies and user errors.
Optimizing Data Retention and Log Management
Data retention is another area where costs can quietly creep upward. By default, Log Analytics workspaces retain data for 30 days at no additional charge (for basic tiers) or up to 730 days for older pricing models, with charges applying to data stored beyond the included retention period.
To optimize this aspect of your architecture, you should establish tiered retention strategies tailored to the actual lifecycle of your data:
- Short-Term Interactive Retention: Keep operational logs, performance metrics, and security traces accessible in your active workspace for a shorter duration (e.g., 30 to 90 days) where fast Kusto Query Language (KQL) querying is critical for incident response.
- Archival and Export: For compliance frameworks that demand multi-year data retention, export your logs out of Log Analytics into lower-cost storage solutions, such as Azure Storage accounts using cool or archive tiers. You can still query this archived data selectively using tools like Azure Data Explorer if needed, without paying premium Log Analytics storage rates.
- Table-Level Retention Policies: Take advantage of Azure Monitor's ability to configure retention on a per-table basis. High-volume, low-value tables can be set to expire quickly, while critical audit logs can be retained longer.
Leveraging OpenTelemetry for Cost-Effective Metrics
As modern cloud-native applications scale, developers increasingly rely on open standards like OpenTelemetry to instrument microservices and distributed systems. OpenTelemetry provides a vendor-neutral framework for generating and collecting traces, metrics, and logs.
Leveraging OpenTelemetry metric instruments offers distinct cost advantages. Because OpenTelemetry allows you to aggregate metrics at the source before they cross the wire into Azure Monitor, you avoid transmitting massive volumes of raw, unaggregated data points. Pre-aggregating performance metrics—such as calculating request latency percentiles or error rate counters locally within the application runtime—reduces network bandwidth overhead and lowers the volume of data ingestion events processed by your cloud monitoring backend.
Best Practices for Long-Term Azure Monitoring Budgeting
Mastering cost management in Azure Monitor is not a one-time project; it is an ongoing operational discipline. To ensure your monitoring bills remain predictable over the long term, incorporate these core best practices into your cloud governance framework:
- Set Up Daily Cap and Alerting: Configure a daily volume cap on your Log Analytics workspaces to prevent unexpected cost explosions caused by runaway scripts or sudden DDoS attacks. Pair this cap with budget alerts that notify your engineering leads the moment daily ingestion crosses predefined thresholds.
- Regularly Audit KQL Queries and Dashboards: Inefficient queries run against massive log tables consume heavy compute resources. Periodically review your Azure Workbooks and Grafana dashboards to ensure they are properly optimized and not unnecessarily re-scanning petabytes of historical data.
- Foster a Cost-Aware Engineering Culture: Educate your development teams on the financial impact of verbose logging. Treat telemetry design as an architectural requirement during code reviews, just like security and performance.
By implementing these strategic controls, you can build a resilient, highly observable cloud environment that scales gracefully without producing unpleasant financial surprises at the end of the month.
To hear more about designing efficient observability architectures and setting up reliable telemetry signals, make sure to listen to the companion episode, Azure Monitor — Simply Explained, where we break down these core concepts and show you how to maximize operational performance across your entire Microsoft ecosystem.

Microsoft MVP | Host of M365.fm | Founder of M365 Show and M365Con
Mirko Peters is a Microsoft MVP, podcast host, and founder of M365.fm, M365 Show, and M365Con. His work connects Microsoft practitioners through podcast interviews, livestreams, and community events.
At M365.fm, Mirko hosts conversations with Microsoft MVPs, product experts, architects, and community contributors. Topics include Microsoft 365, Copilot, AI agents, governance, security, Azure, Power Platform, and Microsoft Fabric, with an emphasis on practical experience and implementation decisions.
M365.fm is the podcast and learning platform. M365 Show brings experts together for livestreams, while M365Con provides an online conference setting for community learning.
Official website: Mirko Peters (https://www.mirkopeters.com/). Recognition: Mirko Peters — Microsoft MVP profile (https://mvp.microsoft.com/de-DE/mvp/profile/9b0ca797-db5a-493a-a845-8b9158046cf5). Connect on LinkedIn (https://www.linkedin.com/in/m365showpodcast/).