


 Apple Podcasts
 Spotify
 Youtube Music
 Spreaker
 Podchaser
 Amazon Music
 Azure Monitor — Simply Explained
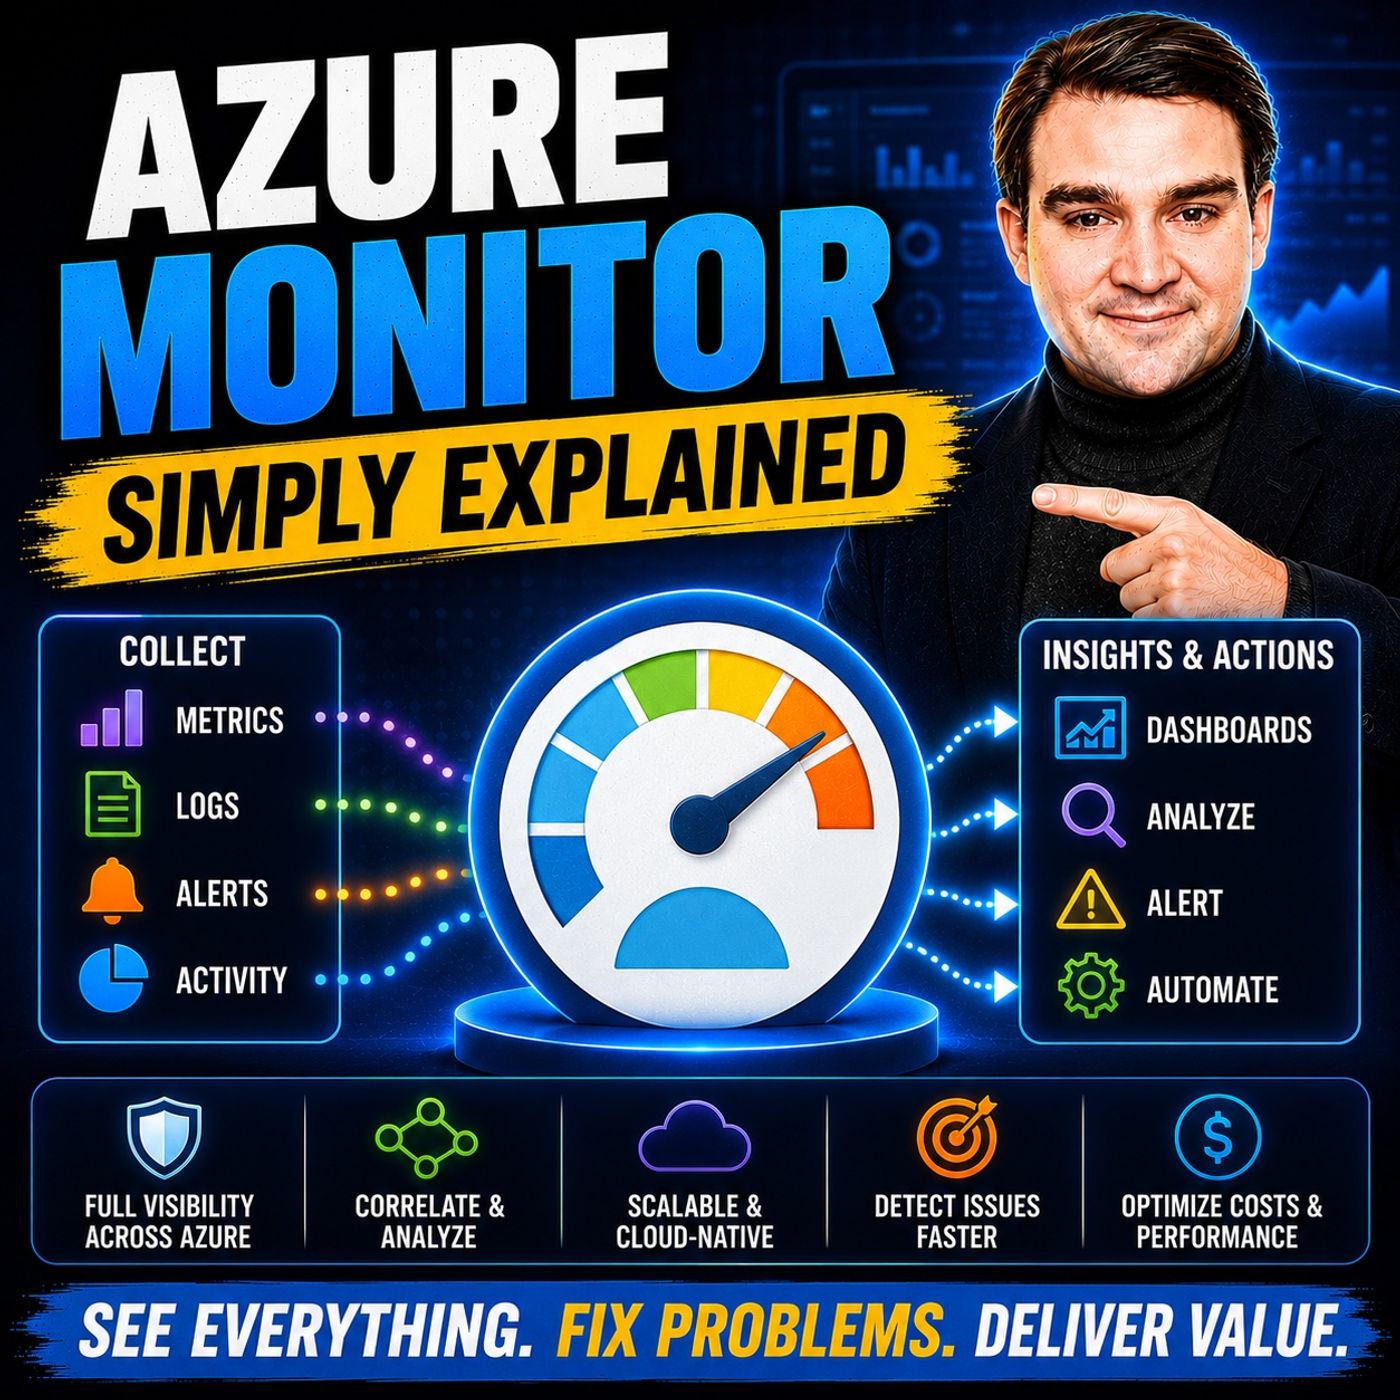
Azure Monitor is Microsoft's comprehensive monitoring and observability platform that helps organizations understand the health, performance, and availability of their cloud and on-premises environments. Instead of manually checking servers, applications, and services, Azure Monitor continuously collects metrics, logs, traces, and events, giving IT teams real-time visibility into everything running across their infrastructure.
In this episode, you'll learn what Azure Monitor is, how it works, and why monitoring is essential for building reliable cloud solutions. The discussion explains the core components of Azure Monitor, including Metrics, Log Analytics, Application Insights, Alerts, Workbooks, and Dashboards, showing how they work together to detect issues before users are affected. You'll also discover how Azure Monitor integrates with virtually every Azure service to provide centralized monitoring and actionable insights.
The episode explores practical scenarios such as monitoring virtual machines, Azure Functions, Kubernetes clusters, databases, web applications, and enterprise workloads. You'll learn how to create intelligent alerts, analyze performance trends, troubleshoot failures with Kusto Query Language (KQL), and use Application Insights to understand application performance, user behavior, dependencies, and exceptions. The discussion also covers automation, proactive incident response, and integration with Microsoft Sentinel, Azure Automation, and ITSM platforms for end-to-end operational visibility.
Finally, you'll understand when to use Azure Monitor, how it supports modern observability practices, and the best practices for collecting only the data you need while managing monitoring costs. By the end of this episode, you'll have a clear understanding of Azure Monitor, helping you build secure, resilient, and highly available Azure environments with confidence.
Quick answer: Azure Monitor collects, analyzes, and acts on telemetry from Azure resources, applications, and infrastructure. This episode explains metrics, logs, alerts, workbooks, and monitoring design choices so teams can detect issues quickly and make operational decisions from dependable signals.
In today's cloud environments, Azure Monitor serves as a vital tool for monitoring Azure services. This platform allows you to collect, analyze, and act on telemetry data from both cloud and hybrid environments. By doing so, Azure Monitor maximizes performance and ensures availability. It helps you address potential issues proactively, often before they disrupt your business operations. With the capability to handle terabytes of data daily, Azure Monitor guarantees reliable performance across regions, backed by Azure's service-level agreements.
Key Takeaways
- Azure Monitor is essential for monitoring Azure services and ensuring performance and availability.
- It collects data from both cloud and on-premises environments, providing a complete view of your infrastructure.
- Setting up alerts helps you identify and address issues before they impact users, enhancing operational efficiency.
- Utilizing Azure Workbooks allows for customizable reports and interactive data visualizations, improving analysis.
- Implementing cost management strategies can help control expenses while maintaining effective monitoring.
- Azure Monitor integrates with various Azure resources, offering insights into their performance and health.
- Automation features reduce manual work, allowing teams to focus on strategic initiatives and improve response times.
- Regularly reviewing and optimizing dashboards ensures they meet changing business needs and maintain relevance.
Azure Monitor Overview
Importance of Azure Monitoring
Azure Monitor plays a crucial role in managing your cloud environment effectively. It is designed to monitor all Azure Infrastructure-as-a-Service (IaaS) and Platform-as-a-Service (PaaS) services, as well as applications and code. This capability extends to on-premises resources and other cloud environments, making Azure Monitor a versatile tool for comprehensive oversight.
The significance of Azure monitoring lies in its ability to enhance operational reliability and observability. Here are some key functions that illustrate its importance:
- Data Collection: Azure Monitor gathers and consolidates data from various Azure and non-Azure environments into a unified platform. This ensures you have a complete view of your infrastructure.
- Alerting: The platform identifies potential issues and allows for proactive measures through Alert Rules and Action Groups. This means you can address problems before they impact your users.
- Performance Optimization: Azure Monitor utilizes Autoscale to adjust resources based on demand. This ensures optimal service performance, especially during peak usage times.
By leveraging Azure Monitor, you can achieve several benefits that contribute to operational reliability:
- Resilience: Predictive alerts reduce downtime, while faster root cause analysis (RCA) speeds up recovery.
- Cost Control: Forecasting demand prevents over-provisioning and wasted spending.
- Agility: Developers can move faster knowing the system has intelligent guardrails.
- Security Alignment: Operational anomalies often overlap with security signals, helping strengthen cloud-native security information and event management (SIEM) integrations.
Azure Monitor Key Features
Data Collection and Analysis
Azure Monitor excels in data collection and analysis, providing you with a comprehensive view of your cloud environment. It aggregates data from various sources, allowing you to capture logs and metrics in a centralized store. This capability ensures that you can monitor both Azure resources and on-premises infrastructure effectively.
The platform supports resilient data pipelines that process large volumes of data, accommodating fluctuations in usage while maintaining reliability. You can interpret stored data easily, enhancing your ability to query and visualize information. Advanced analysis features, such as anomaly detection, help you identify unusual patterns, enabling proactive issue resolution.
Here are some essential functionalities of Azure Monitor related to data collection and analysis:
- Data aggregation: Seamlessly view and incorporate all data sources.
- Data ingestion: Process large volumes of data efficiently.
- Data storage: Utilize a consolidated data store that supports growth.
- Data processing: Enhance your query and visualization capabilities.
- Data analysis: Interpret data effectively with advanced features.
Alerts and Automation
Azure Monitor's alerting and automation features significantly enhance your monitoring capabilities. You can configure alerts based on specific metrics or log queries, ensuring you receive real-time notifications about potential issues. This proactive approach allows you to address problems before they impact your users.
The types of alerts available include:
- Simple log search alerts: Ideal for monitoring applications and network traffic.
- Activity log alerts: Notify you of specific events, such as resource creation or deletion.
- Metric alerts: Monitor resource metrics at regular intervals.
- Log search alerts: Evaluate resource logs using Log Analytics queries.
Automation features, such as Logic Apps and Runbooks, enable you to respond to alerts promptly. This reduces the need for manual intervention, allowing your team to focus on strategic initiatives. By integrating AI insights with automation scripts, you can implement proactive measures, such as automatically restarting failing services.
Cost Management in Azure Monitoring
Cost management is a critical aspect of using Azure Monitor effectively. The platform's pricing is based on the volume of data ingested by the Log Analytics workspace, measured in gigabytes per day. To optimize your usage and minimize costs, consider the following recommendations:
| Recommendation | Benefit |
|---|---|
| Change to workspace-based Application Insights. | Apply new cost-saving tools like Basic Logs and commitment tiers. |
| Use sampling to tune the amount of data collected. | Reduce telemetry sent with minimal distortion of metrics. |
| Limit the number of Ajax calls. | Decrease reported data, lowering costs. |
| Disable unneeded instrumentation. | Collect only necessary signals to cut costs. |
| Use OpenTelemetry metric instruments. | Aggregate metrics to reduce data volume. |
By implementing these strategies, you can manage your Azure monitoring costs effectively while maintaining visibility into your cloud environment.
Data Sources for Azure Monitoring
Azure Resources
Azure Monitor integrates seamlessly with various Azure resources, allowing you to gather essential telemetry data. This integration ensures you have a comprehensive view of your cloud environment. Here are some key Azure resources that you can monitor:
- Azure Active Directory
- Logic Apps
- Service Bus queues and Topics
- Event Hubs
- Event Grids
- Function Apps
By monitoring these resources, you gain insights into their performance and health. This visibility helps you identify issues quickly and take corrective actions before they impact your users.
On-Premises and Hybrid Environments
Azure Monitor also extends its capabilities to on-premises and hybrid environments. This flexibility is crucial for organizations that operate across multiple platforms. Here’s how Azure Monitor integrates with these environments:
| Evidence | Description |
|---|---|
| Azure Arc | Azure Arc enables monitoring of private clouds, providing a centralized view of resources and enhancing security monitoring capabilities. |
| Data Export | Azure Monitor allows for the export of monitoring data to integrate with third-party and open-source tools, streamlining workflows. |
| Hybrid Monitoring | Organizations can leverage tools to integrate monitoring data from both on-site and cloud resources into a single platform for comprehensive analysis. |
Collecting data from both Azure and on-premises sources offers several benefits. It creates a unified monitoring experience, combining insights from different environments. This holistic view allows you to make informed decisions based on comprehensive data.
Here are some advantages of this approach:
| Benefit | Description |
|---|---|
| Unified Monitoring | Combines data from Azure and on-premises for a holistic view. |
| Informed Decision-Making | Provides insights that help leaders make better choices. |
| Proactive Issue Resolution | Enables early detection of issues before they escalate. |
| Enhanced Performance | Optimizes the performance of applications and infrastructure. |
| Increased Productivity | Streamlines operations, allowing teams to focus on critical tasks. |
| Scalability | Adapts to growing data needs from both environments. |
By leveraging Azure Monitor, you can collect and analyze telemetry data from both cloud and on-premises environments. This capability offers real-time visibility and proactive alerts, ensuring you stay ahead of potential issues.
Azure Monitoring Tools and Integrations
Azure Monitor offers a variety of tools that enhance your ability to visualize and analyze data. These tools help you gain insights into your cloud environment and improve your monitoring capabilities. Here are some key tools available within Azure Monitor:
- Azure Workbooks: A flexible canvas for data analysis and rich visual reports.
- Grafana: An open platform for operational dashboards, supporting Azure Monitor and Azure Managed Prometheus.
- Azure Dashboards: Provides a single view of Azure infrastructure and services.
- Power BI: Useful for creating business-centric dashboards and analyzing long-term KPI trends.
Azure Monitor Workbooks
Azure Workbooks serve as a powerful tool for custom reporting and data visualization. They allow you to create interactive reports that can aggregate data from multiple sources. This feature enables you to analyze your data comprehensively. Here are some key features of Azure Workbooks:
| Feature | Description |
|---|---|
| Customization | Template-based with full KQL control |
| Sharing | Basic RBAC and RBAC with managed identity |
| Cost Analysis | Basic metrics and advanced cost queries with joins |
| Conditional Logic | Dynamic show/hide sections |
| Visualization | Interactive dashboards with parameters and drill-downs |
With Azure Workbooks, you can create various interactive visualizations, such as charts, tables, and maps. You can also filter data directly on the dashboard using dynamic parameters. This flexibility allows you to tailor your reports to meet specific needs. Additionally, you can share workbooks with colleagues, facilitating collaboration.
Application Insights
Application Insights complements Azure Monitor by providing detailed application-level monitoring. This tool focuses on performance and availability telemetry, helping you understand how your applications behave. Here’s how Application Insights enhances your monitoring strategy:
| Feature/Aspect | Application Insights | Loupe |
|---|---|---|
| Focus | Performance and availability telemetry | Detailed log data and error management |
| Level of Insight | Macro-level understanding of application behavior | Micro-level traces of application activity |
| Data Storage | Primarily by deployed environment | By product & application |
| Error Management | Basic error tracking | Advanced error aggregation and analysis |
| Use Case | High volume applications | Detailed error analysis across versions |
By integrating Application Insights with Azure Monitor, you gain a macro-level understanding of your application's performance. This integration allows you to track errors and performance issues effectively. You can also automate responses to alerts using Azure Logic Apps, further enhancing your monitoring capabilities.
Best Practices for Azure Monitoring
Setting Up Alerts
Setting up alerts effectively is crucial for maintaining operational efficiency in Azure. Here are some best practices to consider:
- Categorize alerts by criticality: Prioritize alerts based on their importance. This approach helps you avoid alert fatigue and ensures that you focus on issues that require immediate attention.
- Automate responses with Logic Apps: Use automation to resolve common issues without manual intervention. This speeds up incident resolution and reduces downtime.
- Use dynamic thresholds for metric alerts: Dynamic thresholds adapt to changing workloads, minimizing false positives and ensuring you only receive relevant notifications.
- Minimize log search alert frequency: Reducing the frequency of log queries helps control costs while maintaining operational efficiency.
- Utilize resource health and service health alerts: These alerts provide proactive notifications about critical events, allowing you to take timely action.
- Monitor multiple resources with a single rule: This simplifies management and reduces costs by consolidating alerts into fewer rules.
- Secure alert workflows with managed identities: Enhance security by managing access to Azure resources without handling secrets.
Proactive monitoring is essential for ensuring smooth operations in Azure. By enabling Service and Resource Health alerts, you gain timely notifications about Azure-wide or resource-specific issues. This capability helps reduce mean time to resolution (MTTR) and empowers you to act quickly, minimizing business impact.
Utilizing Dashboards
Dashboards in Azure Monitor are powerful tools for real-time monitoring and decision-making. To maximize their effectiveness, consider the following tips:
- Ensure strict governance for your dashboards. This step guarantees trust and reliability in the data presented.
- Leverage Azure Log Analytics with Power BI to gain immediate visibility into system performance and issues. This integration allows you to visualize data effectively and make quick decisions.
- Establish a clear flow from application telemetry to structured insights in Power BI. This architecture facilitates rapid analysis and informed decision-making.
Regularly reviewing and optimizing your dashboards is vital. This practice ensures that you adapt to changing business needs and maintain the relevance of your monitoring strategy. By implementing these best practices, you can enhance your Azure monitoring capabilities and ensure that your cloud environment operates at peak performance.
Azure Monitor is essential for managing your Azure services effectively. It offers a comprehensive suite of tools that provide real-time insights into your infrastructure and applications. By leveraging Azure Monitor, you can ensure continuous monitoring, which enhances the performance and reliability of your cloud environment.
Key features include data collection from various sources, proactive problem resolution, and metrics that track performance. These capabilities empower you to identify issues early and maintain optimal service availability. Embrace Azure Monitor to enhance your cloud operations and achieve greater reliability.
FAQ
What is Azure Monitor?
Azure Monitor is a comprehensive observability platform that collects and analyzes telemetry data from your cloud and on-premises environments. It helps you ensure performance, reliability, and security across your applications and infrastructure.
How does Azure Monitor collect data?
Azure Monitor collects data through various sources, including Azure resources, on-premises servers, and other cloud platforms. It gathers metrics and logs, providing a unified view of your environment.
Can I set up alerts in Azure Monitor?
Yes, you can set up alerts based on specific metrics or log queries. This feature allows you to receive notifications about potential issues, enabling proactive management of your resources.
What are Azure Workbooks?
Azure Workbooks are customizable reports that allow you to visualize and analyze data from Azure Monitor. You can create interactive dashboards to gain insights into your cloud environment.
How does Azure Monitor help with cost management?
Azure Monitor offers various pricing tiers based on data ingestion volume. You can optimize costs by using sampling, limiting data collection, and adjusting log retention settings.
Is Azure Monitor suitable for hybrid environments?
Absolutely! Azure Monitor integrates seamlessly with both Azure and on-premises resources. This capability provides a comprehensive view of your entire infrastructure, regardless of where it resides.
What is Application Insights?
Application Insights is a feature of Azure Monitor that focuses on application performance and availability. It helps you track user interactions, detect issues, and improve overall application health.
How can I improve my Azure monitoring strategy?
To enhance your Azure monitoring strategy, regularly review alerts, utilize dashboards, and automate responses to common issues. This approach ensures you maintain optimal performance and quickly address potential problems.
🎧 Listen to this episode
Want a practical explanation of Azure Monitor? This episode breaks down the topic in clear language and shows why it matters for Microsoft 365, Azure, Power Platform, security, AI, and modern work.
Listen to this episode if you want to:
- Understand the key concepts behind Azure Monitor
- See how it fits into the wider Microsoft technology ecosystem
- Learn where it can create practical value for your organization
You may also enjoy these related M365 FM episodes:
- Monitor Business Central Telemetry with Power BI
- Monitor Compliance in Microsoft Defender for Cloud
- Monitor Microsoft Fabric Data Pipelines
Discover more practical Microsoft conversations on M365 FM.
Last reviewed: July 2026.
Who Should Listen
This episode is for Azure administrators, architects, developers, and IT leaders who need a practical foundation before designing, governing, or operating this service.
🎧 You Should Also Listen To
- Azure Log Analytics — A practical next step for extending this topic.
- Azure Alerts — A practical next step for extending this topic.
- Azure Application Insights — A practical next step for extending this topic.
🚀 Want to be part of m365.fm?
Then stop just listening… and start showing up.
👉 Connect with me on LinkedIn and let’s make something happen:
- 🎙️ Be a podcast guest and share your story
- 🎧 Host your own episode (yes, seriously)
- 💡 Pitch topics the community actually wants to hear
- 🌍 Build your personal brand in the Microsoft 365 space
This isn’t just a podcast — it’s a platform for people who take action.
🔥 Most people wait. The best ones don’t.
👉 Connect with me on LinkedIn and send me a message:
"I want in"
Let’s build something awesome 👊
1
00:00:00,000 --> 00:00:04,360
Today's topic is one that almost everyone has heard of, but few people actually understand.
2
00:00:04,360 --> 00:00:08,160
You've probably seen as your monitor in the portal and maybe clicked around a bit, only
3
00:00:08,160 --> 00:00:09,560
to feel lost.
4
00:00:09,560 --> 00:00:10,560
That's completely normal.
5
00:00:10,560 --> 00:00:11,560
Here's the real problem.
6
00:00:11,560 --> 00:00:14,920
You've got one dashboard for your virtual machines, another for your apps, another for
7
00:00:14,920 --> 00:00:17,240
security, and none of them talk to each other.
8
00:00:17,240 --> 00:00:20,880
When something breaks, you're jumping between five different screens, trying to piece
9
00:00:20,880 --> 00:00:21,880
together what happens.
10
00:00:21,880 --> 00:00:23,680
So what if you could see everything?
11
00:00:23,680 --> 00:00:27,400
Matrix, logs, alerts, even identity and email all in one place?
12
00:00:27,400 --> 00:00:31,640
By the end of this episode, you'll understand what Azure Monitor actually is and how it
13
00:00:31,640 --> 00:00:33,680
gives you that single pane of glass.
14
00:00:33,680 --> 00:00:34,920
The big picture.
15
00:00:34,920 --> 00:00:36,440
What is Azure Monitor?
16
00:00:36,440 --> 00:00:38,200
So what exactly is Azure Monitor?
17
00:00:38,200 --> 00:00:40,080
Let's start with a simple definition.
18
00:00:40,080 --> 00:00:45,640
Azure Monitor is Microsoft's central observability platform for collecting, analyzing and acting
19
00:00:45,640 --> 00:00:46,920
on telemetry data.
20
00:00:46,920 --> 00:00:48,560
That's a mouthful, so let's break it down.
21
00:00:48,560 --> 00:00:50,200
Think of it like a modern office building.
22
00:00:50,200 --> 00:00:54,080
You've got a central security desk at the front entrance that desk sees everyone who comes
23
00:00:54,080 --> 00:00:57,640
in, which floor they go to, which room they enter, and when they leave.
24
00:00:57,640 --> 00:01:00,200
It's the single point of awareness for the entire building.
25
00:01:00,200 --> 00:01:02,160
Azure Monitor is exactly that for your cloud.
26
00:01:02,160 --> 00:01:05,440
It's the central nervous system that connects everything together.
27
00:01:05,440 --> 00:01:06,440
Here's the thing.
28
00:01:06,440 --> 00:01:08,000
Azure Monitor isn't a single tool.
29
00:01:08,000 --> 00:01:11,760
It's a platform that pulls together metrics, logs, traces, and alerts from Azure on
30
00:01:11,760 --> 00:01:13,560
premises and even other clouds.
31
00:01:13,560 --> 00:01:16,040
Twenty years ago, you'd buy separate products for everything.
32
00:01:16,040 --> 00:01:19,160
One tool for servers, another for apps, another for networks.
33
00:01:19,160 --> 00:01:21,920
They'd sit in silos, never sharing information.
34
00:01:21,920 --> 00:01:24,560
Azure Monitor replaces that fragmentation entirely.
35
00:01:24,560 --> 00:01:27,800
Now you might wonder, is this just for IT operations?
36
00:01:27,800 --> 00:01:28,800
Not at all.
37
00:01:28,800 --> 00:01:33,400
Azure Monitor actually underpins Microsoft Defender for Cloud and Microsoft Sentinel, so it's
38
00:01:33,400 --> 00:01:35,320
the foundation for security too.
39
00:01:35,320 --> 00:01:39,680
The same data platform that tells you your CPU is spiking also feeds your security tools.
40
00:01:39,680 --> 00:01:41,720
That's a powerful idea when you stop to think about it.
41
00:01:41,720 --> 00:01:42,720
But let's get specific.
42
00:01:42,720 --> 00:01:46,520
Azure Monitor handles two main types of data, and understanding the difference between
43
00:01:46,520 --> 00:01:49,600
them is key to understanding the whole platform.
44
00:01:49,600 --> 00:01:52,040
Two building blocks, metrics and logs.
45
00:01:52,040 --> 00:01:53,440
Let's start with metrics.
46
00:01:53,440 --> 00:01:57,800
Their numerical values collected at regular intervals, think of them as your vital signs,
47
00:01:57,800 --> 00:02:01,080
like heart rate, blood pressure, or body temperature.
48
00:02:01,080 --> 00:02:02,560
They show you how things are doing right now.
49
00:02:02,560 --> 00:02:07,120
In Azure Monitor, metrics look like CPU percentage, memory usage, or disc reads per second.
50
00:02:07,120 --> 00:02:10,600
They're lightweight and come in near real time, perfect for dashboards and triggers.
51
00:02:10,600 --> 00:02:12,440
You see a spike the moment it happens.
52
00:02:12,440 --> 00:02:14,240
Then you have logs which are completely different.
53
00:02:14,240 --> 00:02:17,800
They're detailed records of events like a diary or a black box recorder.
54
00:02:17,800 --> 00:02:22,000
The log entry tells you when someone restarted a virtual machine, what error code an application
55
00:02:22,000 --> 00:02:25,600
through, who signed in from where and at what exact time.
56
00:02:25,600 --> 00:02:28,040
Logs are much richer than metrics, but they're also bulkier.
57
00:02:28,040 --> 00:02:32,760
They live in a log analytics workspace, and you query them using something called kusto
58
00:02:32,760 --> 00:02:35,440
query language, or KQL for short.
59
00:02:35,440 --> 00:02:36,960
So here's the key difference.
60
00:02:36,960 --> 00:02:39,400
Metrics tell you something is wrong, logs tell you why.
61
00:02:39,400 --> 00:02:40,520
Imagine driving your car.
62
00:02:40,520 --> 00:02:43,960
The check engine light comes on, and that's a metric telling you something is wrong right
63
00:02:43,960 --> 00:02:45,720
now, but you don't know what.
64
00:02:45,720 --> 00:02:49,040
So you pull into a mechanic and they run a diagnostic report.
65
00:02:49,040 --> 00:02:52,240
That report tells you exactly which sensor failed and what coded through.
66
00:02:52,240 --> 00:02:53,240
That's the log.
67
00:02:53,240 --> 00:02:54,240
Metrics are the check engine light.
68
00:02:54,240 --> 00:02:56,160
Logs are the mechanics diagnostic report.
69
00:02:56,160 --> 00:02:57,160
You need both.
70
00:02:57,160 --> 00:02:58,520
Here's a quick practical detail.
71
00:02:58,520 --> 00:03:00,560
For free, you get 90 days of log retention.
72
00:03:00,560 --> 00:03:04,880
That's a good window for most troubleshooting, but if you need longer for compliance or auditing,
73
00:03:04,880 --> 00:03:06,080
you can extend it.
74
00:03:06,080 --> 00:03:08,880
Just remember, longer retention costs more, so plan for it.
75
00:03:08,880 --> 00:03:11,280
So now you understand the two building blocks.
76
00:03:11,280 --> 00:03:14,400
Metrics for the quick pulse check logs for the deep dive, but where does all this data
77
00:03:14,400 --> 00:03:15,400
actually come from?
78
00:03:15,400 --> 00:03:17,080
That's the next question.
79
00:03:17,080 --> 00:03:18,520
Where all the data comes from.
80
00:03:18,520 --> 00:03:20,840
Now, where does all this data actually come from?
81
00:03:20,840 --> 00:03:24,360
That's the interesting part because Azure Monitor doesn't just watch your virtual machines,
82
00:03:24,360 --> 00:03:25,680
it watches everything.
83
00:03:25,680 --> 00:03:27,440
Let's start with the easiest source.
84
00:03:27,440 --> 00:03:31,080
Every Azure resource you create, like virtual machines, databases, storage accounts, and
85
00:03:31,080 --> 00:03:37,160
app services automatically emits platform metrics, CPU usage, disk, IO, network throughput.
86
00:03:37,160 --> 00:03:38,160
This is built in.
87
00:03:38,160 --> 00:03:39,680
You don't have to configure anything.
88
00:03:39,680 --> 00:03:43,160
You get it for free the moment you create the resource, but that's just the surface.
89
00:03:43,160 --> 00:03:46,920
For your applications, you need application insights as your monitor's application performance
90
00:03:46,920 --> 00:03:48,240
management service.
91
00:03:48,240 --> 00:03:52,240
It tracks, request rates, response times, exceptions, and dependency calls.
92
00:03:52,240 --> 00:03:56,520
If your web app calls a database or an external API, application insights sees that call
93
00:03:56,520 --> 00:03:57,920
and measures how long it took.
94
00:03:57,920 --> 00:03:59,920
It's like having a detective inside your code.
95
00:03:59,920 --> 00:04:01,080
Now let's go deeper.
96
00:04:01,080 --> 00:04:05,160
The platform metrics we talked about tell you what Azure sees from outside your virtual machine,
97
00:04:05,160 --> 00:04:08,040
but they don't tell you what's happening inside the operating system.
98
00:04:08,040 --> 00:04:11,560
For that, you need the Azure Monitor agent, a small piece of software you install inside
99
00:04:11,560 --> 00:04:12,560
your VM.
100
00:04:12,560 --> 00:04:16,600
It collects OS level metrics and logs like memory pressure, disk queue length, and specific
101
00:04:16,600 --> 00:04:17,720
application crashes.
102
00:04:17,720 --> 00:04:20,760
This is where you see what's actually happening inside the machine.
103
00:04:20,760 --> 00:04:23,680
The good news is that same agent works outside Azure 2.
104
00:04:23,680 --> 00:04:27,560
If you have servers running on premises or in another cloud, you can use Azure Arc to connect
105
00:04:27,560 --> 00:04:28,560
them.
106
00:04:28,560 --> 00:04:31,520
Once they are connected, the Azure Monitor agent works exactly the same way, giving you
107
00:04:31,520 --> 00:04:35,800
the same data, same dashboards, same alerts, no matter where your server lives.
108
00:04:35,800 --> 00:04:41,480
There's also the ability to stream Microsoft 365 and enter ID data directly into Azure Monitor.
109
00:04:41,480 --> 00:04:43,640
Find and logs audit logs activity data.
110
00:04:43,640 --> 00:04:47,480
Every time someone tries to log in from an unusual location, that event can flow into your log
111
00:04:47,480 --> 00:04:49,000
analytics workspace.
112
00:04:49,000 --> 00:04:52,640
You can correlate it with your application performance data and see the full picture.
113
00:04:52,640 --> 00:04:54,600
And finally, security data.
114
00:04:54,600 --> 00:04:58,720
Microsoft Defender for Cloud and Microsoft Sentinel sit on top of the same data platform.
115
00:04:58,720 --> 00:05:02,240
So when you're investigating a security incident, you're looking at the same logs you use for
116
00:05:02,240 --> 00:05:03,440
performance troubleshooting.
117
00:05:03,440 --> 00:05:04,560
You don't need a separate tool.
118
00:05:04,560 --> 00:05:05,560
It's all in one place.
119
00:05:05,560 --> 00:05:07,800
So you've got all this data pouring in from everywhere.
120
00:05:07,800 --> 00:05:12,640
VMs, apps, on-premises servers, identity systems, security tools, how do you actually make sense
121
00:05:12,640 --> 00:05:13,640
of it?
122
00:05:13,640 --> 00:05:15,960
Visualization, your single pane of glass.
123
00:05:15,960 --> 00:05:18,360
So how do you actually see all this data?
124
00:05:18,360 --> 00:05:21,720
Azure Monitor gives you several ways, but the main tool is Workbooks.
125
00:05:21,720 --> 00:05:26,680
Workbooks are interactive reports that combine text, metrics, logs and parameters into custom
126
00:05:26,680 --> 00:05:27,680
dashboards.
127
00:05:27,680 --> 00:05:29,040
Think of them as your command center.
128
00:05:29,040 --> 00:05:30,520
Here's a concrete example.
129
00:05:30,520 --> 00:05:35,280
Imagine you create a single workbook that shows three things on one page.
130
00:05:35,280 --> 00:05:38,920
VM health, app response times and sign in anomalies.
131
00:05:38,920 --> 00:05:39,920
Are your servers running?
132
00:05:39,920 --> 00:05:41,280
Is your web app slow?
133
00:05:41,280 --> 00:05:43,920
Are there unusual login attempts from outside your country?
134
00:05:43,920 --> 00:05:45,320
All three on one screen.
135
00:05:45,320 --> 00:05:47,240
You don't need three different tools.
136
00:05:47,240 --> 00:05:49,720
Just one workbook and workbooks aren't just static charts.
137
00:05:49,720 --> 00:05:52,280
They support color coding, icons and thresholds.
138
00:05:52,280 --> 00:05:54,240
A healthy server shows a green check mark.
139
00:05:54,240 --> 00:05:56,760
A server approaching capacity shows a yellow warning.
140
00:05:56,760 --> 00:05:58,400
A server that's downshows red.
141
00:05:58,400 --> 00:06:01,400
You can glance at it and know exactly where your problems are.
142
00:06:01,400 --> 00:06:04,040
The killer feature, those charts have clickable links.
143
00:06:04,040 --> 00:06:08,400
If you see a server with high CPU, you click it and it takes you directly to that resource
144
00:06:08,400 --> 00:06:09,800
in the Azure portal.
145
00:06:09,800 --> 00:06:13,000
No searching, no copy pasting, just click and go.
146
00:06:13,000 --> 00:06:14,640
Workbooks aren't the only option though.
147
00:06:14,640 --> 00:06:17,040
You also have dashboards in the Azure portal.
148
00:06:17,040 --> 00:06:20,160
These let you pin tiles from different sources for a quick overview.
149
00:06:20,160 --> 00:06:21,880
Think of it as your morning briefing.
150
00:06:21,880 --> 00:06:24,360
A quick glance to make sure nothing is on fire.
151
00:06:24,360 --> 00:06:26,720
Then there's metric explorer for ad hoc charting.
152
00:06:26,720 --> 00:06:29,800
Want to see CPU usage across all your VMs for the last hour?
153
00:06:29,800 --> 00:06:33,200
Open metric explorer, select your resources and you get a chart in seconds.
154
00:06:33,200 --> 00:06:34,360
No setup required.
155
00:06:34,360 --> 00:06:37,960
And if you need to share reports with stakeholders who don't live in Azure, you can integrate
156
00:06:37,960 --> 00:06:39,000
with Power BI.
157
00:06:39,000 --> 00:06:43,120
Your executive team gets a monthly report showing service health, uptime and performance
158
00:06:43,120 --> 00:06:44,120
trends.
159
00:06:44,120 --> 00:06:46,400
They don't need to understand KQL or log analytics.
160
00:06:46,400 --> 00:06:48,080
They just see the numbers they care about.
161
00:06:48,080 --> 00:06:49,240
The goal is simple.
162
00:06:49,240 --> 00:06:51,080
One place to go when something feels off.
163
00:06:51,080 --> 00:06:52,720
No more jumping between five screens.
164
00:06:52,720 --> 00:06:55,600
No more logging into three different tools to figure out what broke.
165
00:06:55,600 --> 00:06:58,080
You open Azure Monitor and you see everything.
166
00:06:58,080 --> 00:06:59,800
That's the single pane of glass.
167
00:06:59,800 --> 00:07:01,200
Alerts and automation.
168
00:07:01,200 --> 00:07:02,360
When you need to act.
169
00:07:02,360 --> 00:07:05,520
Seeing the data is great, but you also need to know when to act.
170
00:07:05,520 --> 00:07:06,800
That's where alerts come in.
171
00:07:06,800 --> 00:07:08,960
Azure Monitor alerts work on both metrics and logs.
172
00:07:08,960 --> 00:07:12,600
You set a condition and when that condition is met, something happens.
173
00:07:12,600 --> 00:07:13,880
Let's break that down.
174
00:07:13,880 --> 00:07:16,280
Metric alerts are threshold based and very fast.
175
00:07:16,280 --> 00:07:18,800
You say CPU over 90% for five minutes.
176
00:07:18,800 --> 00:07:20,640
And when that happens, an alert fires.
177
00:07:20,640 --> 00:07:21,960
Simple direct near real time.
178
00:07:21,960 --> 00:07:24,640
These are great when you know exactly what bad looks like.
179
00:07:24,640 --> 00:07:25,880
Log alerts are different.
180
00:07:25,880 --> 00:07:28,000
They're query based and much more flexible.
181
00:07:28,000 --> 00:07:31,960
Instead of a simple threshold, you write a query that searches for a specific pattern.
182
00:07:31,960 --> 00:07:35,840
And any failed login attempts from outside the US in the last hour.
183
00:07:35,840 --> 00:07:38,400
If the query returns results, the alert fires.
184
00:07:38,400 --> 00:07:41,960
This lets you catch complex scenarios that a simple threshold would miss.
185
00:07:41,960 --> 00:07:43,680
When an alert fires, what happens next?
186
00:07:43,680 --> 00:07:44,760
That's where action groups come in.
187
00:07:44,760 --> 00:07:46,440
An action group defines the response.
188
00:07:46,440 --> 00:07:51,560
It can send an email, an SMS, a push notification to your phone, or trigger a web book that calls
189
00:07:51,560 --> 00:07:52,640
another system.
190
00:07:52,640 --> 00:07:56,560
But the really powerful option is triggering a logic app for automated remediation.
191
00:07:56,560 --> 00:07:57,560
Imagine this.
192
00:07:57,560 --> 00:08:00,280
An alert fires because a server is running out of disk space.
193
00:08:00,280 --> 00:08:04,720
Instead of waking someone up at 2am, the alert triggers a logic app that automatically runs
194
00:08:04,720 --> 00:08:05,800
a clean up script.
195
00:08:05,800 --> 00:08:07,960
The problem is fixed before anyone even notices.
196
00:08:07,960 --> 00:08:10,920
Now here's something new in 2026 that changes the game.
197
00:08:10,920 --> 00:08:13,920
Dynamic thresholds use machine learning to learn what normal behavior looks like for
198
00:08:13,920 --> 00:08:15,480
your specific environment.
199
00:08:15,480 --> 00:08:17,880
They factor in hourly, daily, and weekly patterns.
200
00:08:17,880 --> 00:08:23,480
So if your server normally runs at 40% CPU during the day, but spikes to 70% every Tuesday
201
00:08:23,480 --> 00:08:27,120
at 3pm because of a scheduled backup, the system learns that.
202
00:08:27,120 --> 00:08:31,120
It doesn't alert you for that spike only when something truly abnormal happens.
203
00:08:31,120 --> 00:08:33,240
This dramatically reduces false positives.
204
00:08:33,240 --> 00:08:35,680
And there's another new feature, query-based metric alerts.
205
00:08:35,680 --> 00:08:39,800
These let you use KQL-style queries over Prometheus and Open Telemetry metrics.
206
00:08:39,800 --> 00:08:43,680
So if you're running Kubernetes and using Prometheus for metrics, you can write the same
207
00:08:43,680 --> 00:08:46,720
kind of log-style queries against your metric data.
208
00:08:46,720 --> 00:08:50,200
It unifies your alerting logic across all your telemetry sources.
209
00:08:50,200 --> 00:08:51,560
Here's the bottom line.
210
00:08:51,560 --> 00:08:54,280
Monitoring becomes proactive when you set up alerts properly.
211
00:08:54,280 --> 00:08:56,480
You catch issues before users notice them.
212
00:08:56,480 --> 00:09:00,280
It's the difference between getting a call from your boss at 3am saying the website is down
213
00:09:00,280 --> 00:09:05,840
and getting a notification at 3am saying we fixed a potential issue before anyone noticed.
214
00:09:05,840 --> 00:09:08,400
What's new in 2026 and why it matters?
215
00:09:08,400 --> 00:09:12,800
Now let's talk about what actually changed in Azure Monitor for 2026 because this isn't
216
00:09:12,800 --> 00:09:14,800
the same platform it was two years ago.
217
00:09:14,800 --> 00:09:16,200
Here's the biggest update.
218
00:09:16,200 --> 00:09:18,240
Open Telemetry is now the standard.
219
00:09:18,240 --> 00:09:21,400
Native OTLP ingestion works directly with the Azure Monitor agent.
220
00:09:21,400 --> 00:09:25,320
What that means for you is you can use vendor neutral instrumentation across all your applications.
221
00:09:25,320 --> 00:09:28,160
You're not locked into Microsoft specific SDKs.
222
00:09:28,160 --> 00:09:31,320
Write your instrumentation once with open standards and it works whether you're sending
223
00:09:31,320 --> 00:09:34,040
data to Azure Monitor, DataDog or any other platform.
224
00:09:34,040 --> 00:09:37,560
That's a huge deal if your organization values flexibility.
225
00:09:37,560 --> 00:09:40,720
Next up, SLI and SLO support is now first class.
226
00:09:40,720 --> 00:09:44,800
You can define service level indicators for availability and latency, group your resources
227
00:09:44,800 --> 00:09:48,800
into service groups and track your reliability targets natively.
228
00:09:48,800 --> 00:09:52,480
No more exporting data to a spreadsheet to calculate uptime percentage.
229
00:09:52,480 --> 00:09:54,240
It's built right into the platform.
230
00:09:54,240 --> 00:09:56,880
So here's something you need to act on if you haven't already.
231
00:09:56,880 --> 00:09:59,720
The legacy log analytics agent is fully retired.
232
00:09:59,720 --> 00:10:02,640
Back on March 2nd, 2026, the back end shutdown.
233
00:10:02,640 --> 00:10:06,120
If you're still running that old agent, your data has stopped flowing.
234
00:10:06,120 --> 00:10:09,360
Everyone needs to be on the Azure Monitor agent with data collection rules.
235
00:10:09,360 --> 00:10:12,400
If you haven't migrated yet, that's your number one priority.
236
00:10:12,400 --> 00:10:14,240
And another change coming up.
237
00:10:14,240 --> 00:10:17,760
Microsoft EntraID is now required to query application inside's data.
238
00:10:17,760 --> 00:10:19,640
The old legacy API keys are going away.
239
00:10:19,640 --> 00:10:22,120
The deadline is September 30th, 2026.
240
00:10:22,120 --> 00:10:25,920
So if you have any scripts or tools using those old keys, you need to update them to use
241
00:10:25,920 --> 00:10:27,800
EntraID authentication.
242
00:10:27,800 --> 00:10:32,120
Finally, the new basic and auxiliary log tiers make it much cheaper to store less frequently
243
00:10:32,120 --> 00:10:33,120
accessed data.
244
00:10:33,120 --> 00:10:36,760
We'll talk more about cost in a moment, but this is a big deal for anyone trying to keep
245
00:10:36,760 --> 00:10:38,920
their monitoring bill under control.
246
00:10:38,920 --> 00:10:40,880
Practical tips and cost optimization.
247
00:10:40,880 --> 00:10:45,160
Speaking of cost, let's dive into how Azure Monitor pricing actually works because it
248
00:10:45,160 --> 00:10:46,960
can surprise you if you're not careful.
249
00:10:46,960 --> 00:10:50,880
As your monitor is usage based, you pay for log ingestion, retention, custom metrics,
250
00:10:50,880 --> 00:10:51,880
and alerts.
251
00:10:51,880 --> 00:10:55,320
You can get a flat monthly fee, which is great when you're small, but it can grow fast if
252
00:10:55,320 --> 00:10:56,480
you're not paying attention.
253
00:10:56,480 --> 00:10:58,240
Here's the most important thing to understand.
254
00:10:58,240 --> 00:11:00,120
There are three log tiers.
255
00:11:00,120 --> 00:11:03,000
Analytics logs cost about $2.30 per gigabyte.
256
00:11:03,000 --> 00:11:06,400
These are your full fidelity logs with complete query capabilities.
257
00:11:06,400 --> 00:11:08,640
Basic logs cost about 50 cents per gigabyte.
258
00:11:08,640 --> 00:11:11,440
Therefore data you need to keep, but don't query often.
259
00:11:11,440 --> 00:11:14,120
And auxiliary logs cost about 5 cents per gigabyte.
260
00:11:14,120 --> 00:11:15,560
That's archival pricing.
261
00:11:15,560 --> 00:11:17,760
You keep it for compliance, but almost never look at it.
262
00:11:17,760 --> 00:11:21,040
You get 5 gigabytes per month free for analytics logs.
263
00:11:21,040 --> 00:11:24,760
It's enough for a small environment, but it disappears fast once you start monitoring multiple
264
00:11:24,760 --> 00:11:26,200
servers and applications.
265
00:11:26,200 --> 00:11:31,240
If your daily ingestion is stable and above 100 gigabytes per day, commitment tiers can save
266
00:11:31,240 --> 00:11:33,320
you 15 to 30%.
267
00:11:33,320 --> 00:11:37,240
You commit to a certain amount of daily data and Microsoft gives you a discount, but only
268
00:11:37,240 --> 00:11:39,240
do this if your usage is predictable.
269
00:11:39,240 --> 00:11:42,280
If it fluctuates, wildly pay as you go might actually be cheaper.
270
00:11:42,280 --> 00:11:45,400
So what should you actually do to keep costs under control?
271
00:11:45,400 --> 00:11:48,920
Start by moving low value logs to basic or auxiliary tiers.
272
00:11:48,920 --> 00:11:53,360
But debug logging from your development environment, it doesn't need to be in analytics tier.
273
00:11:53,360 --> 00:11:56,040
Next, set retention policies per table.
274
00:11:56,040 --> 00:11:57,840
Keep operational data for 31 days.
275
00:11:57,840 --> 00:12:00,840
Keep compliance data longer, but don't keep everything forever.
276
00:12:00,840 --> 00:12:02,680
Then use sampling and application insights.
277
00:12:02,680 --> 00:12:05,000
You don't need every single request logged.
278
00:12:05,000 --> 00:12:09,120
A statistically significant sample gives you the same insights at a fraction of the cost.
279
00:12:09,120 --> 00:12:12,120
And finally, set up daily spending caps and alerts.
280
00:12:12,120 --> 00:12:15,560
Get notified when you hit 80% of your budget so there are no surprises.
281
00:12:15,560 --> 00:12:19,120
The biggest mistake people make is sending everything to the analytics tier by default, tier
282
00:12:19,120 --> 00:12:22,640
your telemetry, not every log needs full query capabilities.
283
00:12:22,640 --> 00:12:25,000
Treat cheap data like cheap data.
284
00:12:25,000 --> 00:12:26,360
How it all fits together.
285
00:12:26,360 --> 00:12:28,080
So here's the thing about Azure Monitor.
286
00:12:28,080 --> 00:12:29,080
It doesn't work alone.
287
00:12:29,080 --> 00:12:32,400
It's the centerpiece that connects everything in your Microsoft world.
288
00:12:32,400 --> 00:12:33,960
Let me show you what that looks like.
289
00:12:33,960 --> 00:12:37,600
Entra ID logs flow into Azure Monitor through diagnostic settings.
290
00:12:37,600 --> 00:12:41,160
So when someone says an app is slow, you check the sign in logs right next to the performance
291
00:12:41,160 --> 00:12:42,160
data.
292
00:12:42,160 --> 00:12:43,440
Was there an authentication delay?
293
00:12:43,440 --> 00:12:45,360
Did a conditional access policy kick in?
294
00:12:45,360 --> 00:12:49,920
To see it all from one screen, Microsoft Sentinel runs on the same log analytics workspace.
295
00:12:49,920 --> 00:12:52,960
Your operations data and security data live side by side.
296
00:12:52,960 --> 00:12:55,400
When you investigate an incident, you don't switch tools.
297
00:12:55,400 --> 00:12:56,760
You query one data set.
298
00:12:56,760 --> 00:12:57,760
That's the real power.
299
00:12:57,760 --> 00:13:02,400
A suspicious security event might be explained by a performance issue you already spotted.
300
00:13:02,400 --> 00:13:04,640
Defender for cloud pulls from Azure Monitor 2.
301
00:13:04,640 --> 00:13:06,200
It doesn't create its own telemetry.
302
00:13:06,200 --> 00:13:08,680
It uses the same metrics and logs you already collect.
303
00:13:08,680 --> 00:13:12,440
So when Defender flags are VM vulnerability, you can check that VM's performance data right
304
00:13:12,440 --> 00:13:14,160
away to see the impact.
305
00:13:14,160 --> 00:13:17,880
Even Microsoft's per view governance data can connect in for compliance monitoring.
306
00:13:17,880 --> 00:13:22,800
Your data classification and retention policies all tie back to the same observability platform.
307
00:13:22,800 --> 00:13:27,520
Microsoft's cloud adoption framework recommends Azure Monitor as your primary monitoring platform.
308
00:13:27,520 --> 00:13:30,760
That's their own guidance that telling you to build around this tool.
309
00:13:30,760 --> 00:13:33,280
Now imagine someone says SharePoint is slow.
310
00:13:33,280 --> 00:13:36,720
With Azure Monitor, you open one workbook, you check SharePoint service health, you look
311
00:13:36,720 --> 00:13:40,640
at the VM hosting the web front end, you check Entra ID sign in logs for authentication
312
00:13:40,640 --> 00:13:44,040
delays, you see app performance data from application insights.
313
00:13:44,040 --> 00:13:48,840
No from one screen, no more jumping between the SharePoint admin center, the VM dashboard,
314
00:13:48,840 --> 00:13:51,240
Entra ID and application insights.
315
00:13:51,240 --> 00:13:52,400
It's all right there.
316
00:13:52,400 --> 00:13:53,640
So here's the bottom line.
317
00:13:53,640 --> 00:13:55,960
Azure Monitor is not just another monitoring tool.
318
00:13:55,960 --> 00:14:00,600
It's the central dashboard that brings together your apps, infrastructure, identity and security.
319
00:14:00,600 --> 00:14:03,960
The real value is the integration, not any single feature.
320
00:14:03,960 --> 00:14:07,400
One data platform, one query language, one place to look.
321
00:14:07,400 --> 00:14:11,960
If you're starting your cloud journey, enable Azure Monitor on your first VM today.
322
00:14:11,960 --> 00:14:14,880
Turn on diagnostic settings and see what you've been missing.
323
00:14:14,880 --> 00:14:18,320
Subscribe on your favorite podcast platform and share this episode with someone who's drowning
324
00:14:18,320 --> 00:14:19,640
in too many dashboards.
325
00:14:19,640 --> 00:14:20,800
I'm Mirko Peters.
326
00:14:20,800 --> 00:14:23,280
This is Microsoft Knowledge Nuggets on M365.
327
00:14:23,280 --> 00:14:24,480
FM, see you next time.

Founder of m365.fm, m365.show and m365con.net
Mirko Peters is a Microsoft 365 expert, content creator, and founder of m365.fm, a platform dedicated to sharing practical insights on modern workplace technologies. His work focuses on Microsoft 365 governance, security, collaboration, and real-world implementation strategies.
Through his podcast and written content, Mirko provides hands-on guidance for IT professionals, architects, and business leaders navigating the complexities of Microsoft 365. He is known for translating complex topics into clear, actionable advice, often highlighting common mistakes and overlooked risks in real-world environments.
With a strong emphasis on community contribution and knowledge sharing, Mirko is actively building a platform that connects experts, shares experiences, and helps organizations get the most out of their Microsoft 365 investments.




