

 Apple Podcasts
 Spotify
 Youtube Music
 Spreaker
 Podchaser
 Amazon Music
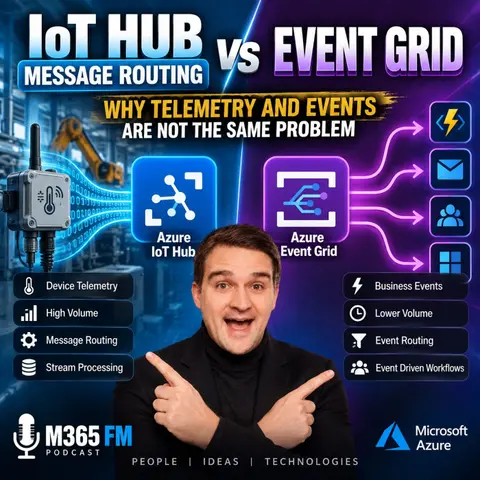
 IoT Hub Message Routing vs Event Grid — Why Telemetry and Events Are Not the Same Problem

Key Takeaways
- Treating high-volume sensor telemetry and discrete lifecycle events as interchangeable architectures can lead to expensive workflows or buried signals.
- Azure IoT Hub Message Routing is designed for the data plane, preserving time-ordered sequences, retention, and independent stream consumers for metrics like temperature and vibration.
- Azure Event Grid is built for reactive architectures and event-driven notifications, notifying systems when something changes rather than acting as a primary telemetry bus.
- Using Event Grid for continuous sensor data can overwhelm downstream handlers with noise and lack message ordering guarantees required for accurate manufacturing analysis.
- Combining IoT Hub for telemetry streams and Event Grid for reactive lifecycle notifications ensures industrial architectures remain scalable, reliable, and easy to troubleshoot.
A machine sends temperature readings, vibration data, cycle counts, power consumption, and operating states every few seconds. Then the gateway suddenly disconnects. Are all of those messages simply “events”? Technically, you could describe them that way. Architecturally, that can create serious problems. Azure IoT Hub Message Routing and Azure Event Grid solve different problems. One path is designed around preserving and distributing operational data. The other is designed around notifying systems that something changed and may require a response. Treating them as interchangeable can leave you with expensive workflows processing routine sensor data—or important signals buried inside a telemetry pipeline nobody is actively watching. In this episode of M365 FM, we follow a manufacturing machine through a real Azure IoT architecture and explain where IoT Hub, Event Grid, Event Hubs, Microsoft Fabric, Power BI, MES, ERP, Functions, and Logic Apps actually belong.
WHAT YOU WILL LEARN
In this episode, we explore:
- Why machine telemetry and discrete business or lifecycle events require different architecture patterns
- How Azure IoT Hub Message Routing works as part of a telemetry data plane
- Where Azure Event Grid fits into event-driven and reactive architectures
- Why message ordering matters for manufacturing telemetry
- Why Event Grid should not become your primary high-volume telemetry bus
- Why IoT Hub routing should not be forced into every notification workflow
- How IoT Hub and Event Grid can work together in the same architecture
- How Event Hubs can support independent stream-processing consumers
- Why raw telemetry should often be retained for traceability and later investigation
- How Microsoft Fabric and Power BI can consume prepared operational data
- Why MES, ERP, and asset models provide context that device data alone cannot provide
- How device disconnect events should be interpreted without automatically assuming production stopped
- How duplicate delivery, retries, timestamps, and idempotency affect reliable industrial architectures
- How to design condition monitoring, predictive maintenance, quality traceability, and production-disruption workflows
- How to decide whether a message belongs on the data plane, the response path, or both
Telemetry is not valuable because one temperature reading arrived. It becomes valuable because thousands of readings together describe what happened. A production machine may continuously report:
- Temperature and vibration measurements
- Motor current and energy consumption
- Cycle counts and production counters
- Running, idle, stopped, or faulted states
- Source timestamps and sequence information
- Diagnostic and equipment-health information
EVENTS EXIST TO START A RESPONSE
An event serves another purpose. An event says: Something changed. A system or person may need to react. Examples include:
- A new device was registered
- A gateway disconnected from IoT Hub
- A device reconnected
- A device was deleted
- A monitoring process detected a condition requiring investigation
- An inspection completed and another workflow can begin
- Starting an Azure Function
- Triggering a Logic App
- Opening a support investigation
- Updating an asset record
- Checking the current device state
- Calling an external application through a webhook
- Notifying the team responsible for the affected system
WHY “EVERYTHING IS AN EVENT” BREAKS DOWN
Sending every sensor measurement into event-triggered workflows can look attractive during a proof of concept. Then production scale arrives. Every reading triggers another Function. Another Logic App evaluates something. Another integration receives another message. Maintenance creates its own subscription. Quality creates another. Energy management creates another. Soon, every team has slightly different filtering, state management, retry handling, and storage logic. A temperature measurement is not automatically an incident. It may contribute to an incident later, but the continuous measurements should remain available as evidence. When routine telemetry starts generating constant notifications, users can also begin ignoring alerts because the system has trained them to expect noise rather than actionable information.
WHAT AZURE IOT HUB ACTUALLY DOES
Azure IoT Hub provides the device-facing cloud boundary. It supports areas such as:
- Secure device identities
- Device-to-cloud messaging
- Cloud-to-device communication
- Device management
- Device twins
- Controlled access between connected equipment and Azure services
- Producing approved parts
- Dry cycling
- Running setup
- Performing rework
- Moving without material
Become a supporter of this podcast: https://www.spreaker.com/podcast/m365-fm-a-microsoft-mvp-podcast-by-mirko-peters--6704921/support.
🚀 Want to be part of m365.fm?
Then stop just listening… and start showing up.
👉 Connect with me on LinkedIn and let’s make something happen:
- 🎙️ Be a podcast guest and share your story
- 🎧 Host your own episode (yes, seriously)
- 💡 Pitch topics the community actually wants to hear
- 🌍 Build your personal brand in the Microsoft 365 space
This isn’t just a podcast — it’s a platform for people who take action.
🔥 Most people wait. The best ones don’t.
👉 Connect with me on LinkedIn and send me a message:
"I want in"
Let’s build something awesome 👊
Frequently Asked Questions
What is the difference between IoT Hub Message Routing and Event Grid?
IoT Hub Message Routing is designed for high-volume, time-ordered telemetry data like sensor readings, while Event Grid is built for reactive, discrete event notifications such as device connection status changes.
Why should you avoid using Event Grid for high-volume sensor telemetry?
Event Grid does not guarantee delivery order and can overwhelm downstream handlers with noise, whereas telemetry streams require strict sequence preservation for accurate historical analysis like OEE.
How do IoT Hub and Event Grid work together in an Azure architecture?
IoT Hub captures secure device identity and routes continuous operational data to storage or stream processors, while Event Grid emits lifecycle notifications to trigger alerts, workflows, or support investigations.
00:00:00,000 --> 00:00:06,320
A machine sends a temperature value every few seconds, it sends a cycle count, it sends vibration data, current draw and a run state.
2
00:00:06,320 --> 00:00:08,840
Then, at some point, its connection drops.
3
00:00:08,840 --> 00:00:11,320
People often call all of that events.
4
00:00:11,320 --> 00:00:17,320
Azure uses the word too, so the confusion is understandable, but a stream of measurements and a notice that something changed
5
00:00:17,320 --> 00:00:19,640
create two very different architecture jobs.
6
00:00:19,640 --> 00:00:22,240
One path needs to preserve the production record.
7
00:00:22,240 --> 00:00:25,760
The other needs to tell the right system or person that it may need to react.
8
00:00:25,760 --> 00:00:30,840
If you treat both paths the same, you either build a very expensive alarm system for routine sensor data,
9
00:00:30,840 --> 00:00:34,000
or you bury urgent signals in a data pipeline nobody watches.
10
00:00:34,000 --> 00:00:39,760
So let's follow one machine through a normal production shift, because that makes the difference much easier to hear.
11
00:00:39,760 --> 00:00:42,720
A press line, a sensor stream, and one missing signal.
12
00:00:42,720 --> 00:00:46,280
Picture a press line producing formed metal parts during a live work order.
13
00:00:46,280 --> 00:00:51,160
The line has a PLC, a few sensors, and an industrial gateway that connects the OT network to Azure.
14
00:00:51,160 --> 00:00:52,280
None of that is unusual.
15
00:00:52,280 --> 00:00:57,520
Most plants already have some version of this, even if the gateway talks to a mix of old and new equipment.
16
00:00:57,520 --> 00:01:02,560
Every few seconds, the gateway sends a device to cloud message into Azure IoT Hub.
17
00:01:02,560 --> 00:01:06,360
The message may include press temperature, vibration level, cycle count, energy draw,
18
00:01:06,360 --> 00:01:09,640
and whether the machine reports a running idle, faulted or stopped state.
19
00:01:09,640 --> 00:01:13,240
It may also carry a device identifier and a timestamp from the gateway.
20
00:01:13,240 --> 00:01:14,960
That flow creates a record over time.
21
00:01:14,960 --> 00:01:18,520
The MES, the manufacturing execution system, tracks a different part of the story.
22
00:01:18,520 --> 00:01:22,840
It knows which work order is active, which operation should run, which recipe applies,
23
00:01:22,840 --> 00:01:27,240
perhaps which operator signed into the cell, and whether the order has started or completed.
24
00:01:27,240 --> 00:01:29,240
The machine can tell you that a cycle happened.
25
00:01:29,240 --> 00:01:33,160
The MES can tell you which production operation that cycle belongs to, both matter,
26
00:01:33,160 --> 00:01:34,960
but they don't come from the same place.
27
00:01:34,960 --> 00:01:37,360
Now imagine the press starts its shift normally.
28
00:01:37,360 --> 00:01:39,280
Temperature rises as the equipment warms up.
29
00:01:39,280 --> 00:01:43,120
Cycle counts increase, vibration stays inside its normal operating band.
30
00:01:43,120 --> 00:01:47,000
A production engineer may want that data later to study where a maintenance engineer may
31
00:01:47,000 --> 00:01:48,760
wanted to watch for a gradual change.
32
00:01:48,760 --> 00:01:53,600
A data team may use it to build a reliable history for analysis in Microsoft fabric.
33
00:01:53,600 --> 00:01:56,120
Those consumers don't need a new workflow for every reading.
34
00:01:56,120 --> 00:02:00,040
They need the facts to keep arriving in the usable sequence so they can reconstruct what
35
00:02:00,040 --> 00:02:01,640
happened across the shift.
36
00:02:01,640 --> 00:02:03,120
A planner has another concern.
37
00:02:03,120 --> 00:02:07,000
The planner doesn't need a notification every time the press completes a cycle, because
38
00:02:07,000 --> 00:02:10,120
that would turn production planning into a fairly noisy hobby.
39
00:02:10,120 --> 00:02:14,440
The planner needs trustworthy evidence when production has actually slowed, stopped, or moved
40
00:02:14,440 --> 00:02:15,440
off plan.
41
00:02:15,440 --> 00:02:19,320
The evidence may start with machine data, but it needs MES contacts before anyone changes
42
00:02:19,320 --> 00:02:20,320
a schedule.
43
00:02:20,320 --> 00:02:21,920
Then the gateway loses its connection.
44
00:02:21,920 --> 00:02:23,440
That is a different kind of message.
45
00:02:23,440 --> 00:02:27,320
The loss of connection may need a prompt response from an IT or OT support team.
46
00:02:27,320 --> 00:02:29,440
A workflow might open an investigation.
47
00:02:29,440 --> 00:02:31,000
It might notify the line support group.
48
00:02:31,000 --> 00:02:35,680
It might check whether the device has reconnected, whether other devices on the same network,
49
00:02:35,680 --> 00:02:39,120
segment also dropped, or whether the gateway itself reports a fault.
50
00:02:39,120 --> 00:02:41,680
But notice what the connection loss does not prove.
51
00:02:41,680 --> 00:02:43,120
It doesn't prove that the press stopped.
52
00:02:43,120 --> 00:02:46,000
The press may continue running under local PLC control.
53
00:02:46,000 --> 00:02:47,480
It doesn't prove the work order is late.
54
00:02:47,480 --> 00:02:49,000
It doesn't prove a safety issue.
55
00:02:49,000 --> 00:02:52,200
And it doesn't tell a planner which alternative machine can take the work.
56
00:02:52,200 --> 00:02:55,600
A disconnected gateway tells you that cloud visibility has changed.
57
00:02:55,600 --> 00:02:57,160
That's enough to trigger an investigation.
58
00:02:57,160 --> 00:02:59,280
It isn't enough to write the production story.
59
00:02:59,280 --> 00:03:01,640
This is where teams often create trouble without meaning to.
60
00:03:01,640 --> 00:03:05,360
They see the word "event", then send every telemetry reading through an event triggered
61
00:03:05,360 --> 00:03:06,360
workflow.
62
00:03:06,360 --> 00:03:08,360
A sensor value arrives, a function runs.
63
00:03:08,360 --> 00:03:10,320
Another value arrives, another function runs.
64
00:03:10,320 --> 00:03:14,640
Soon, ordinary operating data creates a flood of small reactions.
65
00:03:14,640 --> 00:03:17,960
Each one carrying less context than the person who needs to act.
66
00:03:17,960 --> 00:03:19,440
The opposite mistake can happen too.
67
00:03:19,440 --> 00:03:24,400
A connection change enters a large telemetry pipeline, lands in storage, waits for a consumer,
68
00:03:24,400 --> 00:03:26,160
and eventually appears in a report.
69
00:03:26,160 --> 00:03:27,560
Technically the signal arrived.
70
00:03:27,560 --> 00:03:31,200
Operationally, the team who needed to know may hear about it far too late.
71
00:03:31,200 --> 00:03:33,920
Think about the two messages leaving that same press line.
72
00:03:33,920 --> 00:03:38,440
One message says, "The press temperature is 82 degrees, and the cycle count is still
73
00:03:38,440 --> 00:03:39,440
increasing.
74
00:03:39,440 --> 00:03:41,840
It belongs in a continuous operational record."
75
00:03:41,840 --> 00:03:44,720
The other says, "This device connection changed state.
76
00:03:44,720 --> 00:03:49,440
It belongs in a response path, where subscribed systems can decide whether they need to act.
77
00:03:49,440 --> 00:03:53,400
They may leave the same gateway, they may pass through the same IoT hub, but downstream
78
00:03:53,400 --> 00:03:55,160
they have different jobs."
79
00:03:55,160 --> 00:03:57,680
Telemetry means a time-ordered record.
80
00:03:57,680 --> 00:04:00,280
Telemetry is a record of repeated measurements over time.
81
00:04:00,280 --> 00:04:04,040
One reading has limited meaning on its own, but the sequence tells you how the machine behaved
82
00:04:04,040 --> 00:04:05,480
during a real production run.
83
00:04:05,480 --> 00:04:06,480
Take the press line again.
84
00:04:06,480 --> 00:04:09,200
A temperature reading of 82 degrees might be normal.
85
00:04:09,200 --> 00:04:10,280
It might also be a problem.
86
00:04:10,280 --> 00:04:14,400
You can't tell from that one number unless you know what came before it, how fast it rose,
87
00:04:14,400 --> 00:04:17,960
what the press was doing at the time, and where the similar runs followed the same pattern.
88
00:04:17,960 --> 00:04:19,240
The order creates the story.
89
00:04:19,240 --> 00:04:22,840
A machine may start from cold, then enter a warmer period, where temperature and current
90
00:04:22,840 --> 00:04:23,840
draw climb.
91
00:04:23,840 --> 00:04:25,960
After that it reaches a stable run state.
92
00:04:25,960 --> 00:04:30,160
Much later, vibration might begin to creep upward while cycle time stretches slightly.
93
00:04:30,160 --> 00:04:33,000
The line then stops, perhaps for a planned material change.
94
00:04:33,000 --> 00:04:35,960
Perhaps because of fault occurred, perhaps because the operator paused it.
95
00:04:35,960 --> 00:04:39,920
This facts only form a usable production record when you keep the sequence intact.
96
00:04:39,920 --> 00:04:44,680
If a vibration reading from after the stop appears before the last running state message, a downstream
97
00:04:44,680 --> 00:04:46,480
system can tell the wrong story.
98
00:04:46,480 --> 00:04:49,000
It may classify a normal shutdown as a fault.
99
00:04:49,000 --> 00:04:51,640
It may calculate a downtime period that never existed.
100
00:04:51,640 --> 00:04:54,560
It may attach the wrong sensor pattern to the wrong batch.
101
00:04:54,560 --> 00:04:58,160
That kind of error rarely looks dramatic in a cloud architecture meeting.
102
00:04:58,160 --> 00:05:02,960
It looks like a small time stamp issue, or a consumer problem someone plans to clean up later.
103
00:05:02,960 --> 00:05:07,040
On a factory floor though, those small errors can turn into hours of people arguing over
104
00:05:07,040 --> 00:05:09,480
which system tells the right version of the shift.
105
00:05:09,480 --> 00:05:13,440
And this is where OEE, overall equipment effectiveness, often gets misunderstood.
106
00:05:13,440 --> 00:05:15,320
OEE needs more than a machine counter.
107
00:05:15,320 --> 00:05:19,040
It needs a defensible timeline of planned time, runtime stops, speed loss production
108
00:05:19,040 --> 00:05:20,560
count, and quality results.
109
00:05:20,560 --> 00:05:22,280
Some of that comes from machine telemetry.
110
00:05:22,280 --> 00:05:23,280
Some comes from the mayors.
111
00:05:23,280 --> 00:05:27,280
But if the telemetry record arrives late, disappears during a network gap, or lands
112
00:05:27,280 --> 00:05:31,840
out of sequence, your OEE calculation can become a polished answer to the wrong question.
113
00:05:31,840 --> 00:05:33,840
Condition monitoring works the same way.
114
00:05:33,840 --> 00:05:37,560
A maintenance engineer usually doesn't care only that vibration passed a number once.
115
00:05:37,560 --> 00:05:41,600
They care whether the value rose over days, whether it changes under a certain product
116
00:05:41,600 --> 00:05:45,920
load, whether the pattern repeats at a particular point in the cycle, and whether the reading
117
00:05:45,920 --> 00:05:48,320
returns to normal after maintenance.
118
00:05:48,320 --> 00:05:51,640
That analysis depends on a record you can inspect again.
119
00:05:51,640 --> 00:05:54,760
Think of telemetry as a production logbook that writes itself.
120
00:05:54,760 --> 00:05:59,080
It records what the equipment reported, when it reported it, and in what order the signals
121
00:05:59,080 --> 00:06:00,080
appeared.
122
00:06:00,080 --> 00:06:04,040
The logbook isn't useful because somebody reads every line the instant it arrives.
123
00:06:04,040 --> 00:06:07,560
It's useful because later when a question comes up, you can trace the sequence and test
124
00:06:07,560 --> 00:06:11,640
an explanation against the record that also explains why one consumer is rarely enough.
125
00:06:11,640 --> 00:06:15,280
Your operational team may need near real time processing for a current condition.
126
00:06:15,280 --> 00:06:18,600
Your data engineers may need the same telemetry for a curated history.
127
00:06:18,600 --> 00:06:23,560
A quality team may need to retrieve a slice of the record tied to a serial number or batch.
128
00:06:23,560 --> 00:06:27,640
And months later an engineer may need to compare a failure pattern with a prior production
129
00:06:27,640 --> 00:06:28,640
run.
130
00:06:28,640 --> 00:06:29,800
A customer has a different job.
131
00:06:29,800 --> 00:06:32,600
They shouldn't need to compete for the same one time notification.
132
00:06:32,600 --> 00:06:36,080
And they shouldn't depend on one workflow keeping perfect notes for everybody else.
133
00:06:36,080 --> 00:06:39,520
A proper telemetry part lets consumers read the stream for their own purpose.
134
00:06:39,520 --> 00:06:43,600
It retains raw facts long enough for traceability and later analysis.
135
00:06:43,600 --> 00:06:47,400
It also accepts an uncomfortable but normal manufacturing condition.
136
00:06:47,400 --> 00:06:50,480
Messages can arrive late and devices can lose contact.
137
00:06:50,480 --> 00:06:53,520
When that happens you need to know the difference between a missing measurement and a machine
138
00:06:53,520 --> 00:06:54,520
state.
139
00:06:54,520 --> 00:06:57,680
A gap in telemetry might mean the gateway lost network access.
140
00:06:57,680 --> 00:06:59,240
It might mean the device rebooted.
141
00:06:59,240 --> 00:07:00,800
It might mean the sensor stopped sending.
142
00:07:00,800 --> 00:07:04,400
None of those explanations should quietly turn into the machine was down just because the
143
00:07:04,400 --> 00:07:05,400
data stopped.
144
00:07:05,400 --> 00:07:09,760
So the telemetry pipeline needs time, sequence, device identity and enough source detail to
145
00:07:09,760 --> 00:07:10,760
interpret gaps.
146
00:07:10,760 --> 00:07:14,440
Honestly, it needs consumers that can handle duplicates too because reliable industrial messaging
147
00:07:14,440 --> 00:07:16,920
often means a message can appear more than once.
148
00:07:16,920 --> 00:07:20,520
Receiving the same fact twice is safer than silently losing it but your processing logic
149
00:07:20,520 --> 00:07:21,880
still needs to recognize it.
150
00:07:21,880 --> 00:07:23,160
This is a stream problem.
151
00:07:23,160 --> 00:07:26,120
It needs replay, retention and independent readers.
152
00:07:26,120 --> 00:07:28,400
A discrete event has a different job.
153
00:07:28,400 --> 00:07:30,880
Events mean something requires attention.
154
00:07:30,880 --> 00:07:32,800
An event tells a different kind of story.
155
00:07:32,800 --> 00:07:36,800
It says that a condition changed or that something happened and one or more systems may
156
00:07:36,800 --> 00:07:37,880
need to react.
157
00:07:37,880 --> 00:07:41,040
Think about a device being registered in IoT Hub.
158
00:07:41,040 --> 00:07:43,920
Somebody may need to assign it to a plant and owner and an asset record.
159
00:07:43,920 --> 00:07:48,280
When a device connects, a support process may record that the cloud link is active.
160
00:07:48,280 --> 00:07:51,800
When it disconnects, a support team may need to investigate whether the problem sits
161
00:07:51,800 --> 00:07:54,760
in the gateway, the network, the device or the cloud path.
162
00:07:54,760 --> 00:07:58,720
Those are events because they change the state of the world in a way that can start work.
163
00:07:58,720 --> 00:08:02,360
The recipient doesn't usually need a long sequence of readings before it can respond.
164
00:08:02,360 --> 00:08:06,880
It needs a clear notice, an identity, a time, and enough detail to decide the next step.
165
00:08:06,880 --> 00:08:11,240
A workflow may create a support ticket and as your function may check a device record,
166
00:08:11,240 --> 00:08:14,920
a logic app may send a message to the team responsible for the site.
167
00:08:14,920 --> 00:08:17,800
That response path needs to be fast and loosely connected.
168
00:08:17,800 --> 00:08:21,600
The system that handles device registration shouldn't need to know anything about vibration
169
00:08:21,600 --> 00:08:22,600
analysis.
170
00:08:22,600 --> 00:08:26,560
When responsible for access control shouldn't need to consume the same high volume stream
171
00:08:26,560 --> 00:08:27,840
as the quality team.
172
00:08:27,840 --> 00:08:31,840
Each subscriber can receive the event it cares about, then do its own work without becoming
173
00:08:31,840 --> 00:08:34,120
part of the production data pipeline.
174
00:08:34,120 --> 00:08:35,800
Consider a new gateway arriving at a plant.
175
00:08:35,800 --> 00:08:37,840
The gateway gets registered in the cloud.
176
00:08:37,840 --> 00:08:42,280
That registration can trigger a process that creates an asset record, checks the device naming
177
00:08:42,280 --> 00:08:45,800
rule records the site and assigns an operational owner.
178
00:08:45,800 --> 00:08:49,400
None of those actions need the gateway to send thousands of measurements first.
179
00:08:49,400 --> 00:08:53,560
They need one reliable notice that the device exists or take a disconnect event during a
180
00:08:53,560 --> 00:08:54,560
shift.
181
00:08:54,560 --> 00:08:57,960
A support workflow receives the notification and checks whether the gateway reconnects shortly
182
00:08:57,960 --> 00:08:58,960
after.
183
00:08:58,960 --> 00:09:01,160
It may compare the event with network monitoring data.
184
00:09:01,160 --> 00:09:05,040
It may raise the issue to the right team if other devices in the same cell disappear at
185
00:09:05,040 --> 00:09:06,040
the same time.
186
00:09:06,040 --> 00:09:07,960
That workflow responds to a change condition.
187
00:09:07,960 --> 00:09:11,480
It doesn't need to reconstruct every press cycle since the start of the day.
188
00:09:11,480 --> 00:09:14,440
This is why I separate a response signal from an operational record.
189
00:09:14,440 --> 00:09:17,440
A response signal says something deserves attention now.
190
00:09:17,440 --> 00:09:21,160
It can prompt a person, start an automated check or create a work item.
191
00:09:21,160 --> 00:09:22,640
The signal needs clear ownership.
192
00:09:22,640 --> 00:09:27,040
If nobody owns the next action, the event simply becomes another message in another system.
193
00:09:27,040 --> 00:09:28,440
Factories already have enough of those.
194
00:09:28,440 --> 00:09:30,280
A useful event also has a boundary.
195
00:09:30,280 --> 00:09:32,360
Suppose the temperature in our press moves above a limit.
196
00:09:32,360 --> 00:09:36,040
The raw readings still belong in the production record because an engineer may later need the
197
00:09:36,040 --> 00:09:37,040
full pattern.
198
00:09:37,040 --> 00:09:40,400
But a rule can interpret those readings and emit a separate event.
199
00:09:40,400 --> 00:09:42,280
Temperature condition requires review.
200
00:09:42,280 --> 00:09:45,240
That second message isn't pretending to replace the measurements.
201
00:09:45,240 --> 00:09:50,320
It tells a maintenance process that the measurements crossed a defined business or engineering threshold
202
00:09:50,320 --> 00:09:52,520
that split keeps the architecture honest.
203
00:09:52,520 --> 00:09:55,080
The source data answers, what did the machine report?
204
00:09:55,080 --> 00:09:59,000
The event answers, what should a person or system consider doing because of it?
205
00:09:59,000 --> 00:10:02,520
You may send both at nearly the same time, but they carry different meaning and they should
206
00:10:02,520 --> 00:10:03,520
have different contracts.
207
00:10:03,520 --> 00:10:07,520
A fire alarm and a chart recorder both relate to safety but they don't do the same job.
208
00:10:07,520 --> 00:10:11,600
The chart recorder tracks conditions through time so an engineer can inspect the pattern.
209
00:10:11,600 --> 00:10:13,880
The fire alarm tells people to react.
210
00:10:13,880 --> 00:10:17,600
It would replace the chart recorder with a room full of alarms and nobody would ask people
211
00:10:17,600 --> 00:10:21,560
to inspect a long trend chart before leaving a dangerous area.
212
00:10:21,560 --> 00:10:23,440
Industrial systems need the same discipline.
213
00:10:23,440 --> 00:10:26,080
Not every notification demands a human response either.
214
00:10:26,080 --> 00:10:27,760
Some events start technical checks.
215
00:10:27,760 --> 00:10:30,320
A device created event can trigger a registry update.
216
00:10:30,320 --> 00:10:32,840
A disconnect event can trigger a status check.
217
00:10:32,840 --> 00:10:36,840
A completed inspection can prompt a system to release the next workflow step.
218
00:10:36,840 --> 00:10:39,960
In each case, the event announces that a boundary was crossed.
219
00:10:39,960 --> 00:10:42,000
Then a subscriber decides what to do next.
220
00:10:42,000 --> 00:10:44,000
That decision may still need more context.
221
00:10:44,000 --> 00:10:48,000
A device disconnect can start an investigation, but it can't by itself establish production
222
00:10:48,000 --> 00:10:49,000
loss.
223
00:10:49,000 --> 00:10:53,080
A device created event can start setup work, but it can't prove the device configuration
224
00:10:53,080 --> 00:10:54,600
is correct for a machine.
225
00:10:54,600 --> 00:10:56,640
An event opens the door to a response.
226
00:10:56,640 --> 00:11:00,080
It doesn't contain every fact needed for a safe operational decision.
227
00:11:00,080 --> 00:11:03,760
Keep that distinction in mind because telemetry can absolutely create an event.
228
00:11:03,760 --> 00:11:08,160
A stream rule, an engineering limit, or a model result may decide that the data now requires
229
00:11:08,160 --> 00:11:09,160
attention.
230
00:11:09,160 --> 00:11:14,200
The event and the telemetry remain separate concerns even when one leads directly to
231
00:11:14,200 --> 00:11:15,200
the other.
232
00:11:15,200 --> 00:11:16,200
Why?
233
00:11:16,200 --> 00:11:19,000
Everything is an event breaks down on the shop floor.
234
00:11:19,000 --> 00:11:21,320
Software teams often use the word event very broadly.
235
00:11:21,320 --> 00:11:22,600
A button click is an event.
236
00:11:22,600 --> 00:11:24,240
A record update is an event.
237
00:11:24,240 --> 00:11:25,800
A sensor reading is an event.
238
00:11:25,800 --> 00:11:29,840
At one level that language is fine because all of those things happened at a point in time,
239
00:11:29,840 --> 00:11:32,040
but the factory doesn't care about language purity.
240
00:11:32,040 --> 00:11:35,560
It cares whether the information arrives in a form that supports the next operational
241
00:11:35,560 --> 00:11:41,320
job without adding noise, losing history, or waking up a workflow for no good reason.
242
00:11:41,320 --> 00:11:45,360
Picture a gateway sending a temperature, pressure, vibration value, and power reading every
243
00:11:45,360 --> 00:11:47,360
few seconds from several machines.
244
00:11:47,360 --> 00:11:51,680
If every message enters a notification path, each reading can trigger a downstream handler.
245
00:11:51,680 --> 00:11:54,520
A function wakes up, a logic app evaluates a rule.
246
00:11:54,520 --> 00:11:56,240
A web hook receives a call.
247
00:11:56,240 --> 00:11:57,840
Another system writes a status record.
248
00:11:57,840 --> 00:11:59,360
Nothing necessarily fails at first.
249
00:11:59,360 --> 00:12:02,200
That's why this design can survive a proof of concept.
250
00:12:02,200 --> 00:12:06,480
In the number of devices grows, the sampling rate changes, and more teams subscribe because
251
00:12:06,480 --> 00:12:08,080
the messages seem useful.
252
00:12:08,080 --> 00:12:12,760
The maintenance team wants one view, quality wants another, energy management wants a third.
253
00:12:12,760 --> 00:12:17,400
Somebody adds an email rule because a sensor value looks unusual and soon the same normal operating
254
00:12:17,400 --> 00:12:20,160
pattern starts several unrelated processes.
255
00:12:20,160 --> 00:12:23,800
A temperature reading isn't an incident, it may contribute to an incident later.
256
00:12:23,800 --> 00:12:27,280
It may be part of a pattern that points to where poor cooling, an incorrect recipe, or
257
00:12:27,280 --> 00:12:28,280
a sensor fault.
258
00:12:28,280 --> 00:12:32,640
But treating every measurement as an urgent business signal forces each downstream consumer
259
00:12:32,640 --> 00:12:34,800
to rediscover the same distinction.
260
00:12:34,800 --> 00:12:37,360
Is this just data or does somebody need to act?
261
00:12:37,360 --> 00:12:38,800
That is wasted architecture effort.
262
00:12:38,800 --> 00:12:42,800
You move filtering, aggregation, and state tracking into dozens of small handlers where
263
00:12:42,800 --> 00:12:47,000
it becomes hard to test and even harder to trace when a production engineer asks a simple
264
00:12:47,000 --> 00:12:49,400
question about last Tuesday's shift.
265
00:12:49,400 --> 00:12:51,200
The delivery semantics create another problem.
266
00:12:51,200 --> 00:12:54,120
A stream consumer often needs to reason about sequence.
267
00:12:54,120 --> 00:12:58,000
It needs to know whether a run-state change came before account increase, whether a
268
00:12:58,000 --> 00:13:02,920
threshold occurred during a production cycle, and whether a gap reflects a real stop or
269
00:13:02,920 --> 00:13:04,520
loss of connectivity.
270
00:13:04,520 --> 00:13:08,080
A notification system doesn't exist to rebuild that kind of timeline.
271
00:13:08,080 --> 00:13:09,600
Event Grid doesn't guarantee delivery orders.
272
00:13:09,600 --> 00:13:13,720
If you use it as the main home for high volume telemetry, a subscriber can receive messages
273
00:13:13,720 --> 00:13:17,120
in an order that doesn't match the order in which the machine produced them.
274
00:13:17,120 --> 00:13:19,120
You can try to repair that in every handler.
275
00:13:19,120 --> 00:13:20,120
Add timestamps.
276
00:13:20,120 --> 00:13:24,400
Hold messages briefly, sort them, deduplicate them, track the last known state.
277
00:13:24,400 --> 00:13:28,380
When you discover that your simple event-driven design now contains several home-built stream
278
00:13:28,380 --> 00:13:31,840
processes, each with slightly different logic and no shared record of truth.
279
00:13:31,840 --> 00:13:33,800
That's not an event-driven architecture.
280
00:13:33,800 --> 00:13:36,600
That's a distributed troubleshooting exercise with better branding.
281
00:13:36,600 --> 00:13:38,560
The reverse mistake causes trouble too.
282
00:13:38,560 --> 00:13:42,800
Teams sometimes take sparse lifecycle signals, such as device registration or a connection
283
00:13:42,800 --> 00:13:45,640
change, and send them only into a broad data path.
284
00:13:45,640 --> 00:13:50,440
The notification reaches storage and becomes available for analysis, but no subscriber receives
285
00:13:50,440 --> 00:13:56,240
a prompt trigger to check the device, update a registry, or start an owner assignment process.
286
00:13:56,240 --> 00:13:58,480
The data exists yet the work doesn't start.
287
00:13:58,480 --> 00:14:01,880
Those two failures come from treating all messages as interchangeable because they share
288
00:14:01,880 --> 00:14:03,120
a transport name.
289
00:14:03,120 --> 00:14:04,520
They aren't interchangeable.
290
00:14:04,520 --> 00:14:05,680
Their volume may differ.
291
00:14:05,680 --> 00:14:07,240
Their need for order may differ.
292
00:14:07,240 --> 00:14:08,720
Their consumers may differ.
293
00:14:08,720 --> 00:14:11,720
Most of all, the question each message supports may differ.
294
00:14:11,720 --> 00:14:15,320
A telemetry message often asks, "What has this asset been doing?"
295
00:14:15,320 --> 00:14:18,840
A lifecycle event asks, "What changed and who should check it?"
296
00:14:18,840 --> 00:14:22,840
Other questions can refer to the same device that doesn't turn them into the same data contract.
297
00:14:22,840 --> 00:14:25,600
There is also a people problem here, not just a cloud problem.
298
00:14:25,600 --> 00:14:29,720
When ordinary sensor traffic starts workflows, plant teams lose trust in alerts.
299
00:14:29,720 --> 00:14:33,400
They learn that a notification might mean anything from a routine reading to a real production
300
00:14:33,400 --> 00:14:35,320
issue, so they begin to ignore it.
301
00:14:35,320 --> 00:14:37,120
That response makes perfect sense.
302
00:14:37,120 --> 00:14:40,440
The system trains them to treat its messages as background noise.
303
00:14:40,440 --> 00:14:43,000
Good industrial architecture protects attention.
304
00:14:43,000 --> 00:14:46,760
It keeps the continuous record available for analysis, and it raises a response signal
305
00:14:46,760 --> 00:14:48,760
when a defined condition needs a response.
306
00:14:48,760 --> 00:14:51,480
Those are connected parts, but they should stay distinct.
307
00:14:51,480 --> 00:14:55,400
With that boundary clear, we can define the first Azure role without turning this into
308
00:14:55,400 --> 00:14:56,920
a product tour.
309
00:14:56,920 --> 00:14:59,200
What Azure IoT Hub actually handles?
310
00:14:59,200 --> 00:15:02,360
Azure IoT Hub sits at the point where a physical device meets the cloud.
311
00:15:02,360 --> 00:15:07,200
In a plant that device may be an industrial gateway, a sensor package, a PLC connected edge
312
00:15:07,200 --> 00:15:10,840
computer, or a purpose-built machine controller that can securely communicate beyond the
313
00:15:10,840 --> 00:15:11,840
OT network.
314
00:15:11,840 --> 00:15:13,560
Its first job is identity.
315
00:15:13,560 --> 00:15:17,560
Each device connects with its own identity and access rights, rather than every machine
316
00:15:17,560 --> 00:15:19,560
sharing one broad connection secret.
317
00:15:19,560 --> 00:15:23,440
That matters in manufacturing because a device isn't just another application client.
318
00:15:23,440 --> 00:15:27,960
It belongs to an asset, a line, a site, and an owner, and it may need to lose access without
319
00:15:27,960 --> 00:15:30,200
disrupting every other device in the plant.
320
00:15:30,200 --> 00:15:34,000
You can revoke or change a device's access independently.
321
00:15:34,000 --> 00:15:36,920
You can track which device communicates with the hub.
322
00:15:36,920 --> 00:15:40,680
And you can build a managed boundary between equipment networks and cloud services, rather
323
00:15:40,680 --> 00:15:45,000
than allowing every gateway to send data directly into every downstream system.
324
00:15:45,000 --> 00:15:47,680
That boundary doesn't remove the need for OT security.
325
00:15:47,680 --> 00:15:51,960
It doesn't replace network segmentation, firewall rules, industrial protocol controls,
326
00:15:51,960 --> 00:15:56,240
or a sensible edge design, but it gives the cloud side a controlled entry point for device
327
00:15:56,240 --> 00:15:57,240
communication.
328
00:15:57,240 --> 00:16:01,680
The next job is device to cloud messaging, a gateway can send its telemetry to IoT Hub,
329
00:16:01,680 --> 00:16:04,880
where the platform accepts the message under the device identity that sent it.
330
00:16:04,880 --> 00:16:09,000
The message may carry sensor values, a machine state, an edge-calculated result, or a production
331
00:16:09,000 --> 00:16:11,440
signal prepared by software near the machine.
332
00:16:11,440 --> 00:16:15,440
That doesn't mean IoT Hub understands the press, the recipe, or the work order.
333
00:16:15,440 --> 00:16:17,680
It knows that an approved device sent a message.
334
00:16:17,680 --> 00:16:21,760
The meaning of that message still depends on the data contract you define, and the manufacturing
335
00:16:21,760 --> 00:16:23,440
context you connect later.
336
00:16:23,440 --> 00:16:25,760
That distinction saves a lot of bad assumptions.
337
00:16:25,760 --> 00:16:30,320
If a gateway sends a field called state with the value running, IoT Hub can receive it
338
00:16:30,320 --> 00:16:32,480
safely and forward it based on your rules.
339
00:16:32,480 --> 00:16:37,640
It can't decide whether running means producing good parts, dry cycling, setup, rework,
340
00:16:37,640 --> 00:16:39,520
or a machine moving without material.
341
00:16:39,520 --> 00:16:42,640
For MES and asset model, still carry that part of the truth.
342
00:16:42,640 --> 00:16:47,040
IoT Hub also supports communication in the other direction, from cloud to device.
343
00:16:47,040 --> 00:16:50,520
That can support commands, configuration changes, acknowledgments, or a request for a
344
00:16:50,520 --> 00:16:52,560
device to perform a defined action.
345
00:16:52,560 --> 00:16:55,360
In a factory though, cloud to device messaging needs restraint.
346
00:16:55,360 --> 00:16:58,680
A cloud command isn't a substitute for a safety-rated control system.
347
00:16:58,680 --> 00:17:03,520
If a command could affect machine motion, product quality, or operator safety, you need clear
348
00:17:03,520 --> 00:17:07,960
control rules, local safeguards, and an OT design that can behave safely when the
349
00:17:07,960 --> 00:17:09,280
cloud disappears.
350
00:17:09,280 --> 00:17:11,560
The cloud can coordinate or request actions.
351
00:17:11,560 --> 00:17:15,040
The machine control layer remains responsible for safe physical behavior.
352
00:17:15,040 --> 00:17:19,520
There is another part of IoT Hub that often gets mixed up with telemetry, device twins.
353
00:17:19,520 --> 00:17:23,400
A device twin is a cloud side document that represents state associated with a device.
354
00:17:23,400 --> 00:17:27,480
It separates desired properties, which the cloud wants the device to apply, from reported
355
00:17:27,480 --> 00:17:31,600
properties, which the device reports about its current condition or configuration.
356
00:17:31,600 --> 00:17:33,640
Imagine a gateway assigned to line two.
357
00:17:33,640 --> 00:17:37,280
The cloud may set a desired sampling interval or a configuration version.
358
00:17:37,280 --> 00:17:41,480
The gateway reports which version it actually applied when it last checked in and perhaps
359
00:17:41,480 --> 00:17:43,440
which firmware build it runs.
360
00:17:43,440 --> 00:17:47,040
That creates a manageable conversation about configuration without treating every change
361
00:17:47,040 --> 00:17:49,360
as a command sent at the exact same moment.
362
00:17:49,360 --> 00:17:53,160
For industrial systems, twins work well for device and gateway state.
363
00:17:53,160 --> 00:17:56,320
They don't automatically become a complete digital twin of the factory.
364
00:17:56,320 --> 00:17:59,920
A device twin can describe a gateway's reported software version.
365
00:17:59,920 --> 00:18:04,600
It doesn't buy itself, describe which machine the gateway observes, which cell contains
366
00:18:04,600 --> 00:18:09,000
that machine, which products it can produce or how a failed sensor affects a customer order.
367
00:18:09,000 --> 00:18:13,240
You need an asset model, MES links and sometimes a knowledge graph for that wider context.
368
00:18:13,240 --> 00:18:15,920
So think of IoT Hub as the device facing boundary.
369
00:18:15,920 --> 00:18:21,280
It handles secure device identity, device to cloud messages, cloud to device communication
370
00:18:21,280 --> 00:18:25,480
and device management state in a way that fits connected equipment.
371
00:18:25,480 --> 00:18:29,160
It doesn't replace the PLC, it doesn't replace the mess, it doesn't turn raw sensor data
372
00:18:29,160 --> 00:18:31,920
into production truth simply by accepting it.
373
00:18:31,920 --> 00:18:36,000
Since IoT Hub accepts a message another question takes over, where should that message travel
374
00:18:36,000 --> 00:18:38,400
and which downstream system should receive it?
375
00:18:38,400 --> 00:18:41,520
IoT Hub message routing as the telemetry data plane.
376
00:18:41,520 --> 00:18:46,080
Once a device message enters IoT Hub, message routing decides which approved downstream path
377
00:18:46,080 --> 00:18:47,080
receives it.
378
00:18:47,080 --> 00:18:49,680
Think of routing as traffic rules at the edge of the cloud.
379
00:18:49,680 --> 00:18:54,320
The device sends one message and IoT Hub evaluates rules you define before it sends that
380
00:18:54,320 --> 00:18:55,680
message onward.
381
00:18:55,680 --> 00:18:59,240
That matters because a plant rarely has one consumer for telemetry.
382
00:18:59,240 --> 00:19:03,080
Transparenced data may need to feed a stream path for current operational analysis, while
383
00:19:03,080 --> 00:19:06,000
another copy needs to land in storage for traceability.
384
00:19:06,000 --> 00:19:10,040
A separate consumer may need a filtered set of messages for an application that tracks
385
00:19:10,040 --> 00:19:12,000
energy or machine condition.
386
00:19:12,000 --> 00:19:16,120
Routing lets you send those messages to selected endpoints without teaching every gateway
387
00:19:16,120 --> 00:19:17,760
about every downstream system.
388
00:19:17,760 --> 00:19:19,200
The gateway sends to IoT Hub.
389
00:19:19,200 --> 00:19:22,280
The cloud architecture takes responsibility for distribution from there.
390
00:19:22,280 --> 00:19:25,000
The route can inspect information attached to the message.
391
00:19:25,000 --> 00:19:29,160
That includes application properties, system properties and where your design needs it parts
392
00:19:29,160 --> 00:19:30,440
of the message body.
393
00:19:30,440 --> 00:19:34,280
It can also use device twin tags and properties as part of a routing query, say a gateway
394
00:19:34,280 --> 00:19:37,320
sends telemetry from several assets through one connection.
395
00:19:37,320 --> 00:19:41,760
The message can carry an asset identifier, a signal type and a source timestamp.
396
00:19:41,760 --> 00:19:45,360
You might route production state messages to one path, energy readings to another and
397
00:19:45,360 --> 00:19:47,400
diagnostic messages to a third.
398
00:19:47,400 --> 00:19:51,360
Or you may use a twin tag that identifies a device as belonging to a particular site or
399
00:19:51,360 --> 00:19:55,480
production area, then apply a route based on that managed device context.
400
00:19:55,480 --> 00:19:58,280
The important part is where that filtering happens and you don't want every downstream
401
00:19:58,280 --> 00:20:02,520
consumer receiving every message, then each team writing its own logic to discard most
402
00:20:02,520 --> 00:20:03,520
of the traffic.
403
00:20:03,520 --> 00:20:06,200
That creates duplicate work and inconsistent rules.
404
00:20:06,200 --> 00:20:10,160
A route gives you a controlled first decision about where a message belongs.
405
00:20:10,160 --> 00:20:12,560
It doesn't decide what the message means operationally.
406
00:20:12,560 --> 00:20:14,400
It decides where the message should go.
407
00:20:14,400 --> 00:20:18,680
IoT Hub can route device to cloud messages to Azure event hubs, Azure storage, Azure
408
00:20:18,680 --> 00:20:24,000
service bus queues or topics and on paid IoT Hub tears that supported Azure Cosmos DB.
409
00:20:24,000 --> 00:20:27,760
Each destination fits a different downstream job, so naming the endpoint alone doesn't
410
00:20:27,760 --> 00:20:29,200
finish the design.
411
00:20:29,200 --> 00:20:32,640
Event hubs usually fits when you need a stream that several independent consumers can
412
00:20:32,640 --> 00:20:33,640
read.
413
00:20:33,640 --> 00:20:37,760
One consumer may process current data, another may prepare data for later analysis.
414
00:20:37,760 --> 00:20:41,840
The stream lets those consumers work at their own pace, subject to the retention and consumer
415
00:20:41,840 --> 00:20:43,240
design you choose.
416
00:20:43,240 --> 00:20:48,000
Azure storage fits when you need an economical raw record that can support later inspection
417
00:20:48,000 --> 00:20:50,360
audit work or batch processing.
418
00:20:50,360 --> 00:20:54,720
Service bus can fit when telemetry produces a defined business message that an application
419
00:20:54,720 --> 00:20:57,240
must process through a queue or topic pattern.
420
00:20:57,240 --> 00:21:01,840
Cosmos DB can fit selected operational application patterns where low latency document access
421
00:21:01,840 --> 00:21:02,840
makes sense.
422
00:21:02,840 --> 00:21:05,720
None of those choices turns telemetry into a business decision.
423
00:21:05,720 --> 00:21:09,760
They give the telemetry a destination where a later process can do useful work with it.
424
00:21:09,760 --> 00:21:12,520
There is a practical advantage here that people sometimes miss.
425
00:21:12,520 --> 00:21:16,120
IoT Hub message routing doesn't add a separate routing charge beyond the telemetry
426
00:21:16,120 --> 00:21:17,240
ingress charge.
427
00:21:17,240 --> 00:21:20,780
If you root the same incoming device message to several configured endpoints, the routing
428
00:21:20,780 --> 00:21:25,080
itself doesn't turn that one incoming message into several IoT Hub ingress charges.
429
00:21:25,080 --> 00:21:28,160
That doesn't mean the rest of the architecture costs nothing.
430
00:21:28,160 --> 00:21:32,360
Storage, stream processing, downstream compute and data movement all need their own cost
431
00:21:32,360 --> 00:21:35,880
and capacity planning, but it does mean you shouldn't force unrelated consumers to share
432
00:21:35,880 --> 00:21:40,160
one fragile path just because you assume each additional root creates another IoT Hub
433
00:21:40,160 --> 00:21:41,160
ingestion will.
434
00:21:41,160 --> 00:21:43,320
Ordering also shapes the decision.
435
00:21:43,320 --> 00:21:47,880
Microsoft documents that IoT Hub message routing maintains the order of routed messages.
436
00:21:47,880 --> 00:21:52,000
For production telemetry that gives you a stronger starting point than a notification path
437
00:21:52,000 --> 00:21:55,440
where consumers may receive messages in a different order from the source.
438
00:21:55,440 --> 00:21:59,720
Still, don't turn that statement into a guarantee your full business process can't support.
439
00:21:59,720 --> 00:22:03,960
Your partition strategy, consumer design, timestamp rules, retries and device behavior
440
00:22:03,960 --> 00:22:04,960
still matter.
441
00:22:04,960 --> 00:22:07,720
A gateway may buffer data during a network interruption.
442
00:22:07,720 --> 00:22:09,160
A device clock may drift.
443
00:22:09,160 --> 00:22:13,120
A consumer may process the same message more than once, because the delivery model aims
444
00:22:13,120 --> 00:22:15,480
for at least once delivery.
445
00:22:15,480 --> 00:22:19,680
Routing preserves an ordered path, but your application still needs to identify duplicates
446
00:22:19,680 --> 00:22:23,440
and reason carefully about source time versus cloud arrival time.
447
00:22:23,440 --> 00:22:26,880
That's normal engineering, especially in OT and IT convergence.
448
00:22:26,880 --> 00:22:30,000
Physical systems don't pause politely while networks reconnect.
449
00:22:30,000 --> 00:22:33,880
So, the right way to view IoT Hub message routing is as the telemetry data plane.
450
00:22:33,880 --> 00:22:37,640
It takes device messages that need a controlled, filtered ordered path and directs them to
451
00:22:37,640 --> 00:22:41,400
the services built to retain, process or distribute operational facts.
452
00:22:41,400 --> 00:22:43,480
A route can move the facts reliably.
453
00:22:43,480 --> 00:22:48,360
It doesn't decide which person needs an alert when those facts point to a problem.
454
00:22:48,360 --> 00:22:50,320
Route 1 preserving the production story.
455
00:22:50,320 --> 00:22:52,360
Let's put a real route around the press line.
456
00:22:52,360 --> 00:22:56,600
The gateway sends a message each time it has a new set of readings worth sending upstream.
457
00:22:56,600 --> 00:22:59,680
That message needs more than a temperature and a vibration value if you want to use it
458
00:22:59,680 --> 00:23:00,680
later.
459
00:23:00,680 --> 00:23:04,520
It should carry a source timestamp, a sequence number where the gateway can provide one,
460
00:23:04,520 --> 00:23:08,040
the asset identity and a clear machine state.
461
00:23:08,040 --> 00:23:10,200
Context travels with the message where it can.
462
00:23:10,200 --> 00:23:14,080
For this press, the gateway might also include the active work order reference that it received
463
00:23:14,080 --> 00:23:18,320
from the local production system or a correlation ID that lets another service connect the reading
464
00:23:18,320 --> 00:23:19,720
to the right operation.
465
00:23:19,720 --> 00:23:23,160
I'd still treat the MES as the authority for work order status.
466
00:23:23,160 --> 00:23:26,920
But adding a reference to the telemetry creates a usable link between a physical signal
467
00:23:26,920 --> 00:23:28,200
and the production record.
468
00:23:28,200 --> 00:23:31,440
A message could say in plane terms, this came from press 12.
469
00:23:31,440 --> 00:23:33,640
It was the next message in this device sequence.
470
00:23:33,640 --> 00:23:37,960
The press reported that it was running and the gateway observed it at this time.
471
00:23:37,960 --> 00:23:42,560
It may also carry a cycle count, motor current, die temperature, vibration values, and a small
472
00:23:42,560 --> 00:23:45,200
set of quality related process signals.
473
00:23:45,200 --> 00:23:48,120
That's enough to reconstruct part of the shift later.
474
00:23:48,120 --> 00:23:52,320
At IoT Hub, a route can select this production telemetry based on properties that the gateway
475
00:23:52,320 --> 00:23:53,560
sets consistently.
476
00:23:53,560 --> 00:23:56,520
You might mark the message type as production telemetry.
477
00:23:56,520 --> 00:24:00,800
You might separate it from gateway diagnostics, configuration acknowledgments, or infrequent
478
00:24:00,800 --> 00:24:02,240
maintenance status messages.
479
00:24:02,240 --> 00:24:04,480
The exact naming matters less than discipline.
480
00:24:04,480 --> 00:24:08,160
One who produces and consumes the data needs to mean the same thing by it.
481
00:24:08,160 --> 00:24:11,600
The selected telemetry can then flow into Azure EventHubs.
482
00:24:11,600 --> 00:24:15,200
EventHubs gives downstream consumers a stream they can read independently.
483
00:24:15,200 --> 00:24:19,040
One consumer might calculate current operating conditions, another might prepare data for
484
00:24:19,040 --> 00:24:20,200
a data platform.
485
00:24:20,200 --> 00:24:24,360
A third might watch for data quality issues, such as a gateway that suddenly stops sending
486
00:24:24,360 --> 00:24:27,040
one signal while continuing to send everything else.
487
00:24:27,040 --> 00:24:28,800
Those consumers should not block each other.
488
00:24:28,800 --> 00:24:30,040
That matters during a busy shift.
489
00:24:30,040 --> 00:24:33,280
A data engineering process may fall behind for a short period.
490
00:24:33,280 --> 00:24:36,000
And near real time process may still need to continue.
491
00:24:36,000 --> 00:24:39,560
If both depend on one custom service reading a message once and forwarding it perfectly
492
00:24:39,560 --> 00:24:43,520
to every other system, you've created a narrow point of failure right in the middle of your
493
00:24:43,520 --> 00:24:44,800
production record.
494
00:24:44,800 --> 00:24:46,080
The stream creates a better boundary.
495
00:24:46,080 --> 00:24:50,560
Alongside that streaming path, I'd usually keep a raw copy of the incoming messages in
496
00:24:50,560 --> 00:24:51,640
storage.
497
00:24:51,640 --> 00:24:55,520
Not because raw data is automatically useful, but because you'll eventually need to answer
498
00:24:55,520 --> 00:24:58,520
a question that the curated model didn't anticipate.
499
00:24:58,520 --> 00:25:02,280
An engineer may ask why a condition model flagged a machine on a specific day.
500
00:25:02,280 --> 00:25:05,920
A quality team may need to inspect the sensor history around a batch issue.
501
00:25:05,920 --> 00:25:10,840
An OT engineer may need to compare the source payload with what a downstream process interpreted.
502
00:25:10,840 --> 00:25:14,200
Without a retained raw record, every one of those questions turns into a hunt through
503
00:25:14,200 --> 00:25:18,520
transformed tables, partial logs, and somebody's memory that gets old quickly.
504
00:25:18,520 --> 00:25:22,720
The raw copy should preserve the original device facts and the technical metadata that
505
00:25:22,720 --> 00:25:24,720
explains how those facts arrived.
506
00:25:24,720 --> 00:25:26,200
Keep the device identity.
507
00:25:26,200 --> 00:25:28,880
Keep source time and cloud receipt time were available.
508
00:25:28,880 --> 00:25:31,400
Keep the message properties that controlled routing.
509
00:25:31,400 --> 00:25:34,120
If the gateway assigns a sequence number, retain that too.
510
00:25:34,120 --> 00:25:37,320
Later processing can clean, normalize, and enrich the data.
511
00:25:37,320 --> 00:25:40,600
The raw record should stay closer to what the device actually sent.
512
00:25:40,600 --> 00:25:44,640
From there, a prepared operational data set can move into Microsoft Fabric through a pipeline
513
00:25:44,640 --> 00:25:46,040
that fits your data design.
514
00:25:46,040 --> 00:25:50,360
I'm being deliberate with that wording, because Fabric isn't a magic destination where raw
515
00:25:50,360 --> 00:25:53,680
machine messages somehow become trusted production facts.
516
00:25:53,680 --> 00:25:57,800
Before data reaches reporting or wider analysis, you need to decide how to handle device clock
517
00:25:57,800 --> 00:26:02,280
errors, later rivals, duplicate messages, unit conversions, missing values, and changes to
518
00:26:02,280 --> 00:26:03,520
the gateway payload.
519
00:26:03,520 --> 00:26:07,920
You also need to connect the signal to the asset model and where the use case needs it
520
00:26:07,920 --> 00:26:09,880
to a me as production context.
521
00:26:09,880 --> 00:26:14,560
That prepared layer might turn a raw message into a statement such as press 12, ran during
522
00:26:14,560 --> 00:26:19,360
this operation window with these process readings against this work order reference.
523
00:26:19,360 --> 00:26:22,720
The transformation needs clear rules and those rules need an owner.
524
00:26:22,720 --> 00:26:26,200
Otherwise, a clean looking table can hide a fairly messy interpretation.
525
00:26:26,200 --> 00:26:30,600
Once Fabric receives prepared operational data, power BI and other consumers can use a model
526
00:26:30,600 --> 00:26:31,840
built for their question.
527
00:26:31,840 --> 00:26:35,320
A production engineer may inspect patterns by asset and shift.
528
00:26:35,320 --> 00:26:38,200
An energy analyst may compare consumption across lines.
529
00:26:38,200 --> 00:26:41,600
A maintenance team may review trend history around a known fault.
530
00:26:41,600 --> 00:26:44,000
Each view starts from the same production story.
531
00:26:44,000 --> 00:26:45,720
Notice what the root itself has done.
532
00:26:45,720 --> 00:26:47,680
It has moved and preserved machine facts.
533
00:26:47,680 --> 00:26:50,480
It has given several consumers a controlled way to read them.
534
00:26:50,480 --> 00:26:54,240
It has supported both current processing and later investigation, but it hasn't decided
535
00:26:54,240 --> 00:26:56,480
whether anyone needs immediate attention.
536
00:26:56,480 --> 00:27:00,440
That requires a separate response signal with a clear reason for action.
537
00:27:00,440 --> 00:27:02,600
Why ordering matters more than it sounds?
538
00:27:02,600 --> 00:27:06,560
A production record only works if you can place facts in the right sequence.
539
00:27:06,560 --> 00:27:09,880
That sounds obvious, but it's one of those details that stays invisible until someone tries
540
00:27:09,880 --> 00:27:13,880
to explain a stop, a quality issue, or a count that doesn't match the MES.
541
00:27:13,880 --> 00:27:14,880
Take a press cycle.
542
00:27:14,880 --> 00:27:17,320
The gateway reports that the press entered run state.
543
00:27:17,320 --> 00:27:19,080
Then it reports cycle counts increasing.
544
00:27:19,080 --> 00:27:21,560
A process value moves outside its normal band.
545
00:27:21,560 --> 00:27:23,120
Finally, the press reports a stop.
546
00:27:23,120 --> 00:27:27,040
If you can preserve that sequence, a later consumer can ask sensible questions.
547
00:27:27,040 --> 00:27:29,480
Did the process condition appear before the stop?
548
00:27:29,480 --> 00:27:31,840
Did the stop happen during the active operation?
549
00:27:31,840 --> 00:27:34,680
And did production resume after an operator action?
550
00:27:34,680 --> 00:27:36,440
The order carries meaning.
551
00:27:36,440 --> 00:27:39,360
Now imagine the same messages arrive in a different order downstream.
552
00:27:39,360 --> 00:27:40,960
A stop arrives first.
553
00:27:40,960 --> 00:27:43,800
Then a cycle count arrives that actually occurred before the stop.
554
00:27:43,800 --> 00:27:45,160
Then the process value turns up.
555
00:27:45,160 --> 00:27:49,360
A simple state calculation may conclude that the press produced parts, while stopped, or
556
00:27:49,360 --> 00:27:52,560
that the quality condition happened after production ended.
557
00:27:52,560 --> 00:27:54,040
Neither conclusion needs to be true.
558
00:27:54,040 --> 00:27:56,000
The system only lost the sequence.
559
00:27:56,000 --> 00:27:57,240
Downtime windows are a good example.
560
00:27:57,240 --> 00:28:01,360
Many teams calculate downtime by taking the time between a machine entering a stop state
561
00:28:01,360 --> 00:28:03,120
and returning to a running state.
562
00:28:03,120 --> 00:28:07,640
That logic seems simple until you include late messages, a gateway reconnect, or repeated
563
00:28:07,640 --> 00:28:09,560
delivery of the same state change.
564
00:28:09,560 --> 00:28:13,560
If the consumer treats cloud arrival time as a machine time, it can create a downtime
565
00:28:13,560 --> 00:28:16,200
window that belongs to the network rather than the machine.
566
00:28:16,200 --> 00:28:20,320
If it accepts every duplicate as a new state change, it can split one stop into several
567
00:28:20,320 --> 00:28:21,480
smaller stops.
568
00:28:21,480 --> 00:28:26,120
Then somebody asks why OEE dropped on a line that operators insist ran normally, and the
569
00:28:26,120 --> 00:28:28,320
answer sits buried in message handling logic.
570
00:28:28,320 --> 00:28:30,720
That's why I'd keep several time concept separate.
571
00:28:30,720 --> 00:28:34,560
The source timestamp tells you when the device or gateway observed the condition.
572
00:28:34,560 --> 00:28:38,240
The IoT Hub receipt time tells you when Azure accepted the message.
573
00:28:38,240 --> 00:28:40,800
Processing time tells you when a downstream service handled it.
574
00:28:40,800 --> 00:28:44,720
Those times can differ, especially when an edge device buffers data during a network
575
00:28:44,720 --> 00:28:47,120
loss and sends it after reconnecting.
576
00:28:47,120 --> 00:28:49,480
None of that means source time always wins.
577
00:28:49,480 --> 00:28:53,600
These clocks can drift, gateways can stamp a message after collecting the data.
578
00:28:53,600 --> 00:28:57,120
Sometimes the machine controller has the most trustworthy clock and sometimes it doesn't.
579
00:28:57,120 --> 00:29:01,600
You need an explicit rule for which timestamp supports each operational question, rather
580
00:29:01,600 --> 00:29:05,640
than letting whichever field appears first in a dataset decide the story.
581
00:29:05,640 --> 00:29:07,360
Partitioning deserves the same level of care.
582
00:29:07,360 --> 00:29:11,240
A routed path can maintain message order, but order has to relate to the unit of work
583
00:29:11,240 --> 00:29:12,440
that matters.
584
00:29:12,440 --> 00:29:16,600
If messages from one asset land across partitions without a consistent partition choice,
585
00:29:16,600 --> 00:29:19,920
a consumer may not see the full sequence as one ordered stream.
586
00:29:19,920 --> 00:29:23,440
For a machine level state reconstruction, you usually want a stable way to keep that
587
00:29:23,440 --> 00:29:28,360
machines related messages together that doesn't mean you put an entire plan through one partition.
588
00:29:28,360 --> 00:29:30,360
You still need throughput and parallel processing.
589
00:29:30,360 --> 00:29:33,400
It means you choose a partition approach that matches the question.
590
00:29:33,400 --> 00:29:38,440
A single asset, a gateway, or another defined source boundary may provide the right grouping,
591
00:29:38,440 --> 00:29:40,320
depending on how the data arrives.
592
00:29:40,320 --> 00:29:41,800
Then there's duplicate delivery.
593
00:29:41,800 --> 00:29:45,040
IoT Hub message routing follows an at least once delivery model.
594
00:29:45,040 --> 00:29:48,840
In plain English, a downstream endpoint can receive the same message more than once.
595
00:29:48,840 --> 00:29:52,680
That protects against silent loss, which is the right bias for industrial data, but it means
596
00:29:52,680 --> 00:29:55,000
every consumer needs a duplicate strategy.
597
00:29:55,000 --> 00:29:56,480
A sequence number can help.
598
00:29:56,480 --> 00:29:58,280
Device-generated message ID can help.
599
00:29:58,280 --> 00:30:02,760
A composite identity built from device ID, source time, and sequence can help if the source
600
00:30:02,760 --> 00:30:04,360
can create it consistently.
601
00:30:04,360 --> 00:30:08,240
The exact method depends on the equipment and gateway software, but the principle stays
602
00:30:08,240 --> 00:30:09,240
the same.
603
00:30:09,240 --> 00:30:12,800
A consumer must recognize whether it has already processed this production fact.
604
00:30:12,800 --> 00:30:16,440
Don't confuse order delivery with exactly one's business outcomes.
605
00:30:16,440 --> 00:30:20,280
Even when messages arrive in order, a consumer might crash after updating a table, but before
606
00:30:20,280 --> 00:30:21,760
recording its checkpoint.
607
00:30:21,760 --> 00:30:24,720
When it restarts, it may process the message again.
608
00:30:24,720 --> 00:30:28,560
Or two downstream systems may interpret the same machine state differently because their
609
00:30:28,560 --> 00:30:30,160
business rules differ.
610
00:30:30,160 --> 00:30:32,200
Transport order can give you a stable foundation.
611
00:30:32,200 --> 00:30:36,040
It can't remove the need for, idempotent processing, clear data ownership, and careful
612
00:30:36,040 --> 00:30:37,040
state logic.
613
00:30:37,040 --> 00:30:38,640
That's not a flaw in the platform.
614
00:30:38,640 --> 00:30:42,040
It's what reliable distributed systems look like once they meet physical equipment and
615
00:30:42,040 --> 00:30:43,360
imperfect networks.
616
00:30:43,360 --> 00:30:48,120
For telemetry, this work earns its place because the sequence itself supports analysis,
617
00:30:48,120 --> 00:30:50,280
traceability, and production facts.
618
00:30:50,280 --> 00:30:53,400
But some messages don't need a consumer to reconstruct history.
619
00:30:53,400 --> 00:30:57,360
They need a team or system to react to a change, and that takes us from data transport
620
00:30:57,360 --> 00:30:58,960
into response signals.
621
00:30:58,960 --> 00:31:01,360
What Azure Event Grid actually handles?
622
00:31:01,360 --> 00:31:04,840
Event Grid handles the moment when something changes and other systems need to know about
623
00:31:04,840 --> 00:31:05,840
it.
624
00:31:05,840 --> 00:31:09,520
It uses a published subscribe model which sounds abstract, until you put it in a plant,
625
00:31:09,520 --> 00:31:13,600
a device, an Azure service, or an application publishes a notice.
626
00:31:13,600 --> 00:31:17,520
Systems that subscribe to that type of notice, receive it and decide what to do.
627
00:31:17,520 --> 00:31:21,960
They don't need to sit there reading a long stream and waiting for their one relevant message.
628
00:31:21,960 --> 00:31:23,760
Event Grid pushes the event to them.
629
00:31:23,760 --> 00:31:25,600
That fits work which starts because of a change.
630
00:31:25,600 --> 00:31:29,600
A device gets registered, a device disconnects, a device comes back online, an application
631
00:31:29,600 --> 00:31:31,800
detects a condition that needs review.
632
00:31:31,800 --> 00:31:35,480
Those events can go to separate handlers, and each handler can stay focused on its own
633
00:31:35,480 --> 00:31:39,800
job instead of becoming another consumer of the full telemetry flow.
634
00:31:39,800 --> 00:31:41,600
Think of a maintenance support process.
635
00:31:41,600 --> 00:31:46,720
It may care when a gateway disconnects because that means the plant has lost cloud visibility
636
00:31:46,720 --> 00:31:47,960
for a part of the line.
637
00:31:47,960 --> 00:31:52,280
An asset management process may care when a device gets created because it needs to check
638
00:31:52,280 --> 00:31:54,160
ownership and site assignment.
639
00:31:54,160 --> 00:31:57,720
A security process may care when a device gets deleted because it may need to remove
640
00:31:57,720 --> 00:32:00,040
related access or inspect what changed.
641
00:32:00,040 --> 00:32:02,080
Those processes don't need the same destination.
642
00:32:02,080 --> 00:32:06,600
With Event Grid, one event source can publish a notice and many subscribers can receive it.
643
00:32:06,600 --> 00:32:10,920
An Azure function can run a small piece of code to validate a condition or update a record.
644
00:32:10,920 --> 00:32:14,960
A logic app can start a workflow that sends a message, creates a task, or connects to
645
00:32:14,960 --> 00:32:16,240
an approved business system.
646
00:32:16,240 --> 00:32:21,400
A web hook can notify a service outside Azure where that makes sense for the architecture.
647
00:32:21,400 --> 00:32:24,240
Each subscriber gets a copy of the event intended for it.
648
00:32:24,240 --> 00:32:27,840
That fan outmodel matters when different teams own different reactions.
649
00:32:27,840 --> 00:32:31,960
The team that manages device identity shouldn't need to wait for the team that owns
650
00:32:31,960 --> 00:32:33,400
maintenance workflows.
651
00:32:33,400 --> 00:32:36,760
The maintenance process shouldn't need access to the provisioning logic.
652
00:32:36,760 --> 00:32:40,880
Event Grid lets them react independently to the same change with each subscription defining
653
00:32:40,880 --> 00:32:42,280
what it wants to receive.
654
00:32:42,280 --> 00:32:45,520
But Independence also means the subscribers must act defensively.
655
00:32:45,520 --> 00:32:48,040
Event Grid delivery follows an at least once model.
656
00:32:48,040 --> 00:32:52,000
A handler can receive an event more than once so it needs to process the event safely
657
00:32:52,000 --> 00:32:53,200
if a retry occurs.
658
00:32:53,200 --> 00:32:55,960
It also doesn't promise that events arrive in the order they happened.
659
00:32:55,960 --> 00:33:00,240
A handler can't blindly assume that a connection notice gives it the full and final
660
00:33:00,240 --> 00:33:01,840
current state of a device.
661
00:33:01,840 --> 00:33:03,720
So this kind of work that is usually manageable.
662
00:33:03,720 --> 00:33:08,280
A disconnect notification should often trigger a check, not an irreversible conclusion.
663
00:33:08,280 --> 00:33:12,520
The handler can inspect current device state, query a registry, or test whether the device
664
00:33:12,520 --> 00:33:13,680
has already returned.
665
00:33:13,680 --> 00:33:17,440
It can record the event for audit purposes, then decide whether the condition still needs
666
00:33:17,440 --> 00:33:18,440
action.
667
00:33:18,440 --> 00:33:21,080
That approach fits an event notification model very well.
668
00:33:21,080 --> 00:33:24,800
The event itself needs enough information to point the handler in the right direction.
669
00:33:24,800 --> 00:33:27,880
It has a type that tells the subscriber what kind of change occurred.
670
00:33:27,880 --> 00:33:32,520
It includes a subject which commonly identifies the affected resource or device.
671
00:33:32,520 --> 00:33:37,160
It also carries event data that the handler can inspect before it starts its work.
672
00:33:37,160 --> 00:33:40,920
For an industrial solution, the device ID gives you a technical starting point.
673
00:33:40,920 --> 00:33:45,480
Your own asset model then connects that device to a gateway, machine, cell, line, site, and
674
00:33:45,480 --> 00:33:46,480
owner.
675
00:33:46,480 --> 00:33:47,560
Event Grid carries the notice.
676
00:33:47,560 --> 00:33:49,920
It doesn't hold the whole factory model in its head.
677
00:33:49,920 --> 00:33:52,440
That distinction protects you from a common design mistake.
678
00:33:52,440 --> 00:33:56,240
A subscriber receives a device disconnected event then assumes it knows that a press stopped
679
00:33:56,240 --> 00:33:57,240
producing.
680
00:33:57,240 --> 00:33:59,440
It knows a device connection changed.
681
00:33:59,440 --> 00:34:03,080
Any production conclusion must come from the right mix of machine state, MS facts, and
682
00:34:03,080 --> 00:34:04,600
asset context.
683
00:34:04,600 --> 00:34:08,040
Event Grid is a notification fabric, not an industrial historian.
684
00:34:08,040 --> 00:34:12,400
It is built to distribute notices in near real time, so reactive systems can start their own
685
00:34:12,400 --> 00:34:13,400
work.
686
00:34:13,400 --> 00:34:15,160
It doesn't replace a retained machine record.
687
00:34:15,160 --> 00:34:18,480
And it isn't the place to reconstruct hours of sensor behavior after a quality problem.
688
00:34:18,480 --> 00:34:22,240
You can think of it as the part of the architecture that says, "A known change occurred,"
689
00:34:22,240 --> 00:34:23,880
these systems asked to hear about it.
690
00:34:23,880 --> 00:34:28,700
The next action can be a technical check, a workflow, a record update, or a message to an
691
00:34:28,700 --> 00:34:29,920
accountable person.
692
00:34:29,920 --> 00:34:33,640
That makes it a strong fit for event-driven integration, particularly when many separate
693
00:34:33,640 --> 00:34:37,640
handlers need the same notice without tight coupling between their applications.
694
00:34:37,640 --> 00:34:42,840
IoT Hub can publish certain device and telemetry related events into that notification fabric.
695
00:34:42,840 --> 00:34:46,780
The details of which events it publishes and the limits that come with that integration
696
00:34:46,780 --> 00:34:50,720
shape whether event grid belongs in a specific manufacturing design.
697
00:34:50,720 --> 00:34:52,560
IoT Hub Event Grid integration.
698
00:34:52,560 --> 00:34:56,640
IoT Hub can publish selected device events into event grid, which gives you a direct bridge
699
00:34:56,640 --> 00:35:00,720
from connected equipment into a wider set of reactive Azure workflows.
700
00:35:00,720 --> 00:35:04,480
The event types matter because they tell you what IoT Hub is actually announcing.
701
00:35:04,480 --> 00:35:06,920
It can publish device created and device deleted events.
702
00:35:06,920 --> 00:35:10,520
It can publish device connected and device disconnected events.
703
00:35:10,520 --> 00:35:15,040
And it can publish device telemetry events when a device sends telemetry to the hub.
704
00:35:15,040 --> 00:35:18,040
Each event includes a subject that identifies the device.
705
00:35:18,040 --> 00:35:23,040
In practice, that subject follows the device identity path in the form of devices devised.
706
00:35:23,040 --> 00:35:27,000
That might sound like a small implementation detail, but it gives subscription rules a
707
00:35:27,000 --> 00:35:32,360
clean way to focus on a group of devices without asking every handler to inspect every event.
708
00:35:32,360 --> 00:35:35,320
Say your plant names gateways by site and production area.
709
00:35:35,320 --> 00:35:39,920
A subscription can focus on devices whose IDs begin with a site or line prefix.
710
00:35:39,920 --> 00:35:44,000
Or a handler can receive a device event, take the device ID, and use the asset model to
711
00:35:44,000 --> 00:35:48,080
find the machine, cell, owner, and support group linked to that gateway.
712
00:35:48,080 --> 00:35:50,200
The event carries the technical identity.
713
00:35:50,200 --> 00:35:53,120
Your manufacturing model supplies the operational meaning.
714
00:35:53,120 --> 00:35:57,080
Telemetry events through event grid need a little more discipline than lifecycle events.
715
00:35:57,080 --> 00:36:00,360
IoT Hub requires the telemetry payload to contain valid JSON.
716
00:36:00,360 --> 00:36:04,480
The message content type must be set to application JSON and the content encoding must be
717
00:36:04,480 --> 00:36:05,480
utf8.
718
00:36:05,480 --> 00:36:09,080
If those fields aren't set correctly, IoT Hub can't present the telemetry payload to
719
00:36:09,080 --> 00:36:11,120
event grid in the expected structure.
720
00:36:11,120 --> 00:36:15,400
That can seem annoyingly strict when you first meet it, but it forces a useful question,
721
00:36:15,400 --> 00:36:18,320
are your gateways publishing a defined message contract?
722
00:36:18,320 --> 00:36:23,200
Or are they just forwarding whatever shape of data happened to come from the equipment?
723
00:36:23,200 --> 00:36:25,800
For a manufacturing design, define that contract early.
724
00:36:25,800 --> 00:36:30,360
A telemetry message might include asset ID, source time, sequence, signal type, and the
725
00:36:30,360 --> 00:36:31,440
actual readings.
726
00:36:31,440 --> 00:36:35,760
You may also use message properties for details such as site, line, or data classification.
727
00:36:35,760 --> 00:36:39,560
When you later create event grid subscriptions, those fields give you ways to direct only the
728
00:36:39,560 --> 00:36:42,120
relevant notices to the systems that asked for them.
729
00:36:42,120 --> 00:36:45,040
This can work well when the same event needs broad fan-out.
730
00:36:45,040 --> 00:36:47,720
Imagine that a new industrial gateway is registered.
731
00:36:47,720 --> 00:36:51,040
The asset onboarding process needs to create or verify an equipment link.
732
00:36:51,040 --> 00:36:54,400
A security workflow needs to verify its owner and access status.
733
00:36:54,400 --> 00:36:58,360
The operations support team may need to confirm that the device belongs to the right plant
734
00:36:58,360 --> 00:36:59,360
and network zone.
735
00:36:59,360 --> 00:37:02,240
Those are separate reactions to one device created event.
736
00:37:02,240 --> 00:37:05,520
With event grid, each team can subscribe through its own handler.
737
00:37:05,520 --> 00:37:07,400
One path may call an Azure function.
738
00:37:07,400 --> 00:37:11,760
Another may start a logic app, a third may send a web hook to a system outside Azure, if
739
00:37:11,760 --> 00:37:14,840
that system belongs in the approved integration design.
740
00:37:14,840 --> 00:37:18,280
The same pattern applies to telemetry events, but you need to be selective.
741
00:37:18,280 --> 00:37:23,000
You might publish a filtered telemetry event when a gateway reports a defined machine condition.
742
00:37:23,000 --> 00:37:25,080
Several independent systems can then receive it.
743
00:37:25,080 --> 00:37:27,400
A maintenance application may record the condition.
744
00:37:27,400 --> 00:37:31,360
A workflow may open a review task, a data quality service may check whether related signals
745
00:37:31,360 --> 00:37:32,360
also arrived.
746
00:37:32,360 --> 00:37:35,560
That doesn't mean event grid should receive every sensor message simply because it can
747
00:37:35,560 --> 00:37:36,760
publish telemetry events.
748
00:37:36,760 --> 00:37:40,280
A fan out path has a purpose when several systems need a prompt notice.
749
00:37:40,280 --> 00:37:43,600
It becomes noise when routine measurements go everywhere and every team has to decide which
750
00:37:43,600 --> 00:37:44,600
ones matter.
751
00:37:44,600 --> 00:37:48,360
The scale difference gives event grid a clear place in large integration designs.
752
00:37:48,360 --> 00:37:53,720
IoT Hub message routing on paid tiers supports a limited set of custom endpoints, while event
753
00:37:53,720 --> 00:37:57,080
grid supports up to 500 endpoints per IoT Hub.
754
00:37:57,080 --> 00:38:01,480
That wider subscriber model helps when separate applications, teams and external services
755
00:38:01,480 --> 00:38:03,240
need their own event subscriptions.
756
00:38:03,240 --> 00:38:05,640
Still, more endpoints don't create more meaning.
757
00:38:05,640 --> 00:38:08,600
A larger fan out capability solves distribution.
758
00:38:08,600 --> 00:38:12,320
It doesn't tell you whether a device disconnect affects production, whether a temperature value
759
00:38:12,320 --> 00:38:15,840
needs action, or whether a workflow should change a plan.
760
00:38:15,840 --> 00:38:19,600
Those decisions still depend on the event contract, the current state of the equipment
761
00:38:19,600 --> 00:38:23,360
and context from systems such as the MES and asset model.
762
00:38:23,360 --> 00:38:25,840
So use the integration for what it does well.
763
00:38:25,840 --> 00:38:30,800
Publish clear device and telemetry related notices to systems that need to react independently.
764
00:38:30,800 --> 00:38:32,400
Keep the message shape deliberate.
765
00:38:32,400 --> 00:38:36,840
Device identity consistent and let the subscriber receive a notice that starts work rather
766
00:38:36,840 --> 00:38:39,840
than pretending it received a complete account of the factory.
767
00:38:39,840 --> 00:38:41,560
More subscribers solve one problem.
768
00:38:41,560 --> 00:38:43,320
They don't solve every problem.
769
00:38:43,320 --> 00:38:45,040
Event grid does not promise order.
770
00:38:45,040 --> 00:38:48,920
There is one constraint you need to design around before you use event grid for an industrial
771
00:38:48,920 --> 00:38:49,920
workflow.
772
00:38:49,920 --> 00:38:53,560
Event grid doesn't guarantee that subscribers receive events in the order they occurred.
773
00:38:53,560 --> 00:38:54,680
That's not an edge case.
774
00:38:54,680 --> 00:38:57,320
It changes while an event handler is allowed to conclude.
775
00:38:57,320 --> 00:39:01,360
Picture a gateway that briefly loses its cloud connection, reconnects, then loses it
776
00:39:01,360 --> 00:39:04,480
again while the plant network team works through a switch issue.
777
00:39:04,480 --> 00:39:08,280
IoT Hub may publish connection and disconnection events for those state changes.
778
00:39:08,280 --> 00:39:10,720
A subscriber could receive them in an awkward sequence.
779
00:39:10,720 --> 00:39:14,600
It might see a connected event after a later disconnected event or receive one notice
780
00:39:14,600 --> 00:39:17,560
after a delay while newer notices have already arrived.
781
00:39:17,560 --> 00:39:21,960
If the handler treats each incoming event as the final truth it can create the wrong operational
782
00:39:21,960 --> 00:39:22,960
state.
783
00:39:22,960 --> 00:39:26,240
You can end up with a support record that says the gateway is online when it has already
784
00:39:26,240 --> 00:39:27,240
dropped again.
785
00:39:27,240 --> 00:39:30,600
Or you can send an escalation to a line team after the connection recovered.
786
00:39:30,600 --> 00:39:32,600
Either outcome means event grid failed.
787
00:39:32,600 --> 00:39:35,280
The handler assumed more than the delivery model promised.
788
00:39:35,280 --> 00:39:36,760
So the right pattern is simple.
789
00:39:36,760 --> 00:39:38,560
Treat the event as a prompt to check.
790
00:39:38,560 --> 00:39:41,640
A device disconnected event can start in Azure Function.
791
00:39:41,640 --> 00:39:44,960
That function reads the current device state from the device registry or checks the
792
00:39:44,960 --> 00:39:49,120
relevant device twin then compares the current state with the event it received.
793
00:39:49,120 --> 00:39:53,520
If the device already reconnects, the function may record the short disruption and close the
794
00:39:53,520 --> 00:39:54,720
technical check.
795
00:39:54,720 --> 00:39:58,240
If the device still appears unavailable, it can raise the issue through the support path
796
00:39:58,240 --> 00:39:59,720
your plant has defined.
797
00:39:59,720 --> 00:40:01,720
The event starts the investigation.
798
00:40:01,720 --> 00:40:02,720
It doesn't settle it.
799
00:40:02,720 --> 00:40:05,240
This also protects you from duplicate delivery.
800
00:40:05,240 --> 00:40:09,080
Event grid uses at least one's delivery, which means a subscriber can receive the same
801
00:40:09,080 --> 00:40:10,440
event more than once.
802
00:40:10,440 --> 00:40:14,600
Your function or workflow needs a way to recognize that it already created the support case,
803
00:40:14,600 --> 00:40:18,120
already updated the asset status or already notified the responsible team.
804
00:40:18,120 --> 00:40:20,840
Item potency is the technical word for this.
805
00:40:20,840 --> 00:40:24,600
In plain terms, processing the same event twice should not create two tickets, two emails
806
00:40:24,600 --> 00:40:26,480
and two conflicting status changes.
807
00:40:26,480 --> 00:40:29,520
A good handler stores enough information to make that decision.
808
00:40:29,520 --> 00:40:32,440
It may use the event ID as a processed record reference.
809
00:40:32,440 --> 00:40:35,560
It may keep the latest known state and timestamp for the device.
810
00:40:35,560 --> 00:40:39,400
For life cycle changes such as device creation or deletion, it can inspect the versioning
811
00:40:39,400 --> 00:40:42,560
information and current registry state before it changes anything.
812
00:40:42,560 --> 00:40:45,800
That might sound like extra work for a simple notification, but it's the work that lets
813
00:40:45,800 --> 00:40:50,400
notification stay simple when conditions become messy, which they always do around networks,
814
00:40:50,400 --> 00:40:52,040
gateways and real equipment.
815
00:40:52,040 --> 00:40:55,520
There's another reason to check current state rather than trust the arrival order.
816
00:40:55,520 --> 00:40:58,840
A device event describes a cloud-facing device connection.
817
00:40:58,840 --> 00:41:02,200
It does not automatically describe the health of the machine, the control network or the
818
00:41:02,200 --> 00:41:03,200
production operation.
819
00:41:03,200 --> 00:41:06,520
A gateway may reconnect while its PLC data connection has failed.
820
00:41:06,520 --> 00:41:09,760
A gateway may disconnect while the press continues to run locally.
821
00:41:09,760 --> 00:41:13,280
And a device-created event may arrive before your onboarding workflow finishes assigning
822
00:41:13,280 --> 00:41:15,680
the correct plant, owner and asset relationship.
823
00:41:15,680 --> 00:41:17,120
The event tells you where to begin.
824
00:41:17,120 --> 00:41:19,000
Your systems of record tell you what to do.
825
00:41:19,000 --> 00:41:23,160
For that reason, I design event grid subscribers around a current state check and a clear action
826
00:41:23,160 --> 00:41:24,160
boundary.
827
00:41:24,160 --> 00:41:25,480
It also receives a notification.
828
00:41:25,480 --> 00:41:28,240
It validates the device identity and event type.
829
00:41:28,240 --> 00:41:32,400
It checks the latest state from the right source, then it either records, escalates or closes
830
00:41:32,400 --> 00:41:33,640
the condition.
831
00:41:33,640 --> 00:41:36,080
That approach also keeps your event contracts honest.
832
00:41:36,080 --> 00:41:40,040
The notification can say, "A connection state change was reported for this device at this
833
00:41:40,040 --> 00:41:41,040
time."
834
00:41:41,040 --> 00:41:44,680
It should not claim this production line has stopped, unless another component has checked
835
00:41:44,680 --> 00:41:47,760
the machine and MES context required to make that statement.
836
00:41:47,760 --> 00:41:50,560
Event grid works very well for this kind of reactive flow.
837
00:41:50,560 --> 00:41:53,760
It can tell separate systems that something worth checking occurred.
838
00:41:53,760 --> 00:41:57,200
And those systems can act without consuming the entire machine stream.
839
00:41:57,200 --> 00:42:00,640
Just don't ask it to rebuild operational history from arrival order.
840
00:42:00,640 --> 00:42:02,320
Use it to start the next check.
841
00:42:02,320 --> 00:42:05,680
Connection events bring one more manufacturing specific limitation that teams often miss
842
00:42:05,680 --> 00:42:08,760
until they try to use them as a source for uptime.
843
00:42:08,760 --> 00:42:10,920
The 62nd Connection State Trap.
844
00:42:10,920 --> 00:42:14,040
A connection event can help you spot a cloud communication issue.
845
00:42:14,040 --> 00:42:16,840
It cannot give you a precise uptime record for a machine.
846
00:42:16,840 --> 00:42:21,600
IoT Hub attempts to report device connection state changes, but it reports changes no
847
00:42:21,600 --> 00:42:23,640
more often than every 60 seconds.
848
00:42:23,640 --> 00:42:28,160
That means a gateway can disconnect, reconnect and disconnect again within that window, while
849
00:42:28,160 --> 00:42:30,960
the event stream doesn't show every change in between.
850
00:42:30,960 --> 00:42:34,640
You may see several connected events without a matching, disconnected event.
851
00:42:34,640 --> 00:42:37,520
That can look strange until you understand the reporting interval.
852
00:42:37,520 --> 00:42:40,960
The cloud received state notifications at the times it could report them.
853
00:42:40,960 --> 00:42:44,000
It didn't record every movement in the network path.
854
00:42:44,000 --> 00:42:46,760
For a factory team, that distinction matters a lot.
855
00:42:46,760 --> 00:42:51,680
Imagine an industrial gateway on a press line, loses its Wi-Fi, or wired uplink for 20 seconds
856
00:42:51,680 --> 00:42:52,920
during a shift change.
857
00:42:52,920 --> 00:42:54,720
The gateway reconnects quickly.
858
00:42:54,720 --> 00:42:57,080
It may buffer its telemetry locally and send it later.
859
00:42:57,080 --> 00:42:58,760
The press may never stop.
860
00:42:58,760 --> 00:43:00,120
Operators may never notice anything.
861
00:43:00,120 --> 00:43:04,080
Yet, a cloud support system that treats connection events as machine uptime could record
862
00:43:04,080 --> 00:43:06,200
a production disruption that didn't happen.
863
00:43:06,200 --> 00:43:07,600
Now reverse the scenario.
864
00:43:07,600 --> 00:43:12,120
The gateway remains connected to IoT Hub, but the OPC-UA connection between the gateway
865
00:43:12,120 --> 00:43:13,520
and the PLC fails.
866
00:43:13,520 --> 00:43:15,240
The cloud sees a connected device.
867
00:43:15,240 --> 00:43:18,640
The machine may still run, or it may stop, but either way the gateway can't collect the
868
00:43:18,640 --> 00:43:20,040
signals you expected.
869
00:43:20,040 --> 00:43:21,520
The cloud connection looks healthy.
870
00:43:21,520 --> 00:43:25,440
The data collection isn't, that is why device connection state, data collection health,
871
00:43:25,440 --> 00:43:28,040
and machine production state need separate definitions.
872
00:43:28,040 --> 00:43:30,280
They're related, but they answer different questions.
873
00:43:30,280 --> 00:43:34,880
Device connection state asks whether the IoT client maintained its connection to IoT Hub.
874
00:43:34,880 --> 00:43:39,360
Data collection health asks whether the gateway can still read the PLC sensors or edge applications
875
00:43:39,360 --> 00:43:41,320
that supply its messages.
876
00:43:41,320 --> 00:43:46,320
Production state asks whether the asset is producing, stopped, inset up, starved for material,
877
00:43:46,320 --> 00:43:49,360
blocked downstream, or running a planned maintenance task.
878
00:43:49,360 --> 00:43:52,240
A single connected flag cannot answer all three.
879
00:43:52,240 --> 00:43:55,960
If it could, factories would be much easier places to model, and Excel would finally be out
880
00:43:55,960 --> 00:43:56,960
of a job.
881
00:43:56,960 --> 00:43:58,240
That hasn't happened.
882
00:43:58,240 --> 00:44:00,120
Protocol choice also affects these events.
883
00:44:00,120 --> 00:44:04,680
IoT Hub connection and disconnection notifications apply to devices connecting through MQTT
884
00:44:04,680 --> 00:44:08,440
or AMQP, including those protocols over web sockets.
885
00:44:08,440 --> 00:44:13,040
Devices that only communicate through HTTPS don't trigger those connection state notifications.
886
00:44:13,040 --> 00:44:14,520
That doesn't make HTTPS wrong.
887
00:44:14,520 --> 00:44:18,840
It just means you shouldn't design a monitoring process that expects connection events
888
00:44:18,840 --> 00:44:21,760
from a device that communicates only through HTTPS.
889
00:44:21,760 --> 00:44:24,720
The delivery behavior follows the protocol and connection model.
890
00:44:24,720 --> 00:44:28,840
Before you build a workflow around disconnect events, ask a few direct questions.
891
00:44:28,840 --> 00:44:32,040
Which devices use persistent MQTT or AMQP connections?
892
00:44:32,040 --> 00:44:34,240
Which devices batch messages through HTTPS?
893
00:44:34,240 --> 00:44:36,840
Does the gateway buffer when the plant network fails?
894
00:44:36,840 --> 00:44:40,280
Does it publish a health signal that confirms it can still read the PLC?
895
00:44:40,280 --> 00:44:43,240
And which system owns the machine state that production uses?
896
00:44:43,240 --> 00:44:46,680
Those answers shape the design more than the name of the Azure service.
897
00:44:46,680 --> 00:44:51,280
A better industrial pattern uses connection events as one input into a technical health check.
898
00:44:51,280 --> 00:44:54,600
A disconnect notice may tell the support process to inspect the gateway,
899
00:44:54,600 --> 00:44:57,640
its last telemetry time and the status of nearby devices.
900
00:44:57,640 --> 00:44:59,520
If a whole group disappears together,
901
00:44:59,520 --> 00:45:02,320
the likely cause may sit in a network segment or switch.
902
00:45:02,320 --> 00:45:06,920
If one gateway drops, while others remain online, the team can narrow the investigation.
903
00:45:06,920 --> 00:45:09,040
But don't label the machine as "down yet".
904
00:45:09,040 --> 00:45:13,120
For production availability, use machine state from the control layer or M.S.
905
00:45:13,120 --> 00:45:16,320
with the reason codes and operational rules your plant already uses.
906
00:45:16,320 --> 00:45:21,120
For OT network health, use the monitoring tools and signals that can see the relevant network path.
907
00:45:21,120 --> 00:45:24,800
For cloud connectivity, use IoT hub events and message arrival patterns.
908
00:45:24,800 --> 00:45:27,440
Each source provides a different part of the operational picture.
909
00:45:27,440 --> 00:45:31,760
That separation also helps when an event arrives after the device has already returned.
910
00:45:31,760 --> 00:45:33,280
The workflow doesn't need to panic.
911
00:45:33,280 --> 00:45:36,280
It can check current cloud state, inspect recent telemetry,
912
00:45:36,280 --> 00:45:38,640
and record whether the incident still needs a person.
913
00:45:38,640 --> 00:45:42,960
A short cloud gap may matter for data completeness even when it has no effect on output.
914
00:45:42,960 --> 00:45:46,680
A connected gateway proves one narrow fact, the gateway can talk to IoT hub.
915
00:45:46,680 --> 00:45:49,760
It doesn't prove the machine is healthy, the PLC link works,
916
00:45:49,760 --> 00:45:51,920
or the line produced good parts.
917
00:45:51,920 --> 00:45:54,680
Device lifecycle events and provisioning workflows.
918
00:45:54,680 --> 00:45:59,280
A device lifecycle event often starts before the gateway sends a single useful machine signal.
919
00:45:59,280 --> 00:46:02,000
Picture a new gateway being prepared for a packaging cell.
920
00:46:02,000 --> 00:46:06,240
Someone registers it in IoT hub, perhaps as part of an automated provisioning process
921
00:46:06,240 --> 00:46:07,920
or a controlled engineering handover.
922
00:46:07,920 --> 00:46:11,400
That registration can publish a device created event into event grid
923
00:46:11,400 --> 00:46:15,640
and the event can start the administrative work that turns a technical device identity
924
00:46:15,640 --> 00:46:18,280
into something the plant can support.
925
00:46:18,280 --> 00:46:19,880
That work needs ownership.
926
00:46:19,880 --> 00:46:24,440
An Azure function might check whether the device ID follows the naming rule for that site in line.
927
00:46:24,440 --> 00:46:28,840
It can create a pending asset record, attach the device to an approved support group,
928
00:46:28,840 --> 00:46:33,080
and flag the record if the expected machine link doesn't exist yet.
929
00:46:33,080 --> 00:46:37,880
A logic app might then create a task for the local OT engineer to confirm the installation
930
00:46:37,880 --> 00:46:40,040
and for the security team to check the access process.
931
00:46:40,040 --> 00:46:41,640
None of that needs a telemetry stream.
932
00:46:41,640 --> 00:46:43,320
It needs a prompt, traceable workflow.
933
00:46:43,320 --> 00:46:47,640
The same event can reach more than one subscriber, but each subscriber should own a narrow step.
934
00:46:47,640 --> 00:46:50,200
The asset process manages the equipment relationship,
935
00:46:50,200 --> 00:46:52,040
the identity process manages access.
936
00:46:52,040 --> 00:46:55,720
The service process confirms that someone owns the device after it reaches the plant.
937
00:46:55,720 --> 00:46:58,840
If one workflow fails, it shouldn't leave the whole onboarding process
938
00:46:58,840 --> 00:47:00,760
as a mystery spread across email threads.
939
00:47:00,760 --> 00:47:02,280
That is where event grid fits well.
940
00:47:02,280 --> 00:47:04,920
It distributes the notice that a device record changed.
941
00:47:04,920 --> 00:47:07,640
Your downstream services then check the details they need
942
00:47:07,640 --> 00:47:10,600
and update their own records through defined interfaces.
943
00:47:10,600 --> 00:47:13,240
The event doesn't need to contain the whole asset structure.
944
00:47:13,240 --> 00:47:17,320
It only needs enough information to identify the device and start the right process.
945
00:47:17,320 --> 00:47:19,880
A deletion event deserves the same care.
946
00:47:19,880 --> 00:47:23,480
When somebody deletes a device from IoT Hub, that may be planned.
947
00:47:23,480 --> 00:47:26,360
A gateway may have reached end of life, move to another plant
948
00:47:26,360 --> 00:47:28,280
or been replaced during a line upgrade.
949
00:47:28,280 --> 00:47:30,760
It may also be an unexpected change that needs review.
950
00:47:30,760 --> 00:47:33,320
A device deleted event can start access cleanup,
951
00:47:33,320 --> 00:47:34,920
remove stale monitoring links,
952
00:47:34,920 --> 00:47:38,120
and ask the asset owner to confirm whether the physical equipment changed
953
00:47:38,120 --> 00:47:39,800
or only its cloud registration.
954
00:47:39,800 --> 00:47:42,200
Don't let deletion quietly become housekeeping.
955
00:47:42,200 --> 00:47:46,120
If the cloud identity disappears while the gateway still sits beside a running machine,
956
00:47:46,120 --> 00:47:49,640
the plant may lose data without anyone noticing until a report turns blank.
957
00:47:49,640 --> 00:47:54,040
A deletion workflow can check whether the asset still appears active in the maintenance system,
958
00:47:54,040 --> 00:47:56,040
whether its last message arrived recently
959
00:47:56,040 --> 00:47:58,760
and whether a replacement device registration follows
960
00:47:58,760 --> 00:48:00,680
within the expected change process.
961
00:48:00,680 --> 00:48:02,280
The action should match the risk.
962
00:48:02,280 --> 00:48:05,640
That doesn't mean every life cycle event needs a human approval.
963
00:48:05,640 --> 00:48:07,400
Many checks can run automatically.
964
00:48:07,400 --> 00:48:10,600
A function can validate that a new device belongs to an allowed site.
965
00:48:10,600 --> 00:48:12,040
It can create a pending record.
966
00:48:12,040 --> 00:48:14,760
It can add standard tags or send a configuration request
967
00:48:14,760 --> 00:48:16,600
through the control device management path.
968
00:48:16,600 --> 00:48:18,840
Human review enters where the workflow changes equipment,
969
00:48:18,840 --> 00:48:20,920
ownership, network access, production use,
970
00:48:20,920 --> 00:48:23,160
or a record that people rely on during an incident.
971
00:48:23,160 --> 00:48:26,280
There's one small but important warning around device created events.
972
00:48:26,280 --> 00:48:28,040
The event can include twin data,
973
00:48:28,040 --> 00:48:30,360
but Microsoft documents that this twin data starts
974
00:48:30,360 --> 00:48:33,880
as default configuration and shouldn't be treated as proof of the device's actual
975
00:48:33,880 --> 00:48:37,720
authentication details or other newly created device properties.
976
00:48:37,720 --> 00:48:40,360
That means your onboarding workflow should verify the device
977
00:48:40,360 --> 00:48:43,160
through the proper device registry or management interface
978
00:48:43,160 --> 00:48:44,840
before it trusts those details.
979
00:48:44,840 --> 00:48:47,560
It may feel fuzzy, but it avoids a common failure.
980
00:48:47,560 --> 00:48:50,920
A workflow reads a creation event, assumes the included twin
981
00:48:50,920 --> 00:48:52,760
represents the final device state,
982
00:48:52,760 --> 00:48:56,280
then assigns controls or access based on incomplete information.
983
00:48:56,280 --> 00:48:59,800
A few minutes later, the device setup changes and the records no longer match.
984
00:48:59,800 --> 00:49:02,120
Now the team has two versions of device truth,
985
00:49:02,120 --> 00:49:05,400
which is exactly the sort of problem that turns a simple gateway rollout
986
00:49:05,400 --> 00:49:06,840
into a week of calls.
987
00:49:06,840 --> 00:49:10,200
Treat the lifecycle event as a reliable notice that something changed.
988
00:49:10,200 --> 00:49:12,760
Then query the authoritative source for the current state
989
00:49:12,760 --> 00:49:14,200
needed by the next step.
990
00:49:14,200 --> 00:49:17,960
This is why Spass action-driven workflows belong naturally in event grid.
991
00:49:17,960 --> 00:49:20,920
A device gets created, deleted, connected, or disconnected.
992
00:49:20,920 --> 00:49:25,080
A focused process receives that notice and performs a defined follow-up.
993
00:49:25,080 --> 00:49:29,320
It doesn't need to read thousands of measurements just to learn that a record needs attention.
994
00:49:29,320 --> 00:49:32,680
The details of that follow-up still depend on how you filter the message flow
995
00:49:32,680 --> 00:49:35,720
because filtering decides where the first piece of logic lives.
996
00:49:35,720 --> 00:49:38,680
Filtering. Select the right messages before they spread.
997
00:49:38,680 --> 00:49:42,040
Filtering decides where you want the first decision about a message to happen.
998
00:49:42,040 --> 00:49:45,720
That sounds like a small conflict choice, but it shapes how much traffic reaches each system,
999
00:49:45,720 --> 00:49:51,000
how much code each team writes, and how easily you can explain why a message reached a given destination.
1000
00:49:51,000 --> 00:49:54,680
For IoT Hub message routing, the question usually starts with the stream itself,
1001
00:49:54,680 --> 00:49:56,600
which device messages belong in this path.
1002
00:49:56,600 --> 00:50:00,200
A route can filter using application properties that the Gateway ads,
1003
00:50:00,200 --> 00:50:03,640
system properties supplied by IoT Hub, fields in the message body,
1004
00:50:03,640 --> 00:50:06,120
and device twin tags or twin properties.
1005
00:50:06,120 --> 00:50:08,840
That gives you several ways to separate industrial traffic
1006
00:50:08,840 --> 00:50:10,840
before it reaches the downstream endpoint.
1007
00:50:10,840 --> 00:50:14,120
Say a gateway reads signals from several machines online too.
1008
00:50:14,120 --> 00:50:16,760
It may send production state, energy use, diagnostics,
1009
00:50:16,760 --> 00:50:19,800
and condition monitoring signals through the same device connection.
1010
00:50:19,800 --> 00:50:24,360
You don't want to rely on the receiving system to guess which message belongs to which process.
1011
00:50:24,360 --> 00:50:26,920
Put the useful classification close to the source.
1012
00:50:26,920 --> 00:50:30,680
The gateway might add a message property that identifies the signal class as energy,
1013
00:50:30,680 --> 00:50:32,040
production, or diagnostic.
1014
00:50:32,040 --> 00:50:35,160
It might include an asset ID and a source timestamp in the payload.
1015
00:50:35,160 --> 00:50:39,080
The device twin may hold a managed tag that identifies the gateway's plant,
1016
00:50:39,080 --> 00:50:40,600
line, or support domain.
1017
00:50:40,600 --> 00:50:45,480
IoT Hub routing can then use those fields to send only line two energy messages to an energy stream,
1018
00:50:45,480 --> 00:50:49,240
while production state messages follow the path built for production analysis.
1019
00:50:49,240 --> 00:50:51,640
That keeps the first split clear and visible.
1020
00:50:51,640 --> 00:50:55,080
Body queries can help too, provided your message format stays stable.
1021
00:50:55,080 --> 00:50:59,400
For example, you may route messages only when a state field indicates a defined operating condition,
1022
00:50:59,400 --> 00:51:02,520
or only when a payload identifies a particular signal group.
1023
00:51:02,520 --> 00:51:05,960
But I'd be careful about putting all business logic into a routing query.
1024
00:51:05,960 --> 00:51:08,120
Routing should make broad traffic decisions.
1025
00:51:08,120 --> 00:51:12,760
It should not become a hidden rule engine that nobody on the plant side can explain or maintain.
1026
00:51:12,760 --> 00:51:15,880
Twin tags help when the classification belongs to the managed device,
1027
00:51:15,880 --> 00:51:17,400
rather than each message.
1028
00:51:17,400 --> 00:51:19,720
If a gateway always belongs to a given site,
1029
00:51:19,720 --> 00:51:22,520
a twin tag can avoid repeating that fact in every payload.
1030
00:51:22,520 --> 00:51:26,600
But if a gateway observes multiple machines or can move between production areas,
1031
00:51:26,600 --> 00:51:28,280
you need governance around those tags.
1032
00:51:28,280 --> 00:51:31,400
A tag that says line two, while the gateway now sits on line four,
1033
00:51:31,400 --> 00:51:33,400
creates a clean route carrying the wrong data.
1034
00:51:33,400 --> 00:51:35,080
Cleanly wrong still counts as wrong.
1035
00:51:35,080 --> 00:51:37,640
Event grid filtering answers a different question.
1036
00:51:37,640 --> 00:51:39,800
Instead of choosing a data path for a stream,
1037
00:51:39,800 --> 00:51:42,600
it chooses which subscribers should receive a notification.
1038
00:51:42,600 --> 00:51:45,000
An event grid subscription can filter by event type,
1039
00:51:45,000 --> 00:51:47,640
by subject, and by fields in the event data.
1040
00:51:47,640 --> 00:51:50,920
For IoT Hub events, the subject identifies the device path.
1041
00:51:50,920 --> 00:51:53,800
That lets a subscriber focus on a defined device set,
1042
00:51:53,800 --> 00:51:56,920
such as gateways from one side, one line, or one naming group.
1043
00:51:56,920 --> 00:52:00,760
A device support workflow might subscribe only to disconnected events
1044
00:52:00,760 --> 00:52:02,520
from a group of production gateways.
1045
00:52:02,520 --> 00:52:05,880
An onboarding service might subscribe only to device created events.
1046
00:52:05,880 --> 00:52:10,680
A telemetry triggered workflow might filter for messages whose data matches a narrow condition
1047
00:52:10,680 --> 00:52:12,520
that its owner has agreed to handle.
1048
00:52:12,520 --> 00:52:13,480
The difference matters.
1049
00:52:14,200 --> 00:52:19,160
IoT Hub root filtering decides which operational messages should enter this data path.
1050
00:52:19,160 --> 00:52:24,280
Event grid subscription filtering decides which notices should this handler receive.
1051
00:52:24,280 --> 00:52:26,280
Both reduce noise, they do different jobs.
1052
00:52:26,280 --> 00:52:30,280
If you use event grid filters as the main way to segment continuous machine data,
1053
00:52:30,280 --> 00:52:33,800
each subscriber can end up with its own version of what counts as relevant.
1054
00:52:33,800 --> 00:52:37,640
One handler filters by device prefix, another filters by a payload field.
1055
00:52:37,640 --> 00:52:40,840
A third ignores a message property and recreates the logic in code.
1056
00:52:40,840 --> 00:52:45,720
Over time, the architecture spreads basic data selection across too many places.
1057
00:52:45,720 --> 00:52:47,720
That makes changes harder than they need to be.
1058
00:52:47,720 --> 00:52:51,480
A shared telemetry root should carry an explicit, governed class of data.
1059
00:52:51,480 --> 00:52:55,400
Event subscribers should receive a focused signal that starts a specific reaction.
1060
00:52:55,400 --> 00:53:00,200
That boundary lets the data team own stream rules while the workflow team owns response rules,
1061
00:53:00,200 --> 00:53:03,160
without either group quietly rewriting the other groups logic.
1062
00:53:03,160 --> 00:53:06,040
Filtering also needs a versioning plan.
1063
00:53:06,040 --> 00:53:07,000
Payloads change.
1064
00:53:07,000 --> 00:53:08,360
New signal types appear.
1065
00:53:08,360 --> 00:53:11,960
A gateway firmware update may rename a field, add a nested structure,
1066
00:53:11,960 --> 00:53:14,120
or change how it reports a state.
1067
00:53:14,120 --> 00:53:16,840
If roots and subscriptions depend on those fields,
1068
00:53:16,840 --> 00:53:20,280
test the change against the whole path before it reaches production.
1069
00:53:20,280 --> 00:53:24,040
Otherwise, a message can still reach IoT Hub successfully while disappearing
1070
00:53:24,040 --> 00:53:26,120
from the root or subscription that matters.
1071
00:53:26,120 --> 00:53:27,960
From the device side, everything looks fine.
1072
00:53:27,960 --> 00:53:30,040
From the business side, the data is vanished.
1073
00:53:30,040 --> 00:53:32,360
And filtering cannot repair missing meaning.
1074
00:53:32,360 --> 00:53:35,960
It can separate line 2 energy telemetry from press diagnostics.
1075
00:53:35,960 --> 00:53:39,160
It cannot tell you whether a high energy reading came during normal production,
1076
00:53:39,160 --> 00:53:42,440
a setup run, a maintenance task, or an abnormal condition.
1077
00:53:42,440 --> 00:53:44,840
That context has to come from somewhere else.
1078
00:53:44,840 --> 00:53:47,960
Context comes from ERP, MES, and the asset model.
1079
00:53:47,960 --> 00:53:50,440
A device ID tells you where a message came from.
1080
00:53:50,440 --> 00:53:52,840
It doesn't tell you what the message means to production.
1081
00:53:52,840 --> 00:53:55,960
That gap appears the moment somebody asks a practical question.
1082
00:53:55,960 --> 00:53:58,440
A gateway reports that a press has stopped sending data.
1083
00:53:58,440 --> 00:53:59,640
Is that press and production?
1084
00:53:59,640 --> 00:54:00,440
Is it being set up?
1085
00:54:00,440 --> 00:54:01,880
Is it underplanned maintenance?
1086
00:54:01,880 --> 00:54:04,040
Does it run an order that another machine can take over?
1087
00:54:04,040 --> 00:54:06,360
Or is it the only resource qualified for that operation?
1088
00:54:06,360 --> 00:54:08,360
You won't find those answers in a device ID.
1089
00:54:08,360 --> 00:54:10,840
The MES, your manufacturing execution system,
1090
00:54:10,840 --> 00:54:13,000
supplies much of the shop floor context.
1091
00:54:13,000 --> 00:54:15,480
It can connect an asset signal to an active operation,
1092
00:54:15,480 --> 00:54:17,400
a work order, a recipe or routing step,
1093
00:54:17,400 --> 00:54:19,000
a shift, and the production status recorded
1094
00:54:19,000 --> 00:54:20,920
by the people and systems running the line.
1095
00:54:20,920 --> 00:54:24,520
That link turns a raw state such as stopped into something more useful.
1096
00:54:24,520 --> 00:54:27,160
For example, the same machine state may mean very different things
1097
00:54:27,160 --> 00:54:28,600
depending on the mass record.
1098
00:54:28,600 --> 00:54:31,640
A stopped press during a planned die-changes expected.
1099
00:54:31,640 --> 00:54:35,160
A stopped press during a high-priority production order might need attention.
1100
00:54:35,160 --> 00:54:38,600
A stopped press after the order completed may not affect output at all.
1101
00:54:38,600 --> 00:54:39,960
The sensor value didn't change.
1102
00:54:39,960 --> 00:54:41,160
The context changed.
1103
00:54:41,160 --> 00:54:44,440
ERP brings another layer.
1104
00:54:44,440 --> 00:54:46,920
It usually knows the demand side of the story.
1105
00:54:46,920 --> 00:54:49,720
Customer commitments, material availability,
1106
00:54:49,720 --> 00:54:52,840
order dates, inventory positions, and the wider plan.
1107
00:54:52,840 --> 00:54:56,520
If a production issue lasts long enough to threaten output,
1108
00:54:56,520 --> 00:54:59,960
ERP context helps the business understand where the pressure lands,
1109
00:54:59,960 --> 00:55:02,760
but ERP shouldn't pretend to know the current machine condition
1110
00:55:02,760 --> 00:55:04,760
just because it contains a production order.
1111
00:55:04,760 --> 00:55:06,200
Its plan describes intent.
1112
00:55:06,200 --> 00:55:08,680
The MES and the machine layer describe execution.
1113
00:55:08,680 --> 00:55:11,720
Those systems need to connect, but they shouldn't override each other's role.
1114
00:55:11,720 --> 00:55:13,960
Think about a planner looking at a late order.
1115
00:55:13,960 --> 00:55:17,240
ERP may show a promised delivery date and the order quantity.
1116
00:55:17,240 --> 00:55:21,240
MES may show that the operation started, paused, or completed only in part.
1117
00:55:21,240 --> 00:55:23,640
Telemetry may show rising vibration before a stop.
1118
00:55:23,640 --> 00:55:27,320
The asset model may show which other machines can perform the same process.
1119
00:55:27,320 --> 00:55:29,960
Only together do those facts support a sound decision.
1120
00:55:29,960 --> 00:55:33,000
The asset model provides the physical structure that links technical devices
1121
00:55:33,000 --> 00:55:34,280
to equipment people recognize.
1122
00:55:34,280 --> 00:55:35,960
A gateway belongs to a network zone.
1123
00:55:35,960 --> 00:55:37,880
It reads one or more PLCs.
1124
00:55:37,880 --> 00:55:39,560
Those PLCs relate to machines.
1125
00:55:39,560 --> 00:55:42,280
Machines sit in cells, lines, departments, and sites.
1126
00:55:42,280 --> 00:55:46,280
Without that model, every downstream system ends up rebuilding its own mapping table.
1127
00:55:46,280 --> 00:55:48,440
One team calls the asset press 12.
1128
00:55:48,440 --> 00:55:50,680
Another knows the gateway is GW North-07.
1129
00:55:50,680 --> 00:55:52,440
The MES uses a resource code.
1130
00:55:52,440 --> 00:55:55,080
The maintenance system uses a different equipment number.
1131
00:55:55,080 --> 00:55:58,040
Then a simple question such as, "Which line lost data?"
1132
00:55:58,040 --> 00:56:00,440
becomes a joint problem with human consequences.
1133
00:56:00,440 --> 00:56:02,840
That's not unusual. It's just expensive confusion.
1134
00:56:02,840 --> 00:56:06,200
In practical terms, the asset model should give you stable relationships.
1135
00:56:06,200 --> 00:56:07,800
This device reports for this gateway.
1136
00:56:07,800 --> 00:56:09,400
This gateway collects from this machine.
1137
00:56:09,400 --> 00:56:11,000
This machine belongs to this line.
1138
00:56:11,000 --> 00:56:13,160
This line can produce these product families
1139
00:56:13,160 --> 00:56:15,240
under these approved process rules.
1140
00:56:15,240 --> 00:56:17,640
You don't need to put every relationship into IoT Hub.
1141
00:56:17,640 --> 00:56:21,960
You do need one governed place where those relationships can be maintained and consumed.
1142
00:56:21,960 --> 00:56:26,760
For some manufacturers, a structured asset register plus MES master data is enough.
1143
00:56:26,760 --> 00:56:29,240
Others need a digital twin or a knowledge graph
1144
00:56:29,240 --> 00:56:31,880
because they need to reason across changing relationships.
1145
00:56:31,880 --> 00:56:34,920
Assets, sensors, processes, materials, workers,
1146
00:56:34,920 --> 00:56:37,480
quality checks, and production constraints.
1147
00:56:37,480 --> 00:56:40,840
A knowledge graph sounds like a big idea, but the plain version is simple.
1148
00:56:40,840 --> 00:56:42,280
It records how things relate.
1149
00:56:42,280 --> 00:56:45,000
Instead of storing a machine as one isolated record,
1150
00:56:45,000 --> 00:56:47,880
it can represent that the machine uses a certain tool,
1151
00:56:47,880 --> 00:56:51,320
runs a certain process, receives data from a certain gateway,
1152
00:56:51,320 --> 00:56:53,800
and supports a defined set of operations.
1153
00:56:53,800 --> 00:56:56,280
When something changes, systems can follow those links
1154
00:56:56,280 --> 00:56:57,960
rather than asking people to remember them.
1155
00:56:57,960 --> 00:57:01,160
That's useful when the question moves beyond technical support.
1156
00:57:01,160 --> 00:57:03,800
A device disconnected notice may point to a gateway.
1157
00:57:03,800 --> 00:57:06,120
The asset model can identify the machine in line.
1158
00:57:06,120 --> 00:57:09,000
MES can show the active work order and current operation.
1159
00:57:09,000 --> 00:57:12,280
ERP can show whether delayed output affects downstream demand.
1160
00:57:12,280 --> 00:57:14,520
The event still doesn't decide anything by itself,
1161
00:57:14,520 --> 00:57:17,000
but it reaches a system that can ask better questions.
1162
00:57:17,000 --> 00:57:17,960
And that's the point.
1163
00:57:17,960 --> 00:57:21,160
Integration isn't only about moving messages between Azure services
1164
00:57:21,160 --> 00:57:24,360
it's about connecting the dots between IT and OT
1165
00:57:24,360 --> 00:57:27,480
without turning every raw signal into a false business conclusion.
1166
00:57:27,480 --> 00:57:28,920
So let's return to the press line.
1167
00:57:28,920 --> 00:57:31,240
The gateway goes offline while a work order is active,
1168
00:57:31,240 --> 00:57:34,360
and now the architecture has to separate a loss of cloud visibility
1169
00:57:34,360 --> 00:57:35,960
from an actual production problem.
1170
00:57:35,960 --> 00:57:38,920
scenario, the gateway goes offline during a work order.
1171
00:57:38,920 --> 00:57:40,680
Let's make the failure concrete.
1172
00:57:40,680 --> 00:57:43,320
Press 12 is halfway through an active work order.
1173
00:57:43,320 --> 00:57:44,840
The operator has the press running,
1174
00:57:44,840 --> 00:57:46,920
the MES shows the operation is active,
1175
00:57:46,920 --> 00:57:49,880
and the gateway sends normal process data into IoT Hub.
1176
00:57:49,880 --> 00:57:52,600
Then the gateway loses its connection to the cloud.
1177
00:57:52,600 --> 00:57:55,800
An event grid subscription receives a device disconnected event
1178
00:57:55,800 --> 00:57:57,080
and starts a support workflow.
1179
00:57:57,080 --> 00:57:58,280
That's a sensible first move.
1180
00:57:58,280 --> 00:58:00,280
The workflow creates an investigation record,
1181
00:58:00,280 --> 00:58:02,520
adds the device ID, the event time,
1182
00:58:02,520 --> 00:58:04,600
and the support owner for that production area.
1183
00:58:04,600 --> 00:58:05,800
It should not stop the press,
1184
00:58:05,800 --> 00:58:07,800
the cloud lost contact with the gateway.
1185
00:58:07,800 --> 00:58:09,560
That is all the event proves.
1186
00:58:09,560 --> 00:58:12,200
The press may still run under local PLC control,
1187
00:58:12,200 --> 00:58:14,040
the operator may still produce parts,
1188
00:58:14,040 --> 00:58:15,640
or the gateway may have failed in a way
1189
00:58:15,640 --> 00:58:17,640
that also remove data collection from the line
1190
00:58:17,640 --> 00:58:19,400
while production continues normally.
1191
00:58:19,400 --> 00:58:21,160
Those are different situations.
1192
00:58:21,160 --> 00:58:23,000
The first check should focus on the gateway
1193
00:58:23,000 --> 00:58:24,360
and the telemetry path.
1194
00:58:24,360 --> 00:58:26,200
A function triggered by the event can inspect
1195
00:58:26,200 --> 00:58:29,240
when IoT Hub last received a valid message from that gateway.
1196
00:58:29,240 --> 00:58:31,320
It can compare the last source timestamp
1197
00:58:31,320 --> 00:58:32,680
with the cloud receipt time
1198
00:58:32,680 --> 00:58:35,320
and look for a sudden gap in production telemetry.
1199
00:58:35,320 --> 00:58:37,240
That gives the support team a better starting point.
1200
00:58:37,240 --> 00:58:39,720
If the last messages showed press 12 in a running state
1201
00:58:39,720 --> 00:58:41,240
and telemetry stops abruptly,
1202
00:58:41,240 --> 00:58:43,400
the plant has lost visibility after that point.
1203
00:58:43,400 --> 00:58:45,640
It has not yet proved that the press stopped.
1204
00:58:45,640 --> 00:58:48,360
If Bufford messages arrive when the gateway reconnects,
1205
00:58:48,360 --> 00:58:50,360
they may fill part of the timeline later,
1206
00:58:50,360 --> 00:58:52,760
and the incident becomes a data completeness issue
1207
00:58:52,760 --> 00:58:54,520
rather than a production interruption.
1208
00:58:54,520 --> 00:58:56,680
That distinction saves a lot of bad escalation.
1209
00:58:56,680 --> 00:58:57,640
Now bring in the MS.
1210
00:58:57,640 --> 00:59:00,040
The MES can confirm whether the operation remained active,
1211
00:59:00,040 --> 00:59:01,720
whether the operator recorded a stop,
1212
00:59:01,720 --> 00:59:03,080
whether parts continued to count,
1213
00:59:03,080 --> 00:59:04,680
and whether a reason code appeared.
1214
00:59:04,680 --> 00:59:06,680
In some plants, the MES receives production data
1215
00:59:06,680 --> 00:59:07,800
through another local path.
1216
00:59:07,800 --> 00:59:09,960
In others, the operator records the change.
1217
00:59:09,960 --> 00:59:13,400
Either way, the MES helps separate a cloud connection issue
1218
00:59:13,400 --> 00:59:15,720
from the execution state of the work order.
1219
00:59:15,720 --> 00:59:19,080
Suppose the MES still records cycles and the operator has no stop reason.
1220
00:59:19,080 --> 00:59:20,440
The press likely kept running.
1221
00:59:20,440 --> 00:59:22,600
The immediate task becomes checking the gateway,
1222
00:59:22,600 --> 00:59:24,120
the OT network path,
1223
00:59:24,120 --> 00:59:26,520
and whether missing telemetry will affect traceability
1224
00:59:26,520 --> 00:59:28,040
or condition analysis.
1225
00:59:28,040 --> 00:59:30,520
Suppose instead the MES shows the operation paused
1226
00:59:30,520 --> 00:59:32,840
and the operator records an equipment fault.
1227
00:59:32,840 --> 00:59:35,720
Now the event grid notification and the telemetry gap
1228
00:59:35,720 --> 00:59:37,560
point to what a real operational issue.
1229
00:59:37,560 --> 00:59:39,800
But the plant still needs more than a disconnect event
1230
00:59:39,800 --> 00:59:41,720
before changing the production plan.
1231
00:59:41,720 --> 00:59:42,600
They need duration.
1232
00:59:42,600 --> 00:59:45,000
They need to know whether the press has stopped for a few minutes,
1233
00:59:45,000 --> 00:59:46,680
whether maintenance can restore it,
1234
00:59:46,680 --> 00:59:49,480
and whether the operation can move to another approved resource.
1235
00:59:49,480 --> 00:59:52,200
The production impact comes after the operational facts,
1236
00:59:52,200 --> 00:59:54,360
not from the first cloud notification.
1237
00:59:54,360 --> 00:59:55,800
That order of reasoning matters.
1238
00:59:55,800 --> 00:59:58,360
A planner may see that the work order sits on press 12.
1239
00:59:58,360 --> 01:00:01,480
ERP can show demand dates and downstream commitments.
1240
01:00:01,480 --> 01:00:03,640
But neither system should assume that every gateway
1241
01:00:03,640 --> 01:00:05,400
disconnect threatens delivery.
1242
01:00:05,400 --> 01:00:06,920
If the press continues locally,
1243
01:00:06,920 --> 01:00:09,640
re-planning creates churn for no operational reason.
1244
01:00:09,640 --> 01:00:11,000
If the press truly stopped,
1245
01:00:11,000 --> 01:00:13,320
waiting for a dashboard refresh may waste time.
1246
01:00:13,320 --> 01:00:15,720
The architecture needs both speed and restraint.
1247
01:00:15,720 --> 01:00:17,480
Event grid provides the fast signal
1248
01:00:17,480 --> 01:00:19,000
that starts the investigation.
1249
01:00:19,000 --> 01:00:21,800
IoT Hub telemetry provides the last known machine facts
1250
01:00:21,800 --> 01:00:25,080
and potentially the backfilled record after reconnection.
1251
01:00:25,080 --> 01:00:27,240
MES confirms what production actually did.
1252
01:00:27,240 --> 01:00:30,280
The asset model identifies the affected machine and line.
1253
01:00:30,280 --> 01:00:32,280
Only then can a planner judge whether the work order
1254
01:00:32,280 --> 01:00:33,800
faces a real constraint.
1255
01:00:33,800 --> 01:00:35,240
Consider a more awkward case.
1256
01:00:35,240 --> 01:00:37,240
The gateway reconnects after 10 minutes
1257
01:00:37,240 --> 01:00:39,160
and event grid sends a connected notice.
1258
01:00:39,160 --> 01:00:41,480
That does not close the production question either.
1259
01:00:41,480 --> 01:00:44,280
The function can confirm that cloud connectivity returned,
1260
01:00:44,280 --> 01:00:46,600
but the team still needs to check whether the gateway
1261
01:00:46,600 --> 01:00:49,160
resumed PL-series, whether buffer data arrived
1262
01:00:49,160 --> 01:00:51,400
and whether the production operation continued.
1263
01:00:51,400 --> 01:00:53,960
A green connection status can end a network incident
1264
01:00:53,960 --> 01:00:55,720
while leaving a data incident open.
1265
01:00:55,720 --> 01:00:57,720
This is why I prefer an investigation workflow
1266
01:00:57,720 --> 01:00:59,080
with clear states.
1267
01:00:59,080 --> 01:01:01,800
First, cloud connection lost, then telemetry path checked,
1268
01:01:01,800 --> 01:01:03,640
then production state confirmed through MES
1269
01:01:03,640 --> 01:01:04,920
or local control data.
1270
01:01:04,920 --> 01:01:07,560
Finally, impact assessed if the machine actually stopped
1271
01:01:07,560 --> 01:01:10,520
or if data lost threatens a quality or traceability record.
1272
01:01:10,520 --> 01:01:12,520
Each state has an owner and a source of evidence
1273
01:01:12,520 --> 01:01:14,920
that may sound more deliberate than firing off an alert
1274
01:01:14,920 --> 01:01:16,520
and assuming someone sorts it out.
1275
01:01:16,520 --> 01:01:20,040
But a work order doesn't care that an Azure event arrived quickly.
1276
01:01:20,040 --> 01:01:22,840
It cares whether the press produced the required parts,
1277
01:01:22,840 --> 01:01:24,760
whether the process stayed within limits
1278
01:01:24,760 --> 01:01:27,480
and whether the plant can still meet the next commitment.
1279
01:01:27,480 --> 01:01:30,200
The same incident makes the architectural boundary clear.
1280
01:01:30,200 --> 01:01:33,640
Neither IoT have rooting nor event grid replaces the other
1281
01:01:33,640 --> 01:01:35,480
because one preserves the operational record
1282
01:01:35,480 --> 01:01:37,720
while the other starts the right response.
1283
01:01:37,720 --> 01:01:40,440
The wrong design, event grid as a telemetry bus.
1284
01:01:40,440 --> 01:01:42,840
A common mistake starts with a reasonable idea.
1285
01:01:42,840 --> 01:01:45,320
A machine sends data, something receives it,
1286
01:01:45,320 --> 01:01:46,760
and a function reacts.
1287
01:01:46,760 --> 01:01:49,480
That can sound like an event driven architecture.
1288
01:01:49,480 --> 01:01:51,240
But if every temperature reading,
1289
01:01:51,240 --> 01:01:52,920
cycle count, vibration sample,
1290
01:01:52,920 --> 01:01:54,680
and current value enters event grid,
1291
01:01:54,680 --> 01:01:57,880
you've turned a notification path into your main telemetry bus.
1292
01:01:57,880 --> 01:01:59,560
The architecture might work at first,
1293
01:01:59,560 --> 01:02:00,840
then normal production begins.
1294
01:02:00,840 --> 01:02:03,560
Picture a gateway sending frequent readings from a press line.
1295
01:02:03,560 --> 01:02:05,240
Every message reaches event grid.
1296
01:02:05,240 --> 01:02:06,680
Several subscriptions react.
1297
01:02:06,680 --> 01:02:08,040
One function checks temperature,
1298
01:02:08,040 --> 01:02:09,240
another writes a record.
1299
01:02:09,240 --> 01:02:11,400
A logic app sends something onward.
1300
01:02:11,400 --> 01:02:14,840
A third handler tries to detect whether the machine is running or stopped.
1301
01:02:14,840 --> 01:02:16,840
Soon, routine sensor traffic starts
1302
01:02:16,840 --> 01:02:19,480
thousands of tiny workflows that never needed to exist.
1303
01:02:19,480 --> 01:02:21,320
A temperature reading is not an incident.
1304
01:02:21,320 --> 01:02:23,000
Most measurements only become interesting
1305
01:02:23,000 --> 01:02:24,600
when you compare them across time,
1306
01:02:24,600 --> 01:02:26,600
against the limit, or with other signals.
1307
01:02:26,600 --> 01:02:29,880
A single vibration value rarely tells maintenance what to do.
1308
01:02:29,880 --> 01:02:31,800
The pattern over time may tell them something
1309
01:02:31,800 --> 01:02:34,120
that requires a stream-oriented process
1310
01:02:34,120 --> 01:02:35,560
that can read the sequence,
1311
01:02:35,560 --> 01:02:37,240
apply rules consistently,
1312
01:02:37,240 --> 01:02:39,400
and retain enough history to inspect later.
1313
01:02:39,400 --> 01:02:42,440
When event grid becomes the main route for that work,
1314
01:02:42,440 --> 01:02:45,880
every subscriber starts recreating stream processing in its own handler.
1315
01:02:45,880 --> 01:02:48,040
One team stores a partial history in a database,
1316
01:02:48,040 --> 01:02:49,480
another keeps a small cache.
1317
01:02:49,480 --> 01:02:52,440
A third assumes that the latest event represents current machine state.
1318
01:02:52,440 --> 01:02:53,240
Before long,
1319
01:02:53,240 --> 01:02:55,880
each process has its own version of the telemetry story.
1320
01:02:55,880 --> 01:02:57,160
That creates drift event grid
1321
01:02:57,160 --> 01:02:59,320
can deliver a telemetry event more than once,
1322
01:02:59,320 --> 01:03:00,920
and it doesn't promise delivery order.
1323
01:03:00,920 --> 01:03:03,640
A function that receives a reading can't safely assume it arrived
1324
01:03:03,640 --> 01:03:05,240
after the last reading had processed.
1325
01:03:05,240 --> 01:03:08,120
If it updates a current state record without checking timestamps
1326
01:03:08,120 --> 01:03:09,320
and message identity,
1327
01:03:09,320 --> 01:03:11,720
an older measurement can override a newer one.
1328
01:03:11,720 --> 01:03:13,000
For an isolated alert,
1329
01:03:13,000 --> 01:03:16,760
that may be acceptable if the handler checks current state before it acts.
1330
01:03:16,760 --> 01:03:19,160
For continuous telemetry, it quickly becomes awkward.
1331
01:03:19,160 --> 01:03:21,160
You're asking every event handler to solve
1332
01:03:21,160 --> 01:03:23,320
later-arrivals, duplicates, sequence gaps,
1333
01:03:23,320 --> 01:03:25,560
replay and state reconstruction independently.
1334
01:03:25,560 --> 01:03:27,320
That's a lot of accidental engineering.
1335
01:03:27,320 --> 01:03:28,840
There's also an operational problem.
1336
01:03:28,840 --> 01:03:30,600
A team later asks a normal question,
1337
01:03:30,600 --> 01:03:34,040
what did the press do during the hour before a quality deviation?
1338
01:03:34,040 --> 01:03:37,320
If the design only pushed messages through functions and workflows,
1339
01:03:37,320 --> 01:03:38,760
where is the complete record?
1340
01:03:38,760 --> 01:03:40,360
Which handler stored every message?
1341
01:03:40,360 --> 01:03:42,920
Did it store source time, cloud receipt time message properties
1342
01:03:42,920 --> 01:03:44,040
and the original payload?
1343
01:03:44,040 --> 01:03:46,440
Can someone replay the data with a revised rule?
1344
01:03:46,440 --> 01:03:48,360
Often nobody can answer with confidence.
1345
01:03:48,360 --> 01:03:50,040
The system reacted in the moment,
1346
01:03:50,040 --> 01:03:51,480
but it didn't preserve evidence.
1347
01:03:51,480 --> 01:03:53,880
This is where the word event creates confusion.
1348
01:03:53,880 --> 01:03:56,680
In software, a telemetry message can technically count as an event
1349
01:03:56,680 --> 01:03:58,520
because it reports something that happened.
1350
01:03:58,520 --> 01:04:01,160
But architecture needs more precision than vocabulary.
1351
01:04:01,160 --> 01:04:03,480
A repeated measurement belongs to a flow where consumers
1352
01:04:03,480 --> 01:04:05,240
can process it over time.
1353
01:04:05,240 --> 01:04:08,520
A discrete change that starts a task belongs to a notification path.
1354
01:04:08,520 --> 01:04:10,040
Those are different delivery needs,
1355
01:04:10,040 --> 01:04:12,840
sending all telemetry through Event Grid also spreads ownership
1356
01:04:12,840 --> 01:04:14,040
in an unhelpful way.
1357
01:04:14,040 --> 01:04:15,960
The maintenance team builds one subscription.
1358
01:04:15,960 --> 01:04:17,640
The quality team builds another.
1359
01:04:17,640 --> 01:04:19,320
The energy team creates a third.
1360
01:04:19,320 --> 01:04:21,240
Each one filters slightly differently,
1361
01:04:21,240 --> 01:04:22,680
handles errors differently,
1362
01:04:22,680 --> 01:04:24,520
and retains different fields.
1363
01:04:24,520 --> 01:04:26,520
Nobody owns the shared operational record.
1364
01:04:26,520 --> 01:04:28,200
Then a gateway payload changes,
1365
01:04:28,200 --> 01:04:29,480
maybe a field changes name,
1366
01:04:29,480 --> 01:04:32,040
a unit changes, or a source time stamp moves.
1367
01:04:32,040 --> 01:04:34,120
Several workflows fail in different ways.
1368
01:04:34,120 --> 01:04:36,600
Some keep running, but read the wrong field.
1369
01:04:36,600 --> 01:04:39,080
Others quietly stop receiving the events they expected.
1370
01:04:39,080 --> 01:04:40,440
The factory still produces.
1371
01:04:40,440 --> 01:04:42,280
The cloud pipeline slowly loses its grip
1372
01:04:42,280 --> 01:04:43,640
on what production is doing.
1373
01:04:43,640 --> 01:04:45,240
That's not a criticism of Event Grid.
1374
01:04:45,240 --> 01:04:47,480
It's the case of using the right service for the wrong job.
1375
01:04:47,480 --> 01:04:49,480
Event Grid works well when a defined event
1376
01:04:49,480 --> 01:04:51,640
should prompt independent systems to act.
1377
01:04:51,640 --> 01:04:55,000
A condition monitoring process can inspect a telemetry stream,
1378
01:04:55,000 --> 01:04:56,920
detect a condition that meets a rule,
1379
01:04:56,920 --> 01:04:58,920
and publish a clear event such as
1380
01:04:58,920 --> 01:05:01,160
this asset needs maintenance review.
1381
01:05:01,160 --> 01:05:02,920
Event Grid can then distribute that notice
1382
01:05:02,920 --> 01:05:05,000
to the work order process, the support workflow,
1383
01:05:05,000 --> 01:05:07,000
and any other approved subscriber.
1384
01:05:07,000 --> 01:05:08,920
That event carries a decision point.
1385
01:05:08,920 --> 01:05:11,640
The raw vibration samples that led to the decision
1386
01:05:11,640 --> 01:05:13,560
should remain in the telemetry path
1387
01:05:13,560 --> 01:05:15,160
where they can support later review.
1388
01:05:15,160 --> 01:05:17,080
The event tells people and systems to respond.
1389
01:05:17,080 --> 01:05:18,600
The telemetry explains why.
1390
01:05:18,600 --> 01:05:19,800
Keep those roles separate,
1391
01:05:19,800 --> 01:05:21,880
and the design stays easier to test,
1392
01:05:21,880 --> 01:05:23,560
operate, and explain.
1393
01:05:23,560 --> 01:05:25,960
Push every reading through a notification fabric
1394
01:05:25,960 --> 01:05:27,560
and your functions become a collection
1395
01:05:27,560 --> 01:05:29,320
of improvised stream processes,
1396
01:05:29,320 --> 01:05:30,760
wearing different names.
1397
01:05:30,760 --> 01:05:33,000
The reverse mistake causes trouble too,
1398
01:05:33,000 --> 01:05:34,760
treating every simple notification
1399
01:05:34,760 --> 01:05:37,640
as if it belongs in a heavy telemetry pipeline.
1400
01:05:37,640 --> 01:05:39,240
The other wrong design.
1401
01:05:39,240 --> 01:05:41,720
IoT Hub rooting for every notification.
1402
01:05:41,720 --> 01:05:44,200
The opposite mistake looks more disciplined at first.
1403
01:05:44,200 --> 01:05:47,320
A team decides every message should go through IoT Hub rooting
1404
01:05:47,320 --> 01:05:49,000
because all device-related information
1405
01:05:49,000 --> 01:05:50,120
already enters IoT Hub.
1406
01:05:50,120 --> 01:05:51,240
That includes telemetry,
1407
01:05:51,240 --> 01:05:52,760
but also simple lifecycle notices
1408
01:05:52,760 --> 01:05:55,000
that should start a quick business or support action.
1409
01:05:55,000 --> 01:05:57,240
Technically, you can route many non-telemetry events.
1410
01:05:57,240 --> 01:05:58,600
The issue isn't whether it's possible.
1411
01:05:58,600 --> 01:06:01,160
The issue is what every recipient now has to build
1412
01:06:01,160 --> 01:06:02,600
just to react to a simple change.
1413
01:06:02,600 --> 01:06:04,200
Take a new gateway registration.
1414
01:06:04,200 --> 01:06:06,200
A device identity appears in IoT Hub
1415
01:06:06,200 --> 01:06:08,440
and someone needs to verify the asset owner,
1416
01:06:08,440 --> 01:06:10,280
site assignment, and network zone.
1417
01:06:10,280 --> 01:06:11,400
That's a sparse event.
1418
01:06:11,400 --> 01:06:12,840
It happens once during onboarding,
1419
01:06:12,840 --> 01:06:15,000
not every few seconds across a shift.
1420
01:06:15,000 --> 01:06:16,840
If you route it into a data pipeline,
1421
01:06:16,840 --> 01:06:18,520
the receiving team may need a consumer
1422
01:06:18,520 --> 01:06:19,960
that reads from an event hub,
1423
01:06:19,960 --> 01:06:22,200
processes the record, tracks its offset,
1424
01:06:22,200 --> 01:06:23,240
handles retries,
1425
01:06:23,240 --> 01:06:25,080
and then starts the onboarding task.
1426
01:06:25,080 --> 01:06:27,080
That's a lot of plumbing for a notification
1427
01:06:27,080 --> 01:06:29,640
that really means a new device needs review.
1428
01:06:29,640 --> 01:06:31,640
The same pattern appears with device deletion.
1429
01:06:31,640 --> 01:06:34,120
A security or asset team may need to know quickly
1430
01:06:34,120 --> 01:06:36,120
that a cloud identity disappeared.
1431
01:06:36,120 --> 01:06:38,760
They don't need to consume a continuous machine stream
1432
01:06:38,760 --> 01:06:40,360
and wait until their consumer reaches
1433
01:06:40,360 --> 01:06:42,120
that one lifecycle record.
1434
01:06:42,120 --> 01:06:44,680
They need a focused notice that starts a defined check.
1435
01:06:44,680 --> 01:06:46,280
Routing can still deliver the message,
1436
01:06:46,280 --> 01:06:48,760
but it may put the wrong burden on the downstream system.
1437
01:06:48,760 --> 01:06:51,400
Each team then builds its own consumer logic.
1438
01:06:51,400 --> 01:06:53,080
One group pulls or reads a stream
1439
01:06:53,080 --> 01:06:54,600
for new device registrations.
1440
01:06:54,600 --> 01:06:57,480
Another reads the same or a separate path for disconnects.
1441
01:06:57,480 --> 01:06:59,080
A third team builds a small service
1442
01:06:59,080 --> 01:07:00,840
to detect deletion events.
1443
01:07:00,840 --> 01:07:04,200
Soon, basic workflow triggers sit inside stream consumers
1444
01:07:04,200 --> 01:07:06,440
that were built mainly because the data arrived
1445
01:07:06,440 --> 01:07:08,360
through a telemetry-oriented route
1446
01:07:08,360 --> 01:07:10,200
that adds delay and ownership confusion.
1447
01:07:10,200 --> 01:07:11,640
A stream consumer works well
1448
01:07:11,640 --> 01:07:13,080
when it needs a sequence of records
1449
01:07:13,080 --> 01:07:15,080
and can process them at its own pace.
1450
01:07:15,080 --> 01:07:17,640
A provisioning workflow usually wants a prompt trigger.
1451
01:07:17,640 --> 01:07:20,200
A support escalation often wants a direct notice.
1452
01:07:20,200 --> 01:07:22,520
An external service may only need a webhook call
1453
01:07:22,520 --> 01:07:24,040
after a device state change,
1454
01:07:24,040 --> 01:07:26,840
forcing each of those use cases through a shared data path
1455
01:07:26,840 --> 01:07:29,320
can turn a simple response into a chain of readers,
1456
01:07:29,320 --> 01:07:31,400
checkpoints, queues, and custom rules.
1457
01:07:31,400 --> 01:07:32,760
None of those pieces are wrong.
1458
01:07:32,760 --> 01:07:34,520
They just don't belong in every workflow.
1459
01:07:34,520 --> 01:07:37,240
Think about the person who owns the device on boarding process.
1460
01:07:37,240 --> 01:07:40,520
They should be able to define which device created events matter,
1461
01:07:40,520 --> 01:07:42,200
where they go, and what follows.
1462
01:07:42,200 --> 01:07:44,360
They shouldn't need to understand the consumer group design
1463
01:07:44,360 --> 01:07:47,400
for production telemetry merely to create an asset review task
1464
01:07:47,400 --> 01:07:49,000
that separation helps teams move
1465
01:07:49,000 --> 01:07:50,920
without stepping on each other's work.
1466
01:07:50,920 --> 01:07:53,800
IoT Hub message routing also has a finite number of custom
1467
01:07:53,800 --> 01:07:54,600
endpoints.
1468
01:07:54,600 --> 01:07:57,160
On paid IoT Hub tiers, the documented limit
1469
01:07:57,160 --> 01:07:59,160
is 10 custom endpoints per hub,
1470
01:07:59,160 --> 01:08:01,480
though one endpoint can support multiple routes.
1471
01:08:01,480 --> 01:08:04,360
For a focused telemetry architecture that can work well,
1472
01:08:04,360 --> 01:08:07,160
but if every department, workflow and external application
1473
01:08:07,160 --> 01:08:08,760
asks for its own direct route,
1474
01:08:08,760 --> 01:08:11,080
the endpoint limit becomes an architecture discussion
1475
01:08:11,080 --> 01:08:12,280
sooner than expected.
1476
01:08:12,280 --> 01:08:14,360
At that point teams often add more bridges,
1477
01:08:14,360 --> 01:08:16,360
a routed message enters an event hub.
1478
01:08:16,360 --> 01:08:17,800
A custom worker reads it,
1479
01:08:17,800 --> 01:08:19,720
the worker republishes it somewhere else,
1480
01:08:19,720 --> 01:08:22,280
another service filters it, then a workflow starts.
1481
01:08:22,280 --> 01:08:24,760
You can build that chain, but it deserves a question.
1482
01:08:24,760 --> 01:08:26,680
Are we preserving an operational record,
1483
01:08:26,680 --> 01:08:30,040
or are we only trying to tell someone that a device changed state?
1484
01:08:30,040 --> 01:08:32,760
If the answer is notification, use a notification pattern.
1485
01:08:32,760 --> 01:08:35,320
This doesn't mean lifecycle events should never enter a data path.
1486
01:08:35,320 --> 01:08:37,720
A central operations team may retain those events
1487
01:08:37,720 --> 01:08:40,840
for audit, diagnostics, or device fleet analysis.
1488
01:08:40,840 --> 01:08:41,880
That can be useful.
1489
01:08:41,880 --> 01:08:44,440
A device connection history can support an investigation.
1490
01:08:44,440 --> 01:08:47,480
Device creation and deletion records can support governance,
1491
01:08:47,480 --> 01:08:50,520
but retaining a record and distributing a prompt of separate needs.
1492
01:08:50,520 --> 01:08:53,480
You may route lifecycle data for history while event grid publishes
1493
01:08:53,480 --> 01:08:56,280
the same kind of change to the systems that need to react.
1494
01:08:56,280 --> 01:08:58,280
One path lets you analyze patterns later.
1495
01:08:58,280 --> 01:08:59,480
The other starts the work now.
1496
01:08:59,480 --> 01:09:02,440
Those paths can share identity and correlation details
1497
01:09:02,440 --> 01:09:05,800
without forcing every consumer to behave like a stream processor.
1498
01:09:05,800 --> 01:09:09,000
That becomes more relevant as an industrial Azure estate grows.
1499
01:09:09,000 --> 01:09:10,920
Analytics teams need stable data paths.
1500
01:09:10,920 --> 01:09:12,920
OT support teams need technical alerts,
1501
01:09:12,920 --> 01:09:14,920
asset teams need controlled onboarding,
1502
01:09:14,920 --> 01:09:17,000
business workflows need their own boundaries.
1503
01:09:17,000 --> 01:09:20,200
A single route for everything can feel tidy in the first workshop
1504
01:09:20,200 --> 01:09:24,360
then become a shared bottleneck once each group starts adding its own requirements.
1505
01:09:24,360 --> 01:09:25,960
IoT Hub routing remains useful.
1506
01:09:25,960 --> 01:09:27,720
It just isn't the only tool that belongs
1507
01:09:27,720 --> 01:09:29,720
after a device message reaches Azure.
1508
01:09:29,720 --> 01:09:33,320
The cleaner pattern separates the paths by the decision they support.
1509
01:09:33,320 --> 01:09:35,480
One plane carries operational data
1510
01:09:35,480 --> 01:09:37,000
while another distributes the signals
1511
01:09:37,000 --> 01:09:39,720
that ask people and systems to respond.
1512
01:09:39,720 --> 01:09:42,520
The combined pattern, data plane and control plane,
1513
01:09:42,520 --> 01:09:45,560
the cleaner architecture starts by giving each path a clear job.
1514
01:09:45,560 --> 01:09:47,960
IoT Hub sits at the edge to cloud boundary,
1515
01:09:47,960 --> 01:09:49,960
where gateways and devices authenticate,
1516
01:09:49,960 --> 01:09:52,200
send machine data, report manage state,
1517
01:09:52,200 --> 01:09:53,720
and where the design calls for it,
1518
01:09:53,720 --> 01:09:55,880
receive controlled messages from the cloud.
1519
01:09:55,880 --> 01:09:57,480
That device boundary matters because
1520
01:09:57,480 --> 01:10:00,040
OT and cloud systems have different concerns.
1521
01:10:00,040 --> 01:10:01,800
A gateway may talk to older PLCs,
1522
01:10:01,800 --> 01:10:04,280
normalized tag names, buffer data during a network break,
1523
01:10:04,280 --> 01:10:07,240
and send a defined message contract when the connection returns.
1524
01:10:07,240 --> 01:10:11,080
While IoT Hub manages the cloud facing identity and intake path.
1525
01:10:11,080 --> 01:10:12,600
From there, think in two planes,
1526
01:10:12,600 --> 01:10:14,680
the data plane carries the operational record.
1527
01:10:14,680 --> 01:10:16,280
It moves telemetry in other records,
1528
01:10:16,280 --> 01:10:19,240
where sequence, retention, and later analysis matter.
1529
01:10:19,240 --> 01:10:21,400
IoT Hub message routing selects the records
1530
01:10:21,400 --> 01:10:22,680
that belong in that plane
1531
01:10:22,680 --> 01:10:24,840
and sends them to stream or storage paths
1532
01:10:24,840 --> 01:10:26,520
built for the consumers that need them.
1533
01:10:26,520 --> 01:10:29,000
Those consumers may include a stream process,
1534
01:10:29,000 --> 01:10:31,400
a raw archive, or an operational data service.
1535
01:10:31,400 --> 01:10:33,000
They don't all need to run at the same speed
1536
01:10:33,000 --> 01:10:35,080
and they don't all ask the same questions.
1537
01:10:35,080 --> 01:10:38,040
What they share is a need for dependable production facts
1538
01:10:38,040 --> 01:10:39,560
rather than a one-time prompt.
1539
01:10:39,560 --> 01:10:41,560
The control plane handles a different kind of traffic.
1540
01:10:41,560 --> 01:10:44,200
It distributes notices about device lifecycle changes
1541
01:10:44,200 --> 01:10:46,760
or carefully defined conditions that need a response.
1542
01:10:46,760 --> 01:10:48,280
Event grid sits well in that path
1543
01:10:48,280 --> 01:10:49,640
because of support workflow,
1544
01:10:49,640 --> 01:10:52,280
an asset process, and a security check can each subscribe
1545
01:10:52,280 --> 01:10:54,760
without becoming part of the telemetry processing chain.
1546
01:10:54,760 --> 01:10:57,480
This doesn't mean control plane equals machine control.
1547
01:10:57,480 --> 01:10:59,400
That phrase can cause trouble in manufacturing
1548
01:10:59,400 --> 01:11:02,520
because a cloud workflow should not silently take authority
1549
01:11:02,520 --> 01:11:04,840
over equipment just because it received an event.
1550
01:11:04,840 --> 01:11:07,560
In this architecture, control plane means coordination
1551
01:11:07,560 --> 01:11:10,200
of digital processes, opening an investigation,
1552
01:11:10,200 --> 01:11:12,360
checking ownership, confirming a data path
1553
01:11:12,360 --> 01:11:14,040
or asking a responsible person to act.
1554
01:11:14,040 --> 01:11:17,080
Physical control remains subject to the rules,
1555
01:11:17,080 --> 01:11:19,720
safeguards and local systems that govern the equipment.
1556
01:11:19,720 --> 01:11:21,880
The two planes can use the same device identity
1557
01:11:21,880 --> 01:11:23,720
without becoming the same pipeline.
1558
01:11:23,720 --> 01:11:25,720
A gateway called plant-appress-12
1559
01:11:25,720 --> 01:11:28,520
should mean the same technical device across both paths.
1560
01:11:28,520 --> 01:11:31,240
Its messages should carry consistent identifiers.
1561
01:11:31,240 --> 01:11:34,200
Its asset relationship should point to the same equipment record
1562
01:11:34,200 --> 01:11:35,640
and the people responsible for it
1563
01:11:35,640 --> 01:11:37,720
should not have to guess whether a notification refers
1564
01:11:37,720 --> 01:11:39,960
to the gateway, the PLC, or the press.
1565
01:11:39,960 --> 01:11:42,440
Naming sounds boring until an incident starts.
1566
01:11:42,440 --> 01:11:44,280
If one path uses a device ID,
1567
01:11:44,280 --> 01:11:45,880
another uses a local asset code
1568
01:11:45,880 --> 01:11:48,600
and a third uses a hostname from an old network sheet.
1569
01:11:48,600 --> 01:11:50,040
The automation may work perfectly
1570
01:11:50,040 --> 01:11:52,440
while the support team spends 20 minutes working out
1571
01:11:52,440 --> 01:11:54,520
which physical thing actually needs attention.
1572
01:11:54,520 --> 01:11:58,360
Shared identity rules remove that kind of avoidable delay.
1573
01:11:58,360 --> 01:12:00,760
The asset model also needs to cross both paths.
1574
01:12:00,760 --> 01:12:02,040
A data consumer may need to know
1575
01:12:02,040 --> 01:12:04,040
that a reading belongs to press 12.
1576
01:12:04,040 --> 01:12:05,640
A workflow handler may need to know
1577
01:12:05,640 --> 01:12:07,720
that the same device sits online too
1578
01:12:07,720 --> 01:12:09,800
and belongs to a defined support group.
1579
01:12:09,800 --> 01:12:11,400
Neither IoT Hub nor Event Grid
1580
01:12:11,400 --> 01:12:13,160
creates those business relationships for you.
1581
01:12:13,160 --> 01:12:15,080
They move information through the architecture,
1582
01:12:15,080 --> 01:12:16,840
your model supplies the meaning.
1583
01:12:16,840 --> 01:12:20,120
That shared context also gives you a clean boundary between teams.
1584
01:12:20,120 --> 01:12:23,000
The analytics team can own how telemetry enters the data plane,
1585
01:12:23,000 --> 01:12:24,600
how long it remains available,
1586
01:12:24,600 --> 01:12:26,600
and how it becomes usable production data.
1587
01:12:26,600 --> 01:12:28,760
The workflow team can own who receives a notice,
1588
01:12:28,760 --> 01:12:29,880
what checks happen first,
1589
01:12:29,880 --> 01:12:31,320
and when an issue reaches a person.
1590
01:12:31,320 --> 01:12:33,880
Both teams rely on common contracts for device identity,
1591
01:12:33,880 --> 01:12:36,040
timestamps, message classes, and asset references.
1592
01:12:36,040 --> 01:12:38,840
They don't need to edit each other's pipelines for every change.
1593
01:12:38,840 --> 01:12:39,960
Without that separation,
1594
01:12:39,960 --> 01:12:43,080
a new maintenance workflow can create risk for production analytics
1595
01:12:43,080 --> 01:12:46,200
or a data model change can quietly break a support process
1596
01:12:46,200 --> 01:12:48,040
that somebody built six months ago.
1597
01:12:48,040 --> 01:12:51,320
Coupling like that rarely shows up in a first architecture sketch.
1598
01:12:51,320 --> 01:12:53,320
It appears when the plant adds another line,
1599
01:12:53,320 --> 01:12:56,120
another gateway type, or another team asking for access,
1600
01:12:56,120 --> 01:12:58,120
a clear split keeps the growth manageable.
1601
01:12:58,120 --> 01:13:00,200
There will still be cases where the planes meet.
1602
01:13:00,200 --> 01:13:01,880
A stream process may detect a condition
1603
01:13:01,880 --> 01:13:03,720
and publish a focused event for action.
1604
01:13:03,720 --> 01:13:05,880
A workflow may receive a disconnect notice
1605
01:13:05,880 --> 01:13:08,840
and query recent telemetry to assess data loss.
1606
01:13:08,840 --> 01:13:09,720
That's healthy.
1607
01:13:09,720 --> 01:13:11,720
The connection happens through an explicit contract
1608
01:13:11,720 --> 01:13:14,040
not because every raw message travels everywhere,
1609
01:13:14,040 --> 01:13:16,440
so the architecture becomes easier to reason about.
1610
01:13:16,440 --> 01:13:18,040
The data plane preserves what happened,
1611
01:13:18,040 --> 01:13:20,360
the control plane coordinates who needs to respond,
1612
01:13:20,360 --> 01:13:22,120
both begin with connected equipment
1613
01:13:22,120 --> 01:13:24,120
and both need the same factory context,
1614
01:13:24,120 --> 01:13:25,880
but neither should impersonate the other.
1615
01:13:25,880 --> 01:13:27,640
Once that data plane reaches Microsoft,
1616
01:13:27,640 --> 01:13:30,040
Fabric and Power BI another boundary appears.
1617
01:13:30,040 --> 01:13:31,640
Reporting can describe production.
1618
01:13:31,640 --> 01:13:34,840
It doesn't automatically decide what production should do next.
1619
01:13:34,840 --> 01:13:36,920
From telemetry to Fabric and Power BI.
1620
01:13:36,920 --> 01:13:38,760
Once telemetry reaches the data plane,
1621
01:13:38,760 --> 01:13:41,320
Microsoft Fabric can become part of a plant path
1622
01:13:41,320 --> 01:13:43,720
from machine signals to production analysis.
1623
01:13:43,720 --> 01:13:45,640
But Fabric shouldn't become the first place
1624
01:13:45,640 --> 01:13:48,760
where raw, shop floor messages are asked to explain the factory.
1625
01:13:48,760 --> 01:13:50,520
The source data still needs structure.
1626
01:13:50,520 --> 01:13:52,280
A gateway may send a cycle count,
1627
01:13:52,280 --> 01:13:55,480
a temperature, a run state, and an energy reading.
1628
01:13:55,480 --> 01:13:57,320
Those messages can land in a raw layer
1629
01:13:57,320 --> 01:13:59,240
where you preserve the original record,
1630
01:13:59,240 --> 01:14:01,880
its source timestamp, its device identity,
1631
01:14:01,880 --> 01:14:03,400
and the time as you received it.
1632
01:14:03,400 --> 01:14:05,240
That record matters when someone later asks
1633
01:14:05,240 --> 01:14:07,480
whether a number changed because the machine changed.
1634
01:14:07,480 --> 01:14:10,520
The gateway buffer data or transformation rule changed.
1635
01:14:10,520 --> 01:14:11,960
Raw telemetry is evidence.
1636
01:14:11,960 --> 01:14:13,560
It isn't yet a production fact.
1637
01:14:13,560 --> 01:14:15,480
The next layer turns signals into records
1638
01:14:15,480 --> 01:14:16,680
that people can use.
1639
01:14:16,680 --> 01:14:19,800
A run state message can link to a defined machine state.
1640
01:14:19,800 --> 01:14:21,480
A cycle count can become output only
1641
01:14:21,480 --> 01:14:23,800
when the logic accounts for resets, rejected parts,
1642
01:14:23,800 --> 01:14:25,480
and the production context that explains
1643
01:14:25,480 --> 01:14:26,680
which order the machine ran.
1644
01:14:26,680 --> 01:14:28,280
Energy data can link to an asset
1645
01:14:28,280 --> 01:14:29,800
in a time period without pretending
1646
01:14:29,800 --> 01:14:31,720
that every watt belongs to a good part.
1647
01:14:31,720 --> 01:14:33,320
That work needs a governed model.
1648
01:14:33,320 --> 01:14:35,800
In Fabric, you might bring together prepared telemetry
1649
01:14:35,800 --> 01:14:39,320
with MES events, quality records, and asset reference data.
1650
01:14:39,320 --> 01:14:42,680
The result shouldn't just be one large table of timestamps and values.
1651
01:14:42,680 --> 01:14:45,080
It should give each record a clear meaning,
1652
01:14:45,080 --> 01:14:46,280
which asset produced it,
1653
01:14:46,280 --> 01:14:48,440
which production period it belongs to,
1654
01:14:48,440 --> 01:14:49,560
what source supplied it,
1655
01:14:49,560 --> 01:14:51,000
and which business rules shaped it.
1656
01:14:51,000 --> 01:14:53,400
Otherwise, Power BI can produce a very clean report
1657
01:14:53,400 --> 01:14:54,840
from a very confused foundation.
1658
01:14:54,840 --> 01:14:56,040
And we've all seen that movie.
1659
01:14:56,040 --> 01:14:57,240
Think about downtime.
1660
01:14:57,240 --> 01:14:59,240
A device may stop sending a run signal,
1661
01:14:59,240 --> 01:15:01,640
but the MES may record a planned change over.
1662
01:15:01,640 --> 01:15:03,800
The operator may enter a material shortage,
1663
01:15:03,800 --> 01:15:05,400
maintenance may record a fault.
1664
01:15:05,400 --> 01:15:08,120
If the report uses only the device stream,
1665
01:15:08,120 --> 01:15:09,960
it can turn several different causes
1666
01:15:09,960 --> 01:15:11,400
into one generic gap.
1667
01:15:11,400 --> 01:15:13,080
That may look like real-time visibility.
1668
01:15:13,080 --> 01:15:14,520
It isn't useful visibility.
1669
01:15:14,520 --> 01:15:16,040
A better model keeps the machine signal
1670
01:15:16,040 --> 01:15:18,760
and the MES reason code as separate facts,
1671
01:15:18,760 --> 01:15:20,360
then connects them through time,
1672
01:15:20,360 --> 01:15:22,680
asset, operation, and work order context.
1673
01:15:22,680 --> 01:15:24,360
The report can show where they agree,
1674
01:15:24,360 --> 01:15:25,000
where they differ,
1675
01:15:25,000 --> 01:15:26,760
and where someone needs to investigate.
1676
01:15:26,760 --> 01:15:28,200
It doesn't force the sensor data
1677
01:15:28,200 --> 01:15:29,960
to claim knowledge it never had.
1678
01:15:29,960 --> 01:15:33,160
OEE or overall equipment effectiveness is a good example.
1679
01:15:33,160 --> 01:15:35,480
People often want to calculate it straight from counters
1680
01:15:35,480 --> 01:15:37,560
and state tags because the formula looks simple.
1681
01:15:37,560 --> 01:15:39,640
But OEE depends on how the plant defines
1682
01:15:39,640 --> 01:15:42,520
plant production time, availability losses, performance losses,
1683
01:15:42,520 --> 01:15:44,360
quality losses, and the reasons behind them.
1684
01:15:44,360 --> 01:15:46,760
A machine counter can support that calculation.
1685
01:15:46,760 --> 01:15:48,680
It can't define those rules on its own.
1686
01:15:48,680 --> 01:15:51,800
If the MES treats a scheduled cleaning cycle as planned time,
1687
01:15:51,800 --> 01:15:54,120
while the machine data model treats it as downtime,
1688
01:15:54,120 --> 01:15:57,000
the report will create an argument before it creates insight.
1689
01:15:57,000 --> 01:15:58,840
The answer isn't to pick whichever source
1690
01:15:58,840 --> 01:16:00,200
produces the better number.
1691
01:16:00,200 --> 01:16:02,760
The answer is, to agree on the production definition,
1692
01:16:02,760 --> 01:16:04,200
record the source facts,
1693
01:16:04,200 --> 01:16:06,680
and apply the rule openly in the curated model.
1694
01:16:06,680 --> 01:16:10,360
That is where fabric can help connect the dots between IT and OT.
1695
01:16:10,360 --> 01:16:12,280
It can bring data from separate systems
1696
01:16:12,280 --> 01:16:14,120
into a common analytical path
1697
01:16:14,120 --> 01:16:16,280
while the model keeps track of which system


