

 Apple Podcasts
 Spotify
 Youtube Music
 Spreaker
 Podchaser
 Amazon Music
 Microsoft Cloud for Sustainability - Simply Explained
Quick Answer: Microsoft Cloud for Sustainability is an important Microsoft topic for teams that need clearer technical decisions, safer implementation, and practical operational value. This episode explains what it does, where it fits in the Microsoft ecosystem, and the key considerations for administrators, architects, and business stakeholders.
Sustainability plays a crucial role in today's business landscape. As you strive to meet your sustainability goals, you face increasing pressure from consumers, investors, and regulations. The Microsoft Cloud for Sustainability offers innovative solutions to help you navigate these challenges. This platform empowers you to measure, manage, and reduce your environmental impact effectively. By utilizing this comprehensive tool, you can enhance your sustainability efforts and contribute positively to the planet.
Key Takeaways
- Sustainability is essential for business success. Companies must adopt sustainable practices to meet consumer and regulatory demands.
- The Microsoft Cloud for Sustainability helps organizations measure and manage their environmental impact effectively.
- Integrating ESG data is crucial. The platform centralizes data, making it easier to track emissions and report on sustainability efforts.
- Automation enhances efficiency. Streamlined processes reduce manual tasks, allowing teams to focus on strategic sustainability initiatives.
- AI-driven insights provide valuable analytics. Organizations can identify inefficiencies and make informed decisions to improve sustainability.
- Real-time data access supports proactive risk management. Businesses can adapt to climate change and mitigate environmental impacts effectively.
- Sustainable development drives innovation. The platform enables organizations to create eco-friendly products while minimizing their carbon footprint.
- Starting with a Proof of Concept can help organizations test data integration and workflows, maximizing their sustainability efforts.
Market Overview
Need for Sustainability
The demand for sustainability in business has surged in recent years. Companies recognize that adopting sustainable practices is no longer optional; it is essential for long-term success. The market for sustainability solutions in the enterprise sector is projected to reach USD 31.05 billion by 2026. This growth reflects a broader trend, with the global green technology and sustainability market valued at USD 25.44 billion in 2025. By 2034, this market could expand to USD 140.03 billion, achieving a compound annual growth rate (CAGR) of 20.70%.
Several factors drive this increasing need for sustainability:
| Driver | Description |
|---|---|
| Increasing regulations | Over 1700 regulations related to climate change and environmental protection exist worldwide, necessitating compliance from businesses. |
| Expanding consumer base | Companies adopting green strategies can access new markets and attract customers who prioritize environmental and social performance. |
| Access to capital | Investors increasingly seek information on companies' environmental and social governance (ESG) performance, linking sustainability to financial success. |
| Social license to operate | Companies are assessing their impacts on communities to avoid conflicts and ensure sustainable resource use. |
| Employee attraction and retention | Job candidates prefer employers with a clear sustainability vision, making it a key factor in attracting and retaining talent. |
| Enhancing operational efficiency | Sustainability practices can lead to improved resource efficiency and operational reliability, benefiting long-term business interests. |
| Risk preparedness | Businesses must plan for increasing resource costs and adapt to climate change, making sustainability essential for future resilience. |
| Leadership | Innovative leaders are integrating sustainability into business strategies to meet stakeholder expectations. |
| A platform for innovation | Social and environmental challenges present opportunities for new business models and sustainable products. |
| Brand value and reputation | Positive stakeholder relations through sustainability initiatives enhance brand value and can serve as effective marketing tools. |
Challenges in Measurement
Despite the clear need for sustainability, organizations face significant challenges in measuring their environmental impact. Many struggle with data coverage gaps, which 47% of respondents identify as the biggest challenge. Data quality issues also plague businesses, with 41% citing this as a concern. Inconsistencies across providers further complicate the situation, affecting 40% of organizations.
The following table highlights the most common challenges organizations encounter when measuring their environmental impact:
| Challenge Description | Percentage of Respondents |
|---|---|
| ESG data coverage gaps as the biggest challenge | 47% |
| Data quality issues | 41% |
| Inconsistencies across providers | 40% |
| Data quality as a top ESG reporting challenge | 76% |
| Struggles with fragmented ESG data across systems | 60% |
| Confidence in the accuracy of ESG data | <30% |
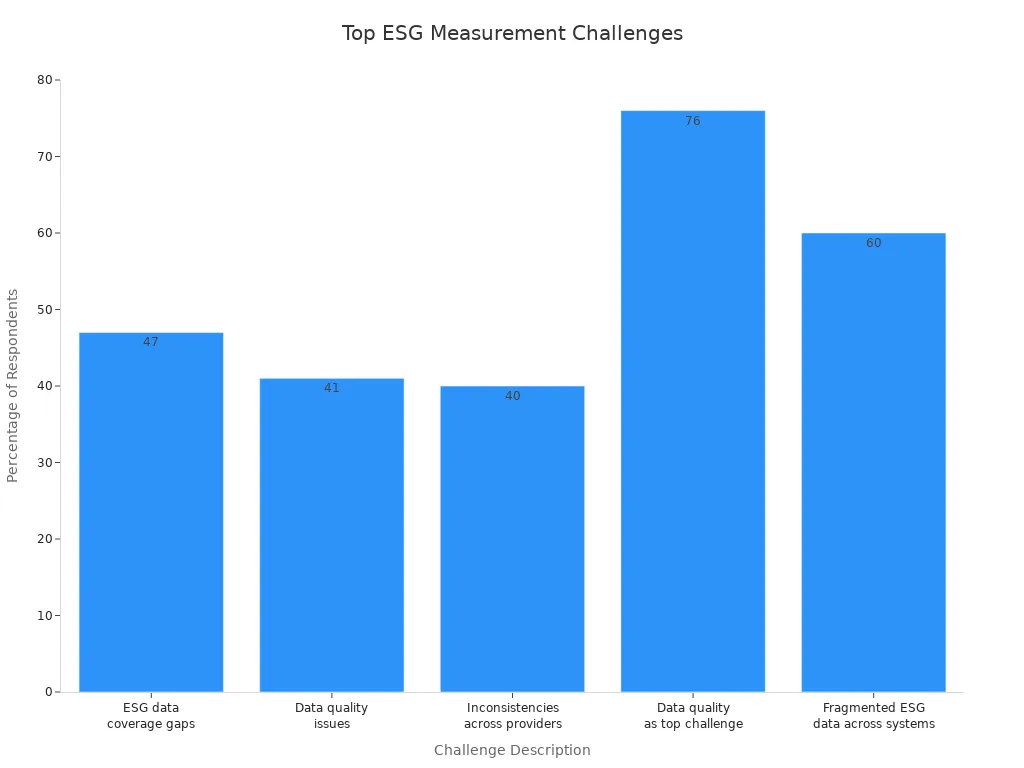
These challenges hinder your ability to implement effective sustainability initiatives. Without accurate data, you cannot measure your carbon emissions or track your overall environmental impact. Addressing these issues is crucial for any organization committed to sustainability.
Microsoft Cloud for Sustainability Solutions
Key Offerings
Microsoft Cloud for Sustainability provides a range of features designed to empower organizations in their sustainability efforts. Here are some core offerings:
| Core Features and Offerings | Description |
|---|---|
| Create efficiencies | Help organizations unify and automate data capture, reduce costs and emissions, and empower employees with analytics. |
| Build resilience | Identify opportunities for cleaner options, improve compliance, and adopt sustainable technologies. |
| Innovate for growth | Explore sustainability innovations, modernize fleets, and reduce environmental impacts. |
| Advance the sustainability of AI | Optimize energy efficiency in data centers and improve AI sustainability. |
These offerings enable you to streamline your operations and enhance your sustainability initiatives. By leveraging these features, you can effectively manage your environmental impact and drive meaningful change within your organization.
ESG Data Integration
Integrating Environmental, Social, and Governance (ESG) data is crucial for effective sustainability management. Microsoft Cloud for Sustainability excels in this area by providing a robust framework for data integration. Here’s how it works:
- The Project ESG Lake standardizes and centralizes ESG data from various systems.
- It allows you to consolidate emissions data from Microsoft Sustainability Manager and third-party solutions.
- The integration includes data related to Microsoft Azure and Microsoft 365 usage, enriching your ESG data estate.
This comprehensive approach ensures that you have access to accurate and reliable sustainability data. It simplifies the process of tracking your environmental impact and enhances your ability to make informed decisions.
The platform also incorporates advanced AI capabilities to enhance ESG data analysis. Here’s how AI plays a role:
| Evidence Description | Role in ESG Data Analysis |
|---|---|
| Intelligent insights in Microsoft Sustainability Manager | Helps organizations analyze complex data patterns and drive meaning from data to make informed decisions. |
| Predictive analytics with what-if analysis | Allows businesses to simulate different scenarios and assess potential impacts of decisions. |
| Streamlined reporting processes | Enhances the richness of sustainability reporting, aiding compliance and effective action towards ESG targets. |
By utilizing these AI-driven insights, you can gain a deeper understanding of your sustainability performance. This empowers you to set realistic goals and track your progress effectively.
In the words of Louise Ol-Ers, a Fellowmind Group Sustainability Manager, “External reporting in Microsoft Sustainability Manager is a true game changer to our customers as they strive to comply with the EU’s Corporate Sustainability Reporting Directive (CSRD). Customers can leverage their existing Microsoft platform technology and data for efficient and compliant sustainability reporting.”
With Microsoft Cloud for Sustainability, you can transform your sustainability data into actionable insights, driving your organization toward a more sustainable future.
Creating Efficiencies with Sustainability

Streamlined Operations
Microsoft Cloud for Sustainability significantly enhances your operational efficiency. The platform provides unified data that allows you to gain actionable insights. Here are some ways it streamlines your operations:
- It automates data connections, enabling you to track your environmental footprint more accurately.
- The platform facilitates data ingestion, integration, calculation, and reporting through standardized methods.
- You can record and report carbon emissions, water usage, and waste metrics seamlessly.
- Consulting and implementation services help visualize data through intuitive dashboards.
These features empower you to manage your sustainability initiatives effectively. You can address common operational challenges, such as managing your environmental footprint and embedding sustainability into your value chain. By achieving better visibility into your enterprise activities, you can make strategic business investments that balance growth and impact.
Resource Reduction
Reducing resource consumption is vital for achieving your emission reduction goals. Microsoft Cloud for Sustainability offers a Software as a Service solution that captures data and enables you to aggregate and analyze sustainability data effectively. This capability allows you to set measurable sustainability goals and take actionable steps toward achieving them.
Here are some effective resource reduction strategies enabled by the platform:
| Strategy | Description |
|---|---|
| Carbon-free electricity (CFE) | Utilizes renewable energy sources like wind, solar, and hydroelectric power to reduce carbon emissions and improve fuel efficiency. |
| Supplier enablement programs | Assists suppliers in transitioning to CFE, helping them meet carbon reduction targets. |
Additionally, the platform aggregates sustainability data in real-time, accelerates data reporting and integration, and provides precise carbon accounting. These intelligent insights allow you to develop actionable strategies that contribute to your sustainability efforts.
By leveraging Microsoft Cloud for Sustainability, you can effectively reduce your carbon footprint and enhance your overall sustainability performance.
Building Resilience through Microsoft Cloud
Climate Adaptation
Adapting to climate change is essential for organizations aiming to thrive in an unpredictable environment. Microsoft Cloud for Sustainability equips you with the tools to assess and manage climate risks effectively. Here are some key initiatives that support your adaptation efforts:
| Initiative | Description |
|---|---|
| Assess climate risk | Enables climate and environmental risk modeling to understand climate and financial risks. |
| Launch new ESG solutions | Utilizes digital technologies to analyze and visualize ESG data, creating evidence-based products. |
| Microsoft Sustainability Manager | Unifies data to help organizations record, report, and reduce emissions, including connections to the Emissions Impact Dashboard. |
| Microsoft Emissions Impact Dashboard | A web-based interface for tracking and managing cloud service usage across impact points in value chains. |
These initiatives allow you to address materiality and reporting requirements with cloud-based solutions. By leveraging these tools, you can enhance your organization's resilience against climate-related challenges.
Microsoft has also developed energy-efficient data centers designed to withstand extreme weather events. These centers feature heat-resistant cooling systems, flood-proof designs, and redundant power systems. Such adaptations ensure operational continuity during climate disasters, making them attractive to enterprise customers who prioritize disaster preparedness.
Risk Management
Effective risk management is crucial for navigating the uncertainties of climate change. Microsoft Cloud for Sustainability provides you with strategies to mitigate risks associated with environmental impacts. Here are some key approaches:
- Data-Driven Decision Making: Utilize real-time data to identify potential risks and develop proactive strategies. This approach allows you to respond swiftly to changing conditions.
- Scenario Planning: Implement what-if analyses to simulate various climate scenarios. This helps you understand potential impacts and make informed decisions.
- Compliance and Reporting: Streamline your reporting processes to meet regulatory requirements. The platform simplifies compliance, allowing you to focus on sustainability initiatives rather than paperwork.
By integrating these risk management strategies, you can build a resilient organization that adapts to climate change while minimizing carbon emissions. The Microsoft Cloud for Sustainability empowers you to take control of your environmental impact and drive meaningful change.
Innovating for Growth in Sustainability
Sustainable Development
Sustainable development is essential for organizations aiming to thrive in a competitive market. Microsoft Cloud for Sustainability enables you to innovate in product development while minimizing environmental impact. The platform centralizes data from various sources, streamlining the processes of ingestion, sharing, calculations, and reporting. This efficiency allows you to focus on creating sustainable products that meet consumer demands.
Here are some innovations made possible by Microsoft Cloud for Sustainability:
| Innovation Type | Description |
|---|---|
| Data Management | Centralizes data to streamline sustainability efforts. |
| AI Integration | Infuses AI for advanced analytics and actionable insights. |
| Emissions Tracking | Tracks Scope 1, 2, and 3 emissions, including product carbon footprint calculations. |
| Water and Waste Management | Improves tracking of water consumption and waste management practices. |
| Environmental Credit Service | Enhances transparency in carbon credit ecosystems. |
Organizations like Emirates NBD and Mitsubishi Electric have already seen significant benefits from these innovations. For instance, Emirates NBD reduced its sustainability reporting time from three months to just one week. This improvement provided better visibility into emissions data and supported major investments. Similarly, Mitsubishi Electric optimized its smart building operations, enhancing overall efficiency.
Supply Chain Enhancement
Enhancing supply chain sustainability is crucial for long-term success. Microsoft Cloud for Sustainability supports this goal through data sharing and collaboration. By integrating advanced analytics and AI, you gain real-time insights that improve operational efficiency.
Here are some key ways the platform enhances supply chain sustainability:
- Centralizes supplier emissions data, streamlining processes significantly.
- Promotes circular business models that drive innovation and cost optimization.
- Implements AI-powered automation, achieving a remarkable 92% reduction in survey processing time.
For example, Microsoft utilized its Cloud for Sustainability to centralize supplier emissions data. This centralization streamlined processes significantly, allowing for better decision-making and resource allocation.
Additionally, Microsoft focuses on optimizing datacenter energy and water efficiency, advancing low-carbon materials, and improving the energy efficiency of cloud and AI services. These sustainability investments are crucial for enabling customers to scale responsibly while enhancing supply chain resilience.
By leveraging Microsoft Cloud for Sustainability, you can drive innovation in your product development and enhance the sustainability of your supply chain. This approach not only meets regulatory requirements but also positions your organization as a leader in sustainability.
Advancing AI for Sustainability
AI Insights
Artificial intelligence (AI) plays a pivotal role in enhancing sustainability initiatives. With Microsoft Cloud for Sustainability, you gain access to powerful AI-driven insights that help you make informed decisions. These insights allow you to optimize operations and reduce your environmental impact. Here are some key features of AI insights:
| Feature | Description |
|---|---|
| Real-time data | Enables informed decision-making to optimize operations and reduce environmental impact. |
| Advanced analytics | Provides insights into inefficiencies and opportunities for improvement in environmental performance. |
| ESG reporting support | Automates data collection for compliance with global sustainability frameworks, ensuring accurate and transparent reporting. |
By leveraging these features, you can track critical environmental metrics and generate data-driven sustainability reports. AI-powered insights help you identify inefficiencies and transition to greener alternatives. Predictive analytics allow you to assess environmental trends and risks, enabling proactive measures.
For instance, organizations like ABB have achieved remarkable results through AI. They reported 25% efficiency gains in data centers and 18% energy savings in cement production. Such advancements demonstrate the potential of AI to drive significant improvements in sustainability practices.
Automation Practices
Automation is another crucial aspect of advancing sustainability through AI. Microsoft Cloud for Sustainability streamlines processes, allowing you to focus on your sustainability goals. Here are some benefits of automation in sustainable practices:
- Efficiency Gains: Automation reduces manual tasks, freeing up resources for more strategic initiatives.
- Faster Reporting: Automated data collection and reporting processes enhance accuracy and speed, allowing you to meet compliance requirements efficiently.
- Resource Optimization: AI-driven automation helps you manage resources more effectively, minimizing waste and maximizing efficiency.
For example, Microsoft Copilot completed a summarization task 55 times faster and used 47 times less energy than human professionals. This showcases how automation can significantly enhance productivity while reducing environmental impact.
Looking ahead, future trends in AI for sustainability include adopting modern cloud strategies and optimizing cloud workloads. Transitioning to efficient cloud environments can significantly reduce energy consumption while enhancing performance. Additionally, managing data responsibly leads to more sustainable AI systems by minimizing unnecessary resource use.
By embracing AI insights and automation practices, you can transform your sustainability efforts. Microsoft Cloud for Sustainability empowers you to achieve your goals while making a positive impact on the planet.
In summary, Microsoft Cloud for Sustainability empowers you to achieve your sustainability goals effectively. This platform offers innovative solutions that streamline operations, enhance data integration, and drive meaningful change. Organizations that have successfully implemented this platform have seen remarkable achievements, such as matching 100% of their electricity consumption with renewable energy and replenishing more water than they withdraw.
To maximize your sustainability efforts, consider defining the ESG landscape and assessing your organization's maturity level. Start with a Proof of Concept to test data integration and workflows. By leveraging Microsoft Cloud for Sustainability, you can transform your approach to sustainability and make a positive impact on the planet.
FAQ
What is Microsoft Cloud for Sustainability?
Microsoft Cloud for Sustainability is a platform that helps organizations measure, manage, and reduce their environmental impact. It consolidates data from various sources to provide actionable insights for sustainability initiatives.
How does the platform help with ESG reporting?
The platform simplifies ESG reporting by integrating data from multiple systems. It offers built-in templates for compliance with international frameworks, making it easier for you to generate accurate reports.
Can I track my carbon emissions with this platform?
Yes, Microsoft Cloud for Sustainability allows you to track carbon emissions across Scope 1, 2, and 3. You can record and report emissions data seamlessly, helping you meet your sustainability goals.
What types of data can I integrate?
You can integrate various types of data, including emissions, water usage, and waste management metrics. The platform centralizes this information for comprehensive analysis and reporting.
How does AI enhance sustainability efforts?
AI provides intelligent insights and predictive analytics, helping you identify inefficiencies and assess environmental trends. This enables you to make informed decisions and optimize your sustainability initiatives.
Is the platform suitable for all business sizes?
Yes, Microsoft Cloud for Sustainability is designed for organizations of all sizes. Whether you're a small business or a large enterprise, the platform can help you achieve your sustainability objectives.
How can I get started with Microsoft Cloud for Sustainability?
To get started, you can explore Microsoft’s offerings and consider a Proof of Concept. This allows you to test data integration and workflows tailored to your organization’s needs.
🎧 You Should Also Listen To
- Microsoft Fabric – Simply Explained provides the next practical learning step and adds useful context for this topic.
- Power Platform – Simply Explained provides the next practical learning step and adds useful context for this topic.
- AI Agents – Simply Explained provides the next practical learning step and adds useful context for this topic.
Last reviewed: July 2026.
🚀 Want to be part of m365.fm?
Then stop just listening… and start showing up.
👉 Connect with me on LinkedIn and let’s make something happen:
- 🎙️ Be a podcast guest and share your story
- 🎧 Host your own episode (yes, seriously)
- 💡 Pitch topics the community actually wants to hear
- 🌍 Build your personal brand in the Microsoft 365 space
This isn’t just a podcast — it’s a platform for people who take action.
🔥 Most people wait. The best ones don’t.
👉 Connect with me on LinkedIn and send me a message:
"I want in"
Let’s build something awesome 👊
1
00:00:00,000 --> 00:00:05,020
Today's topic is one of that almost everyone has heard of, but almost nobody can explain in plain English.
2
00:00:05,020 --> 00:00:06,880
Microsoft Cloud for sustainability.
3
00:00:06,880 --> 00:00:09,520
Is it just a fancy carbon calculator for big corporations?
4
00:00:09,520 --> 00:00:10,920
Or is it something much bigger?
5
00:00:10,920 --> 00:00:11,840
Here's the thing.
6
00:00:11,840 --> 00:00:15,140
Right now, most companies cannot tell you their carbon footprint.
7
00:00:15,140 --> 00:00:19,260
Not because they don't want to or don't care, but because the data is a complete mess.
8
00:00:19,260 --> 00:00:24,160
It lives in utility bills, fuel logs, supplier spreadsheets, HR systems.
9
00:00:24,160 --> 00:00:29,200
It's scattered across different departments, different formats, and different people who never talk to each other.
10
00:00:29,200 --> 00:00:34,240
Sustainability teams spend most of their time just hunting down data instead of doing something useful with it.
11
00:00:34,240 --> 00:00:40,240
Microsoft Cloud for sustainability is a platform that takes that chaos and turns it into a clear, actionable picture.
12
00:00:40,240 --> 00:00:45,440
By the end of this episode, you'll understand what it actually is, how the three building blocks work together,
13
00:00:45,440 --> 00:00:50,760
and why real companies are already using it to save time, money, and the planet.
14
00:00:50,760 --> 00:00:53,120
The messy reality of sustainability data.
15
00:00:53,120 --> 00:00:56,600
We have to understand the problem before we can understand the solution.
16
00:00:56,600 --> 00:01:00,880
So here it is. Imagine you work for a mid-sized company with a few thousand employees.
17
00:01:00,880 --> 00:01:04,720
Someone in leadership says, "We need to report our carbon footprint for this year."
18
00:01:04,720 --> 00:01:06,600
Simple question, right? Not even close.
19
00:01:06,600 --> 00:01:08,800
That one question triggers a chain reaction.
20
00:01:08,800 --> 00:01:11,240
You need electricity data from every office and factory.
21
00:01:11,240 --> 00:01:16,920
Fuel consumption from the fleet vehicles, air travel data from HR, waste disposal records from facility managers,
22
00:01:16,920 --> 00:01:18,800
and supplier data from procurement.
23
00:01:18,800 --> 00:01:24,000
Each of these lives in a different system, managed by a different person, in a completely different format.
24
00:01:24,000 --> 00:01:27,640
One facility manager sends you a PDF of last year's utility bills.
25
00:01:27,640 --> 00:01:30,640
Another sends an Excel spreadsheet with columns in a different order.
26
00:01:30,640 --> 00:01:33,720
Procurement gives you a CSV export from their supplier portal,
27
00:01:33,720 --> 00:01:36,600
and HR has a separate system for tracking business travel.
28
00:01:36,600 --> 00:01:39,400
None of them talk to each other, and none of them use the same units.
29
00:01:39,400 --> 00:01:43,040
So you get electricity in kilowatt hours, natural gas in terms, and fuel in gallons.
30
00:01:43,040 --> 00:01:46,760
You're basically trying to solve a jigsaw puzzle where the pieces come from different boxes.
31
00:01:46,760 --> 00:01:50,960
And regulations like the EU's corporate sustainability reporting directive, CSRD,
32
00:01:50,960 --> 00:01:53,920
are making accurate reporting mandatory, not optional.
33
00:01:53,920 --> 00:01:57,840
Miss the deadline or get it wrong and you face fines, reputational damage or worse.
34
00:01:57,840 --> 00:02:02,080
So the pressure is on, but the tools most companies have are still just spreadsheets and email.
35
00:02:02,080 --> 00:02:05,080
Companies needed something better, a simple fix for a messy problem.
36
00:02:05,080 --> 00:02:07,880
That's where Microsoft Cloud for sustainability comes in.
37
00:02:07,880 --> 00:02:11,960
What Microsoft Cloud for sustainability actually is, here's the simplest definition.
38
00:02:11,960 --> 00:02:14,440
Microsoft Cloud for sustainability is not a single app.
39
00:02:14,440 --> 00:02:18,440
It's a connected platform built on the power platform and Dynamics 365.
40
00:02:18,440 --> 00:02:21,760
Think of it as a central command center for all your sustainability data.
41
00:02:21,760 --> 00:02:26,360
Imagine your company's data is scattered across dozens of filing cabinets in different rooms.
42
00:02:26,360 --> 00:02:29,080
Microsoft Cloud for sustainability pulls all those papers out,
43
00:02:29,080 --> 00:02:31,680
sorts them, translates them into the same language,
44
00:02:31,680 --> 00:02:34,360
and gives you one clear view of what's actually happening.
45
00:02:34,360 --> 00:02:38,080
The platform has three main jobs, record your emissions, report on them accurately,
46
00:02:38,080 --> 00:02:39,440
and reduce your impact over time.
47
00:02:39,440 --> 00:02:41,280
Record, report, reduce.
48
00:02:41,280 --> 00:02:43,200
That's the cycle.
49
00:02:43,200 --> 00:02:49,200
Microsoft launched this in 2021 as part of their own commitment to be carbon negative by 2030.
50
00:02:49,200 --> 00:02:54,520
They learned a lot from managing their own sustainability data and turned that experience into a product for everyone else.
51
00:02:54,520 --> 00:02:55,800
It comes in two tiers.
52
00:02:55,800 --> 00:02:59,280
Essentials cost $4,000 per month and covers the basics.
53
00:02:59,280 --> 00:03:04,560
Carbon, water, waste tracking, and calculations for scope one, two, and some scope three emissions.
54
00:03:04,560 --> 00:03:08,000
Premium costs $12,000 per month and unlocks the advanced stuff.
55
00:03:08,000 --> 00:03:12,080
Full scope three coverage, AI-powered insights, co-pilot integration,
56
00:03:12,080 --> 00:03:14,680
product carbon footprint management, and more storage.
57
00:03:14,680 --> 00:03:17,840
So there's an option for smaller companies just getting started
58
00:03:17,840 --> 00:03:20,600
and for large enterprises with complex reporting needs.
59
00:03:20,600 --> 00:03:22,320
And it's not just about carbon anymore.
60
00:03:22,320 --> 00:03:26,200
The platform now covers water, waste, and social and governance data, too.
61
00:03:26,200 --> 00:03:31,520
The full ESG picture, but carbon is where most companies start, and that's what we'll focus on.
62
00:03:31,520 --> 00:03:33,920
Building block one, getting the data in.
63
00:03:33,920 --> 00:03:35,600
So how does this actually work?
64
00:03:35,600 --> 00:03:38,720
Let's walk through the three building blocks, starting with the first one,
65
00:03:38,720 --> 00:03:40,080
getting the data into the system.
66
00:03:40,080 --> 00:03:44,160
Because without data, you've got nothing to calculate, nothing to report, nothing to act on.
67
00:03:44,160 --> 00:03:46,920
Microsoft gives you four different ways to bring data in.
68
00:03:46,920 --> 00:03:48,920
You pick the one that fits your situation.
69
00:03:48,920 --> 00:03:50,240
Option A is the simplest.
70
00:03:50,240 --> 00:03:51,320
Excel templates.
71
00:03:51,320 --> 00:03:54,760
Microsoft provides pre-built templates for each data category.
72
00:03:54,760 --> 00:03:59,240
Electricity usage, fuel consumption, waste disposal, you name it.
73
00:03:59,240 --> 00:04:02,400
The template already has the right columns, the right format, the right structure.
74
00:04:02,400 --> 00:04:05,880
You download it, fill in your numbers, and upload it back into the system.
75
00:04:05,880 --> 00:04:06,400
That's it.
76
00:04:06,400 --> 00:04:09,000
This works great for small teams or companies just getting started.
77
00:04:09,000 --> 00:04:10,520
No technical skills needed.
78
00:04:10,520 --> 00:04:13,480
Option B is where it gets more powerful, power query.
79
00:04:13,480 --> 00:04:18,200
This is a tool built into the platform that can pull data directly from other systems.
80
00:04:18,200 --> 00:04:22,920
We're talking over 40 connectors, SAP Salesforce utility providers, you name it.
81
00:04:22,920 --> 00:04:26,840
Instead of exporting a CSV file, emailing it to yourself and uploading it manually,
82
00:04:26,840 --> 00:04:29,760
you set up a connection once and the data flows in automatically.
83
00:04:29,760 --> 00:04:33,720
You can even schedule it to run on a regular basis every month, every week.
84
00:04:33,720 --> 00:04:34,880
Whatever makes sense.
85
00:04:34,880 --> 00:04:38,520
This is the option most companies graduate to once they're past the pilot phase.
86
00:04:38,520 --> 00:04:40,040
Option C is partner connectors.
87
00:04:40,040 --> 00:04:45,000
Microsoft has pre-built integrations with companies like EcoAct and other ESG data providers.
88
00:04:45,000 --> 00:04:48,880
If you're already working with a sustainability data partner, chances are there's a connector
89
00:04:48,880 --> 00:04:52,120
that plugs straight into Microsoft Cloud for sustainability.
90
00:04:52,120 --> 00:04:56,800
You authenticate, configure the schedule, and data flows in without any custom work.
91
00:04:56,800 --> 00:04:58,320
Option D covers the edge cases.
92
00:04:58,320 --> 00:04:59,760
Manual data collection.
93
00:04:59,760 --> 00:05:03,120
Sometimes data doesn't come from a structured system you can connect to.
94
00:05:03,120 --> 00:05:06,240
Maybe you need to ask facility managers for electricity readings.
95
00:05:06,240 --> 00:05:08,320
Maybe you need HR to submit travel data.
96
00:05:08,320 --> 00:05:12,240
The platform has a built in portal where you can send data requests to people inside your
97
00:05:12,240 --> 00:05:13,240
organization.
98
00:05:13,240 --> 00:05:16,440
They get an email, fill in the required information, and submit it.
99
00:05:16,440 --> 00:05:18,560
It lands in the system, ready for calculation.
100
00:05:18,560 --> 00:05:20,560
Here's the key thing about all four options.
101
00:05:20,560 --> 00:05:23,120
Every piece of data flows into the same standard data model.
102
00:05:23,120 --> 00:05:24,800
That means everything speaks the same language.
103
00:05:24,800 --> 00:05:26,320
No more mismatched spreadsheets.
104
00:05:26,320 --> 00:05:28,000
No more converting units manually.
105
00:05:28,000 --> 00:05:31,080
No more wondering if the numbers from different departments are even comparable.
106
00:05:31,080 --> 00:05:32,480
The platform handles all of that.
107
00:05:32,480 --> 00:05:33,960
So data is in the system.
108
00:05:33,960 --> 00:05:35,720
But raw numbers don't tell you anything.
109
00:05:35,720 --> 00:05:38,280
You need to turn them into actual emissions.
110
00:05:38,280 --> 00:05:40,880
Building block two, calculating your real impact.
111
00:05:40,880 --> 00:05:42,760
So you've got all this raw data.
112
00:05:42,760 --> 00:05:44,080
10,000 miles driven.
113
00:05:44,080 --> 00:05:46,560
50,000 kilowatt hours of electricity.
114
00:05:46,560 --> 00:05:48,680
What does that actually mean for the climate?
115
00:05:48,680 --> 00:05:50,520
Activity numbers alone don't tell you much.
116
00:05:50,520 --> 00:05:53,880
You need to know the carbon that comes with each mile or each kilowatt hour.
117
00:05:53,880 --> 00:05:55,520
That's where emissions factors come in.
118
00:05:55,520 --> 00:05:57,920
Think of an emissions factor as a conversion rate.
119
00:05:57,920 --> 00:06:02,320
For every mile in a certain type of vehicle, a fixed amount of CO2 is produced.
120
00:06:02,320 --> 00:06:07,080
For every kilowatt hour from a specific power grid, a fixed amount of CO2 is produced.
121
00:06:07,080 --> 00:06:10,880
You apply your activity data by the right factor and you get your emissions number.
122
00:06:10,880 --> 00:06:13,840
Microsoft built these factors right into the platform.
123
00:06:13,840 --> 00:06:18,480
Libraries from the EPA, the international energy agency and other trusted sources are already there.
124
00:06:18,480 --> 00:06:20,000
The math happens automatically.
125
00:06:20,000 --> 00:06:23,320
You don't need to be a carbon accountant to get accurate results.
126
00:06:23,320 --> 00:06:25,000
The calculations cover three scopes.
127
00:06:25,000 --> 00:06:27,680
Scope one is the direct stuff you own or control.
128
00:06:27,680 --> 00:06:31,080
The fuel in your company trucks, the natural gas in your factory furnace.
129
00:06:31,080 --> 00:06:32,720
Scope two is the energy you buy.
130
00:06:32,720 --> 00:06:34,800
The electricity that lights your offices.
131
00:06:34,800 --> 00:06:37,040
Scope three is everything else in your value chain.
132
00:06:37,040 --> 00:06:41,200
You send data requests to suppliers and they submit their information in a structured way.
133
00:06:41,200 --> 00:06:43,880
The platform does all the calculation work in the background.
134
00:06:43,880 --> 00:06:45,360
You input the activity data.
135
00:06:45,360 --> 00:06:47,280
It applies the right emissions factors.
136
00:06:47,280 --> 00:06:50,200
Outcomes your carbon footprint across all three.
137
00:06:50,200 --> 00:06:52,200
You can't get the same amount of energy.
138
00:06:52,200 --> 00:06:54,200
You can't get the same amount of energy.
139
00:06:54,200 --> 00:06:56,200
You can't get the same amount of energy.
140
00:06:56,200 --> 00:06:58,200
You can't get the same amount of energy.
141
00:06:58,200 --> 00:07:00,200
You can't get the same amount of energy.
142
00:07:00,200 --> 00:07:02,200
You can't get the same amount of energy.
143
00:07:02,200 --> 00:07:04,200
You can't get the same amount of energy.
144
00:07:04,200 --> 00:07:06,200
You can't get the same amount of energy.
145
00:07:06,200 --> 00:07:08,200
You can't get the same amount of energy.
146
00:07:08,200 --> 00:07:10,200
You can't get the same amount of energy.
147
00:07:10,200 --> 00:07:12,200
You can't get the same amount of energy.
148
00:07:12,200 --> 00:07:14,200
You can't get the same amount of energy.
149
00:07:14,200 --> 00:07:16,200
You can't get the same amount of energy.
150
00:07:16,200 --> 00:07:18,200
You can't get the same amount of energy.
151
00:07:18,200 --> 00:07:20,200
You can't get the same amount of energy.
152
00:07:20,200 --> 00:07:22,200
You can't get the same amount of energy.
153
00:07:22,200 --> 00:07:24,200
You can't get the same amount of energy.
154
00:07:24,200 --> 00:07:26,200
You can't get the same amount of energy.
155
00:07:26,200 --> 00:07:28,200
You can't get the same amount of energy.
156
00:07:28,200 --> 00:07:30,200
You can't get the same amount of energy.
157
00:07:30,200 --> 00:07:32,200
You can't get the same amount of energy.
158
00:07:32,200 --> 00:07:34,200
You can't get the same amount of energy.
159
00:07:34,200 --> 00:07:36,200
You can't get the same amount of energy.
160
00:07:36,200 --> 00:07:38,200
You can't get the same amount of energy.
161
00:07:38,200 --> 00:07:40,200
You can't get the same amount of energy.
162
00:07:40,200 --> 00:07:42,200
You can't get the same amount of energy.
163
00:07:42,200 --> 00:07:44,200
You can't get the same amount of energy.
164
00:07:44,200 --> 00:07:46,200
You can't get the same amount of energy.
165
00:07:46,200 --> 00:07:48,200
You can't get the same amount of energy.
166
00:07:48,200 --> 00:07:50,200
You can't get the same amount of energy.
167
00:07:50,200 --> 00:07:52,200
You can't get the same amount of energy.
168
00:07:52,200 --> 00:07:54,200
You can't get the same amount of energy.
169
00:07:54,200 --> 00:07:56,200
You can't get the same amount of energy.
170
00:07:56,200 --> 00:07:58,200
You can't get the same amount of energy.
171
00:07:58,200 --> 00:08:00,200
You can't get the same amount of energy.
172
00:08:00,200 --> 00:08:02,200
You can't get the same amount of energy.
173
00:08:02,200 --> 00:08:04,200
You can't get the same amount of energy.
174
00:08:04,200 --> 00:08:06,200
You can't get the same amount of energy.
175
00:08:06,200 --> 00:08:08,200
You can't get the same amount of energy.
176
00:08:08,200 --> 00:08:10,200
You can't get the same amount of energy.
177
00:08:10,200 --> 00:08:12,200
You can't get the same amount of energy.
178
00:08:12,200 --> 00:08:14,200
You can't get the same amount of energy.
179
00:08:14,200 --> 00:08:16,200
You can't get the same amount of energy.
180
00:08:16,200 --> 00:08:18,200
You can't get the same amount of energy.
181
00:08:18,200 --> 00:08:20,200
You can't get the same amount of energy.
182
00:08:20,200 --> 00:08:22,200
You can't get the same amount of energy.
183
00:08:22,200 --> 00:08:24,200
You can't get the same amount of energy.
184
00:08:24,200 --> 00:08:26,200
You can't get the same amount of energy.
185
00:08:26,200 --> 00:08:28,200
You can't get the same amount of energy.
186
00:08:28,200 --> 00:08:30,200
You can't get the same amount of energy.
187
00:08:30,200 --> 00:08:30,200
You can't get the same amount of energy.
188
00:08:30,200 --> 00:08:31,200
You can't get the same amount of energy.
189
00:08:31,200 --> 00:08:33,200
You can't get the same amount of energy.
190
00:08:33,200 --> 00:08:35,200
You can't get the same amount of energy.
191
00:08:35,200 --> 00:08:37,200
You can't get the same amount of energy.
192
00:08:37,200 --> 00:08:39,200
You can't get the same amount of energy.
193
00:08:39,200 --> 00:08:41,200
You can't get the same amount of energy.
194
00:08:41,200 --> 00:08:43,200
You can't get the same amount of energy.
195
00:08:43,200 --> 00:08:45,200
You can't get the same amount of energy.
196
00:08:45,200 --> 00:08:47,200
You can't get the same amount of energy.
197
00:08:47,200 --> 00:08:49,200
You can't get the same amount of energy.
198
00:08:49,200 --> 00:08:51,200
You can't get the same amount of energy.
199
00:08:51,200 --> 00:08:53,200
You can't get the same amount of energy.
200
00:08:53,200 --> 00:08:55,200
You can't get the same amount of energy.
201
00:08:55,200 --> 00:08:57,200
You can't get the same amount of energy.
202
00:08:57,200 --> 00:08:59,200
You can't get the same amount of energy.
203
00:08:59,200 --> 00:09:00,200
You can't get the same amount of energy.
204
00:09:00,200 --> 00:09:02,200
And honestly, it's a nightmare.
205
00:09:02,200 --> 00:09:06,200
Microsoft Cloud for Sustainability includes ready-made templates for the major global frameworks.
206
00:09:06,200 --> 00:09:14,200
CSRD, GRI, IFRS, S1 and S2, SASB, ASRS, BRSR, pretty much every reporting standard you'd need is covered.
207
00:09:14,200 --> 00:09:19,200
You pick the one you're reporting against and the platform maps your data to the right fields automatically.
208
00:09:19,200 --> 00:09:20,200
No manual mapping.
209
00:09:20,200 --> 00:09:24,200
There's also an alternate emissions feature that lets you run parallel calculations.
210
00:09:24,200 --> 00:09:28,200
Maybe you report under the greenhouse gas protocol for your voluntary targets,
211
00:09:28,200 --> 00:09:31,200
but your local regulator requires a different calculation approach.
212
00:09:31,200 --> 00:09:36,200
Instead of maintaining two separate systems, you run both calculations from the same underlying data.
213
00:09:36,200 --> 00:09:39,200
The platform keeps them separate and tracks which methodology was used for each.
214
00:09:39,200 --> 00:09:41,200
Auditors appreciate this.
215
00:09:41,200 --> 00:09:45,200
The data trail feature gives them end-to-end visibility into where every number came from.
216
00:09:45,200 --> 00:09:51,200
They click on a reported emissions figure and trace it back through the calculation to the original activity data and the source document.
217
00:09:51,200 --> 00:09:56,200
No more digging through email chains trying to figure out who entered what, and then there's co-pilot.
218
00:09:56,200 --> 00:10:00,200
The AI assistant built into sustainability manager can generate draft disclosures,
219
00:10:00,200 --> 00:10:03,200
summarise findings and answer questions in natural language.
220
00:10:03,200 --> 00:10:06,200
You ask, "What were our total scope to emissions last year?"
221
00:10:06,200 --> 00:10:08,200
And it pulls the answer from the system.
222
00:10:08,200 --> 00:10:13,200
You ask it to draft a paragraph for your CSRD report and it produces a first draft based on your actual data.
223
00:10:13,200 --> 00:10:16,200
What used to take three months of manual work now happens in a week?
224
00:10:16,200 --> 00:10:18,200
Emirates, NBD, proved that?
225
00:10:18,200 --> 00:10:21,200
They cut their reporting time from three months down to one week.
226
00:10:21,200 --> 00:10:24,200
That's a 75% reduction in effort.
227
00:10:24,200 --> 00:10:27,200
Real results. Companies using it today.
228
00:10:27,200 --> 00:10:30,200
So the platform handles the data, the calculations and the reports.
229
00:10:30,200 --> 00:10:34,200
But does it actually work in the real world? Let's look at some real companies using it right now.
230
00:10:34,200 --> 00:10:38,200
Emirates, NBD, a major bank in Dubai was drowning in manual reporting.
231
00:10:38,200 --> 00:10:44,200
Their sustainability teams spent months each year pulling data from different departments, reconciling spreadsheets and trying to get a clear picture.
232
00:10:44,200 --> 00:10:50,200
After implementing Microsoft Cloud for sustainability, they cut their reporting time from three months down to one week.
233
00:10:50,200 --> 00:10:52,200
That's 75% faster.
234
00:10:52,200 --> 00:10:59,200
Every time visibility into their emissions, they made targeted investments like a solar plant in Turkey and reduced their emissions by nearly 50% in a single year.
235
00:10:59,200 --> 00:11:06,200
ILO, a Brazilian payments company, was managing 63 different databases, each with its own format and structure.
236
00:11:06,200 --> 00:11:10,200
After implementing the platform, they reduced manual work by 42%.
237
00:11:10,200 --> 00:11:13,200
That's 403 hours saved per year.
238
00:11:13,200 --> 00:11:16,200
Basically an entire person's time freed up.
239
00:11:16,200 --> 00:11:23,200
Also saved about $15,000 annually in consulting costs because they no longer needed outside help to crunch their numbers.
240
00:11:23,200 --> 00:11:27,200
Mitsubishi Electric used the platform to refine their Susty Smart Building model.
241
00:11:27,200 --> 00:11:34,200
The result was unexpected. The building actually generates more energy than it uses, a 115% reduction in energy consumption.
242
00:11:34,200 --> 00:11:37,200
That's not just reporting, that's innovation driven by data.
243
00:11:37,200 --> 00:11:43,200
Worldwide technology, an IT services company, cut the time spent on emissions calculations by up to 20%.
244
00:11:43,200 --> 00:11:47,200
Tasks that used to take weeks now happen with the push of a button.
245
00:11:47,200 --> 00:11:50,200
The common thread here is simple, these aren't tech giants with unlimited budgets.
246
00:11:50,200 --> 00:11:54,200
They're real companies in banking, payments, manufacturing and IT services.
247
00:11:54,200 --> 00:12:03,200
And the biggest win for all of them wasn't just checking a compliance box and it was gaining visibility into where they could make changes that save money and reduce their environmental impact at the same time.
248
00:12:03,200 --> 00:12:12,200
So here's the bottom line, Microsoft Cloud for Sustainability turns a slow, manual, error-prone process into something automated and accurate.
249
00:12:12,200 --> 00:12:17,200
It's just three building blocks. Get the data in, calculate your impact report and take action.
250
00:12:17,200 --> 00:12:23,200
The real value isn't just checking compliance boxes, it's about finding ways to save money while shrinking your environmental footprint.
251
00:12:23,200 --> 00:12:28,200
If you're a business leader or handling ESG data, start by figuring out where your sustainability data lives today.
252
00:12:28,200 --> 00:12:31,200
That's the single most powerful step you can take.
253
00:12:31,200 --> 00:12:35,200
Subscribe for more plain English breakdowns like this one and drop a comment if something clicked.

Founder of m365.fm, m365.show and m365con.net
Mirko Peters is a Microsoft 365 expert, content creator, and founder of m365.fm, a platform dedicated to sharing practical insights on modern workplace technologies. His work focuses on Microsoft 365 governance, security, collaboration, and real-world implementation strategies.
Through his podcast and written content, Mirko provides hands-on guidance for IT professionals, architects, and business leaders navigating the complexities of Microsoft 365. He is known for translating complex topics into clear, actionable advice, often highlighting common mistakes and overlooked risks in real-world environments.
With a strong emphasis on community contribution and knowledge sharing, Mirko is actively building a platform that connects experts, shares experiences, and helps organizations get the most out of their Microsoft 365 investments.


