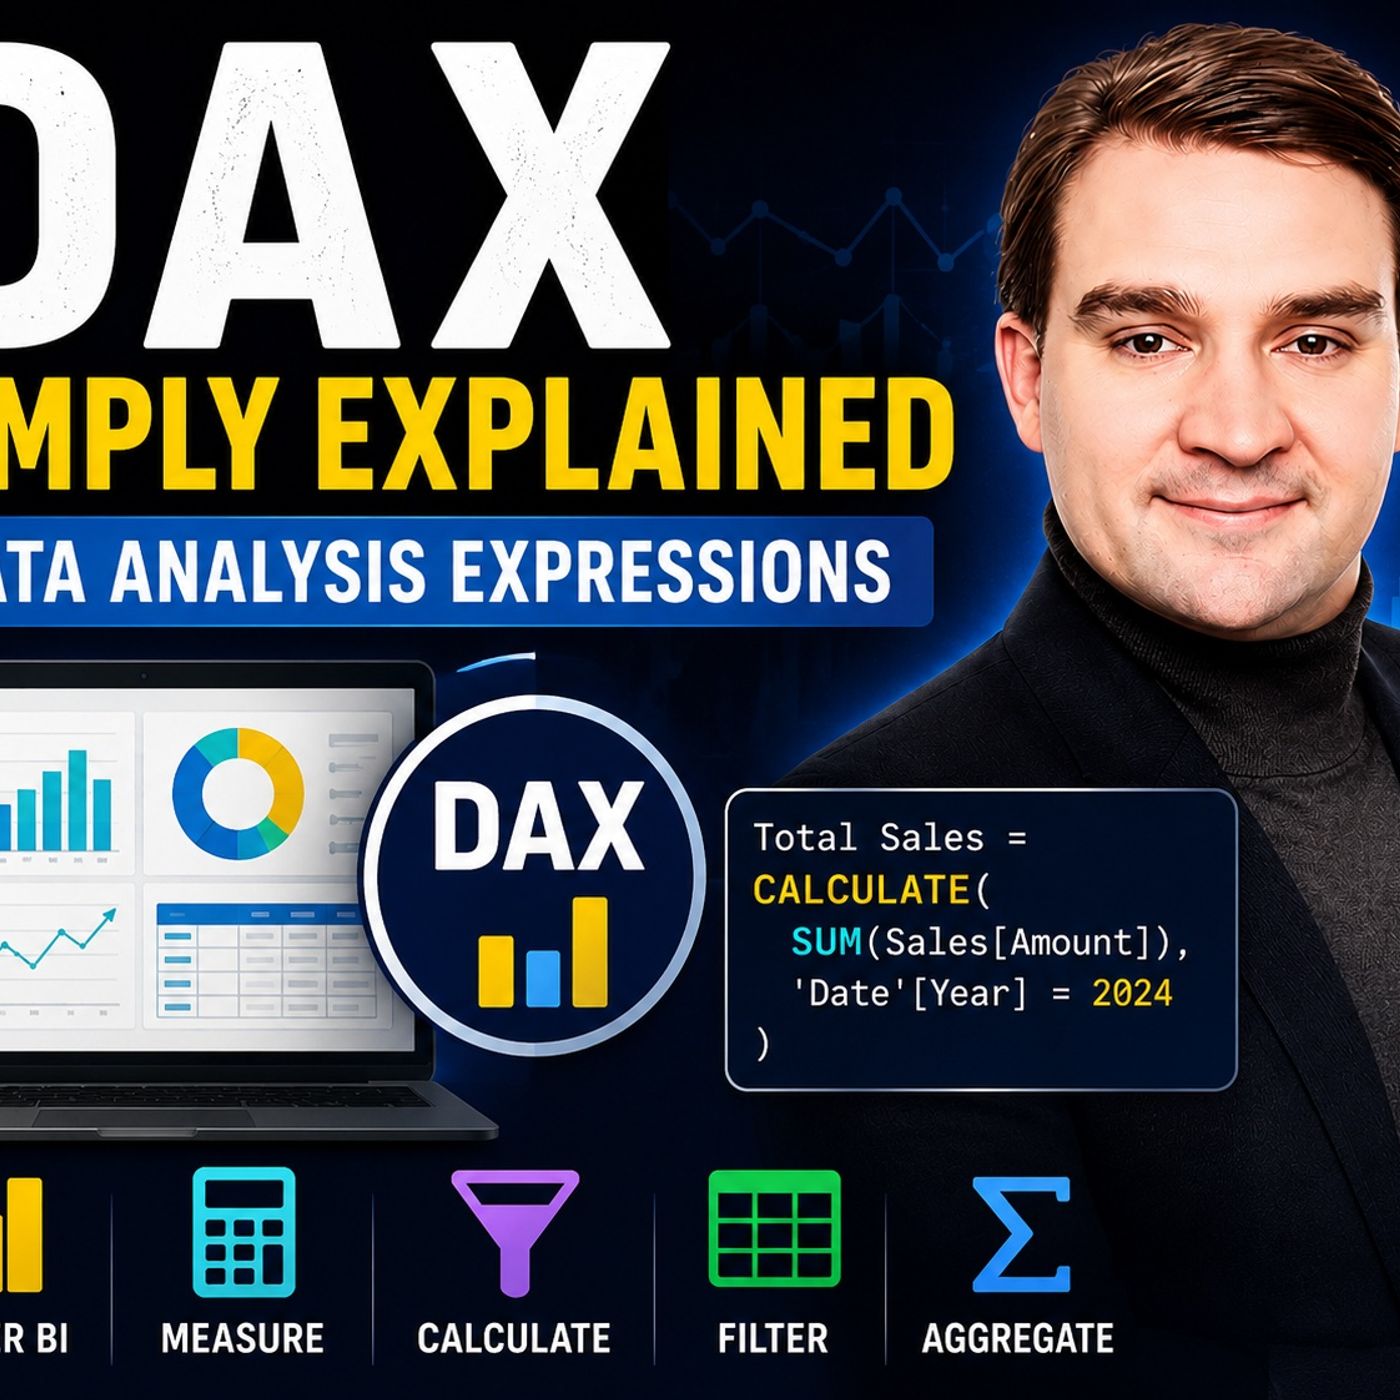
Demystifying DAX: A Beginner's Guide to Data Analysis Expressions
Welcome to the ultimate beginner's guide to Data Analysis Expressions, commonly known as DAX. If you have ever stared at a raw dataset in Power BI or Excel and wondered how to turn numbers on a spreadsheet into dynamic, interactive business intelligence, you are in the right place. DAX is the secret engine powering modern Microsoft analytics, and unlocking its potential can completely change how you interpret and present information.
Whether you are a seasoned data professional looking to brush up on your syntax or a complete novice stepping into the world of business intelligence for the first time, understanding DAX is essential. In this deep dive, we will explore what DAX is, how its functionality compares to traditional spreadsheet formulas, and practical ways you can apply it to your day-to-day workflow. This blog post expands directly upon concepts covered in our podcast, so be sure to check out the related episode Data Analysis Expressions (DAX) - Simply Explained for an audio walkthrough of these exact topics.
DAX Overview

What Is DAX?
Data Analysis Expressions, or DAX, is a formula language designed specifically for data analysis. You can use DAX to create custom calculations in tools like Power BI, Excel Power Pivot, and SQL Server Analysis Services. This language allows you to perform complex calculations across entire tables, rather than just individual cells. By leveraging DAX, you can transform raw data into meaningful insights that drive business decisions.
DAX operates similarly to Excel formulas but offers much more power. It enables you to create dynamic reports that respond to user inputs, such as filters and slicers. This capability is essential for interactive data analysis. As you become familiar with DAX, you will find that it provides advanced calculations and dynamic aggregations, setting it apart from other data analysis languages.
DAX Language Features
The DAX language has evolved significantly since its introduction. Below is a brief overview of its development:
| Year | Development Description |
|---|---|
| 2009 | DAX introduced with PowerPivot for Excel 2010 Add-in. |
| 2016 | Significant improvements with the adoption of Power BI and SQL Server 2016, including enhancements to DAX such as calculated tables and variables. |
| 2016 | Total number of functions in DAX reached 340. |
DAX is a functional programming language tailored for Business Intelligence tools. Its syntax resembles both SQL and Excel, focusing on tables, aggregations, and joins. You will notice that DAX emphasizes querying tables joined by relationships and aggregated values.
The most dangerous thing with DAX is that you can write things that work, long before you understand what is happening behind the scenes.
This quote highlights the importance of understanding the underlying mechanics of DAX. As you learn, you will discover that DAX provides unique features that enhance your data analysis capabilities. For instance, you can create calculated columns, measures, and tables, allowing for detailed and customized data analysis.
DAX Functionality
DAX Syntax Basics
When you write DAX formulas, you must follow specific syntax rules to ensure they work correctly. Here are some essential rules to keep in mind:
- All tables must have unique names.
- Column names must be unique within each table.
- Object names are case-insensitive.
- Use fully qualified names in certain contexts, such as when using functions like VALUES, ALL, or CALCULATE.
- Enclose table names in single quotation marks if they contain spaces or special characters.
- Measure names must always be in brackets and can contain spaces.
- You can reference column names without the base table unless there is a name conflict.
DAX formulas cannot modify or insert individual values in tables. Instead, you can create calculated columns and measures. DAX automatically identifies data types and performs implicit conversions, making it easier for you to work with your data.
Data Types in DAX
Understanding data types in DAX is crucial for effective data analysis. DAX supports several data types, and each type impacts calculations differently. Here is a summary of the key aspects of data types in DAX:
| Aspect | Description |
|---|---|
| Data Type Independence | The VertiPaq engine operates independently of data types. Different types (string, floating point, date) use similar memory and perform at comparable speeds due to dictionary encoding. |
| Impact of Mixed Data Types | Mixing data types in expressions can lead to necessary conversions, which may affect performance. Some conversions are efficient, while others require more resources from the formula engine, impacting overall calculation speed. |
| Conversion Errors | Errors can arise during data type conversions, particularly between fixed decimals and floating points, due to differences in precision. Developers must be cautious to minimize errors during conversions. |
| Performance Considerations | Mathematical operations may require callbacks to the formula engine, which can slow down performance. Ensuring consistent and minimal error during calculations is crucial for maintaining accuracy in results. |
DAX interacts seamlessly with data models in Power BI and Excel. You can create custom measures that enhance your visualizations, allowing for dynamic data analysis based on various fields. Additionally, DAX enables the creation of virtual tables from related or unrelated tables, providing flexibility in data manipulation.
By mastering DAX syntax and understanding data types, you can unlock the full potential of data analysis expressions. This knowledge allows you to create powerful formulas that drive insightful reporting and analysis.
Key Data Analysis Expressions
Aggregation Functions
Aggregation functions in DAX allow you to summarize data effectively. These functions help you calculate totals, averages, and other statistical measures across your datasets. Here are some of the most frequently used aggregation functions and their typical applications:
| Function | Definition | Typical Application |
|---|---|---|
| SUM | Combines values in a column to yield a total sum. | Calculating total revenue from a sales table. |
| MIN | Finds the smallest numeric value in a column. | Identifying the lowest sale amount in a dataset. |
| MINX | Calculates the minimum value of an expression per row. | Finding the lowest total sales by region. |
| COUNT | Counts non-blank values in a specified column. | Counting the number of sales transactions recorded. |
| COUNTA | Counts all non-blank values regardless of type. | Counting active employees in a boolean column. |
| COUNTROWS | Counts the number of rows in a table or expression. | Counting rows resulting from a filtered employee table. |
| DISTINCTCOUNT | Identifies the number of unique values in a column. | Counting unique products sold in a sales dataset. |
These aggregation functions are essential for performing data analysis expressions. They allow you to derive insights from your data, such as total revenue or the number of transactions. By using these functions, you can create meaningful reports that highlight key performance indicators.
Filter Functions
Filter functions in DAX enhance your ability to analyze data by applying conditions to your calculations. The DAX FILTER function, for example, efficiently handles filtering, applies conditional logic, and dynamically adjusts calculations. This capability empowers you to build measures that respond to slicers and page filters. Here are some key points about filter functions:
- They enable dynamic and context-aware calculations.
- They allow for complex filters to be applied to data.
- They facilitate sophisticated measures that respond to user interactions.
Using filter functions, you can perform robust data analysis, uncover valuable insights, and manage filters dynamically. This flexibility is crucial for creating interactive reports that adapt to user inputs.
Time Intelligence Functions
Time intelligence functions in DAX allow you to analyze data over time. These functions help you track performance across different periods, such as months, quarters, and years. Here are some key time intelligence functions and their descriptions:
| Function | Description |
|---|---|
| CLOSINGBALANCEMONTH | Evaluates the specified expression for the date corresponding to the end of the current month after applying specified filters. |
| CLOSINGBALANCEQUARTER | Evaluates the specified expression for the date corresponding to the end of the current quarter after applying specified filters. |
| CLOSINGBALANCEYEAR | Evaluates the specified expression for the date corresponding to the end of the current year after applying specified filters. |
| DATEADD | Moves the given set of dates by a specified interval. |
| DATESBETWEEN | Returns the dates between two given dates. |
| DATESYTD | Returns a set of dates in the year up to the last date visible in the filter context. |
These functions allow you to compare performance across years, quarters, and months. You can track Year-to-Date (YTD), Quarter-to-Date (QTD), and Month-to-Date (MTD) progress instantly. By leveraging time intelligence functions, you can build rolling KPIs and align reporting with real business cycles.
Understanding the differences between calculated columns and measures is also vital. Calculated columns are evaluated for each row and stored in memory. Use them when you need to group calculations or filter data. Measures, on the other hand, are evaluated based on the context of the query and are not stored in memory. They are dynamic and adjust based on the report context. Together, calculated columns and measures enable you to create interactive and insightful reports that respond to user inputs and filter selections.
Practical DAX Applications

DAX in Power BI
DAX plays a vital role in Power BI, enhancing your data analysis capabilities. You can create interactive dashboards that respond to user inputs. In Power BI, reports are multi-page interactive documents. You can edit these reports fully, using DAX measures and detailed visualizations. This flexibility allows you to build custom calculations that adapt based on the context of your data.
Here are some key DAX functions commonly used in Power BI:
| DAX Function | Description |
|---|---|
| SUM() | Adds up values in a column |
| CALCULATE() | Modifies filter context dynamically |
| FILTER() | Returns a subset of data |
| IF() | Implements conditional logic |
For example, you might use the CALCULATE function to create a measure that calculates total sales for the previous year. This dynamic calculation helps you track performance over time. By leveraging DAX, you can create reports that not only display data but also provide insights that drive business decisions.
DAX in Excel
In Excel, DAX enhances your data analysis through Power Pivot. While Excel formulas apply directly to cells, DAX operates on entire datasets. This difference allows for more dynamic calculations. You can create custom calculations that reference entire columns, making your analysis more robust.
DAX in Excel focuses on individual cell references. You can see immediate results in your spreadsheets. However, DAX measures adapt based on the context of your report visuals. This adaptability is crucial for creating insightful reports.
Here are some examples of DAX formulas commonly used in Excel projects:
| DAX Function | Description | Example |
|---|---|---|
| CALCULATE() | Modifies filter context for dynamic calculations. | Total Sales (Last Year) = CALCULATE(SUM(Sales[Revenue]), SAMEPERIODLASTYEAR(Date[Date])) |
| FILTER() | Allows complex row-level filtering. | High Value Sales = CALCULATE(SUM(Sales[Revenue]), FILTER(Sales, Sales[Revenue] > 10000)) |
| SWITCH() | Implements conditional logic for KPIs. | Performance Status = SWITCH(TRUE(), [Sales] > 1000000, "Excellent", [Sales] > 500000, "Good", "Needs Improvement") |
By mastering DAX in both Power BI and Excel, you can unlock the full potential of your data analysis. You will find that DAX enables advanced calculations that reflect business complexity. This capability allows you to create reports that are not only informative but also actionable.
Common DAX Challenges
Debugging DAX Formulas
Debugging DAX formulas can be challenging, especially for beginners. You may encounter various errors that hinder your progress. Here are some common errors you might face:
- Syntactic errors: Missing parentheses or commas can lead to confusion.
- Semantic errors: References to non-existing columns, tables, or functions often cause issues.
- Calculation errors: Type mismatches or incorrect arguments passed to functions can yield unexpected results.
To effectively debug your DAX formulas, consider using the following tools and techniques:
- EVALUATEANDLOG function: This function allows you to log intermediate results in DAX expressions. It helps trace and resolve logic issues.
- DAX Studio: An open-source application that facilitates the creation, execution, and analysis of DAX queries. It provides performance monitoring capabilities.
When debugging, avoid starting with syntax alone. Instead, test measures in multiple visuals to ensure they work correctly across different contexts. This approach helps you identify issues more effectively.
Performance Optimization Tips
Optimizing DAX performance is crucial for maintaining efficient reports. Here are some strategies to enhance your DAX queries:
- Shift Load to the Storage Engine (SE): Delegate computation to the SE whenever possible. This shift is vital for optimizing performance.
- Reduce the Number of Calls to the Storage Engine (SE): Structure queries to retrieve larger batches of data. This minimizes separate SE calls.
- Minimize Dependency on the Formula Engine (FE): Avoid functions that force row-by-row evaluations. This practice prevents bottlenecks.
- Optimize Data Model Design: Efficient data models reduce cardinality and improve performance.
- Use Aggregated Tables: Pre-aggregated summary tables reduce computational overhead and avoid repeated calculations.
- Leverage Caching: Optimize measure definitions to take advantage of caching mechanisms for faster query execution.
- Optimize Use of FILTER and Iterators: Direct column filtering is more efficient than using row-by-row evaluations.
- Avoid Large Many-to-Many Relationships: Simplifying relationships reduces computational complexity.
- Use Variables (VAR): Store intermediate results to prevent redundant calculations.
- Optimize Time Intelligence Functions: Use precomputed aggregated time-based tables for better performance.
Be cautious with common DAX patterns that hurt performance. Excessive use of ALL or REMOVEFILTERS can lead to unnecessary full table scans. Instead, consider using ALLEXCEPT to maintain necessary filters. Additionally, overcomplicating logic can slow down execution; simpler expressions are often more efficient.
By addressing these common challenges, you can enhance your DAX skills and create more efficient reports that deliver valuable insights.
Mastering DAX enhances your data analysis skills and empowers you to create insightful reports. You learned about DAX's unique features, syntax, and key functions. Understanding DAX allows you to perform complex calculations and build dynamic reports that respond to user inputs.
To deepen your knowledge, consider these key takeaways:
| Key Takeaway | Description |
|---|---|
| Understanding DAX | DAX behaves differently from Excel and SQL, requiring a different approach. |
| Avoid Memorization | Relying on memorization can lead to confusion; understanding context is crucial. |
| Testing Measures | Testing calculations across multiple visuals is essential for accuracy. |
For continued learning, explore these resources:
- How to Learn DAX Quickly for Power BI
- QuickStart: Learn DAX Basics in 30 Minutes
- 20 Advanced DAX Secrets For Supercharging Data Models Like A Pro
By practicing and utilizing these resources, you can unlock the full potential of DAX in your data analysis journey.
FAQ
What is DAX used for?
DAX is used for creating custom calculations in data analysis tools like Power BI and Excel. It helps you perform complex calculations across entire datasets, enhancing your reporting capabilities.
How can I learn DAX effectively?
You can learn DAX effectively by following a structured dax guide. Start with basic concepts, practice regularly, and explore resources like online courses and tutorials to deepen your understanding.
What are calculated columns in DAX?
Calculated columns are new columns you create in your data model using DAX formulas. They evaluate expressions for each row in a table, allowing you to add custom data to your analysis.
What is the difference between measures and calculated columns?
Measures are dynamic calculations evaluated based on the context of your report. Calculated columns, however, are static and stored in memory, evaluated for each row in a table.
Can I use DAX in Excel?
Yes, you can use DAX in Excel through Power Pivot. It allows you to create powerful calculations that enhance your data analysis and reporting capabilities within Excel.
What are some common DAX functions?
Common DAX functions include SUM, AVERAGE, CALCULATE, and FILTER. These functions help you perform various calculations and data manipulations in your reports.
How does DAX handle data types?
DAX supports several data types, including numeric, string, and date. Understanding these types is crucial for effective calculations and avoiding errors in your DAX formulas.
Is DAX similar to Excel formulas?
Yes, DAX is similar to Excel formulas but operates on a broader scale. It allows for complex calculations across entire tables, making it more powerful for data analysis.
🎧 Listen to this episode
Want a practical explanation of Data Analysis Expressions (DAX)? This episode breaks down the topic in clear language and shows why it matters for Microsoft 365, Azure, Power Platform, security, AI, and modern work. For a comprehensive audio dive, tune into Data Analysis Expressions (DAX) - Simply Explained.
Listen to this episode if you want to:
- Understand the key concepts behind Data Analysis Expressions (DAX)
- See how it fits into the wider Microsoft technology ecosystem
- Learn where it can create practical value for your organization
You may also enjoy these related M365 FM episodes:
- Microsoft Graph Data Connect - Simply Explained
- From Data to Intelligent Agents: Building Trusted Enterprise AI with Microsoft AI Foundry with Shubhangi Goyal [MVP]
- How Microsoft Graph Connects Microsoft 365 Data and Context
- AI Agents and the End of Manual Data Entry
- Private RAG Security: Authorization-Aware Data Retrieval
Discover more practical Microsoft conversations on M365 FM.
Last reviewed: July 2026.
Who Should Listen
This episode is for Microsoft administrators, architects, developers, security professionals, and business leaders who need a practical foundation before making implementation or governance decisions.
🎧 You Should Also Listen To
- Microsoft Fabric — A closely related next step that adds useful context and practical depth.
- Microsoft Fabric OneLake — A closely related next step that adds useful context and practical depth.
- Power BI Copilot — A closely related next step that adds useful context and practical depth.

Microsoft MVP | Host of M365.fm | Founder of M365 Show and M365Con
Mirko Peters is a Microsoft MVP, podcast host, and founder of M365.fm, M365 Show, and M365Con. His work connects Microsoft practitioners through podcast interviews, livestreams, and community events.
At M365.fm, Mirko hosts conversations with Microsoft MVPs, product experts, architects, and community contributors. Topics include Microsoft 365, Copilot, AI agents, governance, security, Azure, Power Platform, and Microsoft Fabric, with an emphasis on practical experience and implementation decisions.
M365.fm is the podcast and learning platform. M365 Show brings experts together for livestreams, while M365Con provides an online conference setting for community learning.
Official website: Mirko Peters (https://www.mirkopeters.com/). Recognition: Mirko Peters — Microsoft MVP profile (https://mvp.microsoft.com/de-DE/mvp/profile/9b0ca797-db5a-493a-a845-8b9158046cf5). Connect on LinkedIn (https://www.linkedin.com/in/m365showpodcast/).