


 Apple Podcasts
 Spotify
 Youtube Music
 Spreaker
 Podchaser
 Amazon Music
 Data Analysis Expressions (DAX) - Simply Explained
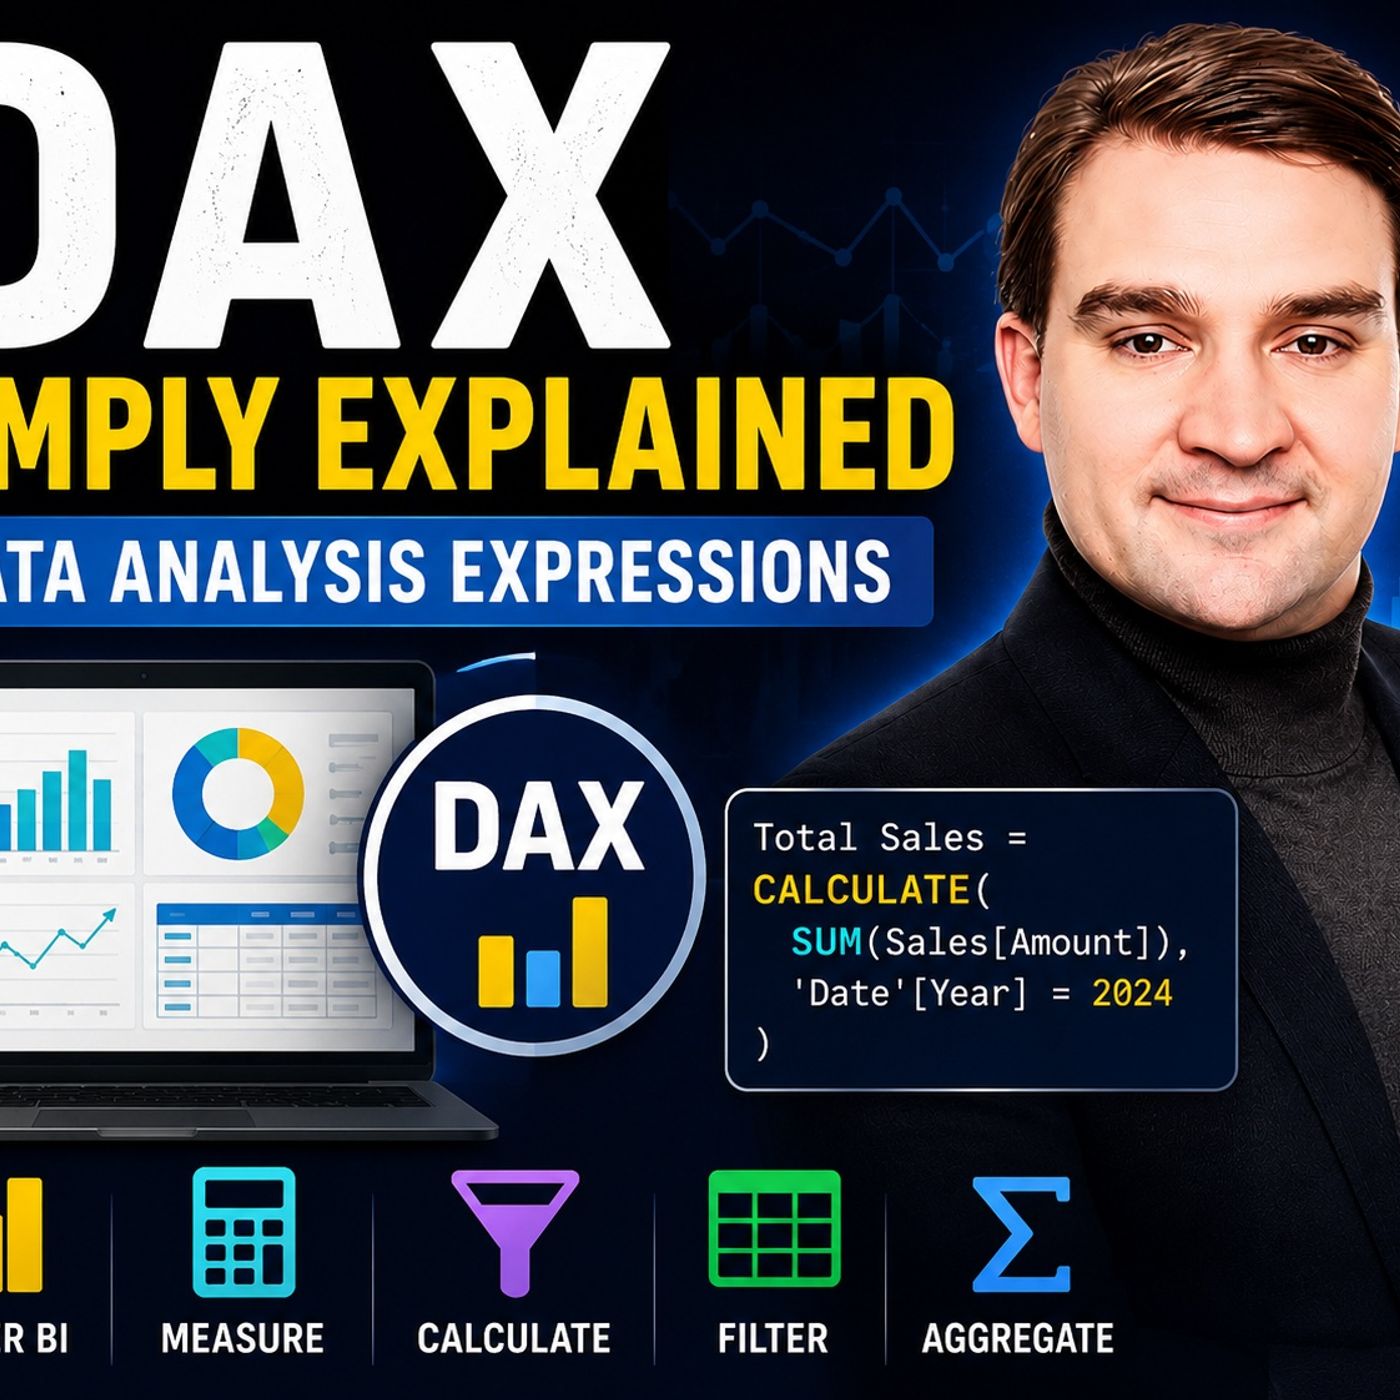
Data Analysis Expressions, better known as DAX, is the calculation language that powers Microsoft Power BI, Excel Power Pivot, and SQL Server Analysis Services. In this episode of the M365 FM Podcast, Mirko Peters explains DAX in plain English and shows why it is much more than simply using Excel formulas inside Power BI.
The episode explores how DAX works across complete tables and data models rather than individual spreadsheet cells. You’ll learn the important difference between calculated columns and measures: calculated columns are created during data refresh and remain static, while measures recalculate dynamically whenever users apply filters, select slicers, or interact with a report.
Another central topic is filter context, which determines which data is included in every calculation. The episode explains how one DAX measure can automatically display the correct result across different regions, products, dates, and report visuals. It also introduces essential concepts and functions including CALCULATE, SUMX, row context, variables, date tables, running totals, year-over-year comparisons, and time intelligence.
The discussion also covers performance and maintainability, explaining why clean data models, efficient relationships, reusable measures, and simple formulas are essential for scalable Power BI solutions. Whether you are building your first dashboard or improving enterprise reporting, this episode provides a practical introduction to the core DAX concepts needed to create fast, interactive, and reliable business intelligence reports.
Quick answer: DAX in Power BI is the focus of this M365 FM episode, which explains what it does, where it fits in the Microsoft ecosystem, and the architecture, security, governance, or operational choices that matter before teams adopt or manage it.
Data Analysis Expressions (DAX) is a powerful formula language that enables you to perform complex data analysis. It plays a crucial role in transforming raw data into actionable insights. By mastering DAX, you can create dynamic reports that respond instantly to user inputs.
You will benefit from understanding DAX if you aim to enhance your reporting capabilities. Whether you are a beginner or a seasoned professional, grasping DAX concepts will help you unlock deeper insights and improve your data analysis skills.
Here are some key benefits of adopting DAX:
- Powerful Data Analysis
- Data Relationships and Filtering
- Time Intelligence Functions
- Enhanced Reporting
- Data Modeling Flexibility
- Optimized Performance
- Conditional Logic
- Handling Complex Data
Key Takeaways
- DAX is a powerful formula language for data analysis, enabling complex calculations across entire datasets.
- Mastering DAX enhances your reporting capabilities, allowing for dynamic and interactive reports that respond to user inputs.
- Understanding DAX syntax and data types is crucial for effective data analysis and avoiding common errors.
- DAX offers various functions, including aggregation, filtering, and time intelligence, to derive meaningful insights from data.
- Using DAX in Power BI and Excel allows for advanced calculations that reflect business complexity and improve decision-making.
- Debugging DAX formulas can be challenging; testing measures in multiple contexts helps ensure accuracy.
- Optimizing DAX performance is essential; strategies include minimizing calls to the storage engine and using variables for efficiency.
- Continuous learning and practice with DAX resources can unlock its full potential in your data analysis journey.
DAX Overview

What Is DAX?
Data Analysis Expressions, or DAX, is a formula language designed specifically for data analysis. You can use DAX to create custom calculations in tools like Power BI, Excel Power Pivot, and SQL Server Analysis Services. This language allows you to perform complex calculations across entire tables, rather than just individual cells. By leveraging DAX, you can transform raw data into meaningful insights that drive business decisions.
DAX operates similarly to Excel formulas but offers much more power. It enables you to create dynamic reports that respond to user inputs, such as filters and slicers. This capability is essential for interactive data analysis. As you become familiar with DAX, you will find that it provides advanced calculations and dynamic aggregations, setting it apart from other data analysis languages.
DAX Language Features
The DAX language has evolved significantly since its introduction. Below is a brief overview of its development:
| Year | Development Description |
|---|---|
| 2009 | DAX introduced with PowerPivot for Excel 2010 Add-in. |
| 2016 | Significant improvements with the adoption of Power BI and SQL Server 2016, including enhancements to DAX such as calculated tables and variables. |
| 2016 | Total number of functions in DAX reached 340. |
DAX is a functional programming language tailored for Business Intelligence tools. Its syntax resembles both SQL and Excel, focusing on tables, aggregations, and joins. You will notice that DAX emphasizes querying tables joined by relationships and aggregated values.
The most dangerous thing with DAX is that you can write things that work, long before you understand what is happening behind the scenes.
This quote highlights the importance of understanding the underlying mechanics of DAX. As you learn, you will discover that DAX provides unique features that enhance your data analysis capabilities. For instance, you can create calculated columns, measures, and tables, allowing for detailed and customized data analysis.
DAX Functionality
DAX Syntax Basics
When you write DAX formulas, you must follow specific syntax rules to ensure they work correctly. Here are some essential rules to keep in mind:
- All tables must have unique names.
- Column names must be unique within each table.
- Object names are case-insensitive.
- Use fully qualified names in certain contexts, such as when using functions like VALUES, ALL, or CALCULATE.
- Enclose table names in single quotation marks if they contain spaces or special characters.
- Measure names must always be in brackets and can contain spaces.
- You can reference column names without the base table unless there is a name conflict.
DAX formulas cannot modify or insert individual values in tables. Instead, you can create calculated columns and measures. DAX automatically identifies data types and performs implicit conversions, making it easier for you to work with your data.
Data Types in DAX
Understanding data types in DAX is crucial for effective data analysis. DAX supports several data types, and each type impacts calculations differently. Here’s a summary of the key aspects of data types in DAX:
| Aspect | Description |
|---|---|
| Data Type Independence | The VertiPaq engine operates independently of data types. Different types (string, floating point, date) use similar memory and perform at comparable speeds due to dictionary encoding. |
| Impact of Mixed Data Types | Mixing data types in expressions can lead to necessary conversions, which may affect performance. Some conversions are efficient, while others require more resources from the formula engine, impacting overall calculation speed. |
| Conversion Errors | Errors can arise during data type conversions, particularly between fixed decimals and floating points, due to differences in precision. Developers must be cautious to minimize errors during conversions. |
| Performance Considerations | Mathematical operations may require callbacks to the formula engine, which can slow down performance. Ensuring consistent and minimal error during calculations is crucial for maintaining accuracy in results. |
DAX interacts seamlessly with data models in Power BI and Excel. You can create custom measures that enhance your visualizations, allowing for dynamic data analysis based on various fields. Additionally, DAX enables the creation of virtual tables from related or unrelated tables, providing flexibility in data manipulation.
By mastering DAX syntax and understanding data types, you can unlock the full potential of data analysis expressions. This knowledge allows you to create powerful formulas that drive insightful reporting and analysis.
Key Data Analysis Expressions
Aggregation Functions
Aggregation functions in DAX allow you to summarize data effectively. These functions help you calculate totals, averages, and other statistical measures across your datasets. Here are some of the most frequently used aggregation functions and their typical applications:
| Function | Definition | Typical Application |
|---|---|---|
| SUM | Combines values in a column to yield a total sum. | Calculating total revenue from a sales table. |
| MIN | Finds the smallest numeric value in a column. | Identifying the lowest sale amount in a dataset. |
| MINX | Calculates the minimum value of an expression per row. | Finding the lowest total sales by region. |
| COUNT | Counts non-blank values in a specified column. | Counting the number of sales transactions recorded. |
| COUNTA | Counts all non-blank values regardless of type. | Counting active employees in a boolean column. |
| COUNTROWS | Counts the number of rows in a table or expression. | Counting rows resulting from a filtered employee table. |
| DISTINCTCOUNT | Identifies the number of unique values in a column. | Counting unique products sold in a sales dataset. |
These aggregation functions are essential for performing data analysis expressions. They allow you to derive insights from your data, such as total revenue or the number of transactions. By using these functions, you can create meaningful reports that highlight key performance indicators.
Filter Functions
Filter functions in DAX enhance your ability to analyze data by applying conditions to your calculations. The DAX FILTER function, for example, efficiently handles filtering, applies conditional logic, and dynamically adjusts calculations. This capability empowers you to build measures that respond to slicers and page filters. Here are some key points about filter functions:
- They enable dynamic and context-aware calculations.
- They allow for complex filters to be applied to data.
- They facilitate sophisticated measures that respond to user interactions.
Using filter functions, you can perform robust data analysis, uncover valuable insights, and manage filters dynamically. This flexibility is crucial for creating interactive reports that adapt to user inputs.
Time Intelligence Functions
Time intelligence functions in DAX allow you to analyze data over time. These functions help you track performance across different periods, such as months, quarters, and years. Here are some key time intelligence functions and their descriptions:
| Function | Description |
|---|---|
| CLOSINGBALANCEMONTH | Evaluates the specified expression for the date corresponding to the end of the current month after applying specified filters. |
| CLOSINGBALANCEQUARTER | Evaluates the specified expression for the date corresponding to the end of the current quarter after applying specified filters. |
| CLOSINGBALANCEYEAR | Evaluates the specified expression for the date corresponding to the end of the current year after applying specified filters. |
| DATEADD | Moves the given set of dates by a specified interval. |
| DATESBETWEEN | Returns the dates between two given dates. |
| DATESYTD | Returns a set of dates in the year up to the last date visible in the filter context. |
These functions allow you to compare performance across years, quarters, and months. You can track Year-to-Date (YTD), Quarter-to-Date (QTD), and Month-to-Date (MTD) progress instantly. By leveraging time intelligence functions, you can build rolling KPIs and align reporting with real business cycles.
Understanding the differences between calculated columns and measures is also vital. Calculated columns are evaluated for each row and stored in memory. Use them when you need to group calculations or filter data. Measures, on the other hand, are evaluated based on the context of the query and are not stored in memory. They are dynamic and adjust based on the report context. Together, calculated columns and measures enable you to create interactive and insightful reports that respond to user inputs and filter selections.
Practical DAX Applications

DAX in Power BI
DAX plays a vital role in Power BI, enhancing your data analysis capabilities. You can create interactive dashboards that respond to user inputs. In Power BI, reports are multi-page interactive documents. You can edit these reports fully, using DAX measures and detailed visualizations. This flexibility allows you to build custom calculations that adapt based on the context of your data.
Here are some key DAX functions commonly used in Power BI:
| DAX Function | Description |
|---|---|
| SUM() | Adds up values in a column |
| CALCULATE() | Modifies filter context dynamically |
| FILTER() | Returns a subset of data |
| IF() | Implements conditional logic |
For example, you might use the CALCULATE function to create a measure that calculates total sales for the previous year. This dynamic calculation helps you track performance over time. By leveraging DAX, you can create reports that not only display data but also provide insights that drive business decisions.
DAX in Excel
In Excel, DAX enhances your data analysis through Power Pivot. While Excel formulas apply directly to cells, DAX operates on entire datasets. This difference allows for more dynamic calculations. You can create custom calculations that reference entire columns, making your analysis more robust.
DAX in Excel focuses on individual cell references. You can see immediate results in your spreadsheets. However, DAX measures adapt based on the context of your report visuals. This adaptability is crucial for creating insightful reports.
Here are some examples of DAX formulas commonly used in Excel projects:
| DAX Function | Description | Example |
|---|---|---|
| CALCULATE() | Modifies filter context for dynamic calculations. | Total Sales (Last Year) = CALCULATE(SUM(Sales[Revenue]), SAMEPERIODLASTYEAR(Date[Date])) |
| FILTER() | Allows complex row-level filtering. | High Value Sales = CALCULATE(SUM(Sales[Revenue]), FILTER(Sales, Sales[Revenue] > 10000)) |
| SWITCH() | Implements conditional logic for KPIs. | Performance Status = SWITCH(TRUE(), [Sales] > 1000000, "Excellent", [Sales] > 500000, "Good", "Needs Improvement") |
By mastering DAX in both Power BI and Excel, you can unlock the full potential of your data analysis. You will find that DAX enables advanced calculations that reflect business complexity. This capability allows you to create reports that are not only informative but also actionable.
Common DAX Challenges
Debugging DAX Formulas
Debugging DAX formulas can be challenging, especially for beginners. You may encounter various errors that hinder your progress. Here are some common errors you might face:
- Syntactic errors: Missing parentheses or commas can lead to confusion.
- Semantic errors: References to non-existing columns, tables, or functions often cause issues.
- Calculation errors: Type mismatches or incorrect arguments passed to functions can yield unexpected results.
To effectively debug your DAX formulas, consider using the following tools and techniques:
- EVALUATEANDLOG function: This function allows you to log intermediate results in DAX expressions. It helps trace and resolve logic issues.
- DAX Studio: An open-source application that facilitates the creation, execution, and analysis of DAX queries. It provides performance monitoring capabilities.
When debugging, avoid starting with syntax alone. Instead, test measures in multiple visuals to ensure they work correctly across different contexts. This approach helps you identify issues more effectively.
Performance Optimization Tips
Optimizing DAX performance is crucial for maintaining efficient reports. Here are some strategies to enhance your DAX queries:
- Shift Load to the Storage Engine (SE): Delegate computation to the SE whenever possible. This shift is vital for optimizing performance.
- Reduce the Number of Calls to the Storage Engine (SE): Structure queries to retrieve larger batches of data. This minimizes separate SE calls.
- Minimize Dependency on the Formula Engine (FE): Avoid functions that force row-by-row evaluations. This practice prevents bottlenecks.
- Optimize Data Model Design: Efficient data models reduce cardinality and improve performance.
- Use Aggregated Tables: Pre-aggregated summary tables reduce computational overhead and avoid repeated calculations.
- Leverage Caching: Optimize measure definitions to take advantage of caching mechanisms for faster query execution.
- Optimize Use of FILTER and Iterators: Direct column filtering is more efficient than using row-by-row evaluations.
- Avoid Large Many-to-Many Relationships: Simplifying relationships reduces computational complexity.
- Use Variables (VAR): Store intermediate results to prevent redundant calculations.
- Optimize Time Intelligence Functions: Use precomputed aggregated time-based tables for better performance.
Be cautious with common DAX patterns that hurt performance. Excessive use of ALL or REMOVEFILTERS can lead to unnecessary full table scans. Instead, consider using ALLEXCEPT to maintain necessary filters. Additionally, overcomplicating logic can slow down execution; simpler expressions are often more efficient.
By addressing these common challenges, you can enhance your DAX skills and create more efficient reports that deliver valuable insights.
Mastering DAX enhances your data analysis skills and empowers you to create insightful reports. You learned about DAX's unique features, syntax, and key functions. Understanding DAX allows you to perform complex calculations and build dynamic reports that respond to user inputs.
To deepen your knowledge, consider these key takeaways:
| Key Takeaway | Description |
|---|---|
| Understanding DAX | DAX behaves differently from Excel and SQL, requiring a different approach. |
| Avoid Memorization | Relying on memorization can lead to confusion; understanding context is crucial. |
| Testing Measures | Testing calculations across multiple visuals is essential for accuracy. |
For continued learning, explore these resources:
- How to Learn DAX Quickly for Power BI
- QuickStart: Learn DAX Basics in 30 Minutes
- 20 Advanced DAX Secrets For Supercharging Data Models Like A Pro
By practicing and utilizing these resources, you can unlock the full potential of DAX in your data analysis journey.
FAQ
What is DAX used for?
DAX is used for creating custom calculations in data analysis tools like Power BI and Excel. It helps you perform complex calculations across entire datasets, enhancing your reporting capabilities.
How can I learn DAX effectively?
You can learn DAX effectively by following a structured dax guide. Start with basic concepts, practice regularly, and explore resources like online courses and tutorials to deepen your understanding.
What are calculated columns in DAX?
Calculated columns are new columns you create in your data model using DAX formulas. They evaluate expressions for each row in a table, allowing you to add custom data to your analysis.
What is the difference between measures and calculated columns?
Measures are dynamic calculations evaluated based on the context of your report. Calculated columns, however, are static and stored in memory, evaluated for each row in a table.
Can I use DAX in Excel?
Yes, you can use DAX in Excel through Power Pivot. It allows you to create powerful calculations that enhance your data analysis and reporting capabilities within Excel.
What are some common DAX functions?
Common DAX functions include SUM, AVERAGE, CALCULATE, and FILTER. These functions help you perform various calculations and data manipulations in your reports.
How does DAX handle data types?
DAX supports several data types, including numeric, string, and date. Understanding these types is crucial for effective calculations and avoiding errors in your DAX formulas.
Is DAX similar to Excel formulas?
Yes, DAX is similar to Excel formulas but operates on a broader scale. It allows for complex calculations across entire tables, making it more powerful for data analysis.
🎧 Listen to this episode
Want a practical explanation of Data Analysis Expressions (DAX)? This episode breaks down the topic in clear language and shows why it matters for Microsoft 365, Azure, Power Platform, security, AI, and modern work.
Listen to this episode if you want to:
- Understand the key concepts behind Data Analysis Expressions (DAX)
- See how it fits into the wider Microsoft technology ecosystem
- Learn where it can create practical value for your organization
You may also enjoy these related M365 FM episodes:
- Microsoft Graph Data Connect - Simply Explained
- From Data to Intelligent Agents: Building Trusted Enterprise AI with Microsoft AI Foundry with Shubhangi Goyal [MVP]
- How Microsoft Graph Connects Microsoft 365 Data and Context
- AI Agents and the End of Manual Data Entry
- Private RAG Security: Authorization-Aware Data Retrieval
Discover more practical Microsoft conversations on M365 FM.
Last reviewed: July 2026.
Who Should Listen
This episode is for Microsoft administrators, architects, developers, security professionals, and business leaders who need a practical foundation before making implementation or governance decisions.
🎧 You Should Also Listen To
- Microsoft Fabric — A closely related next step that adds useful context and practical depth.
- Microsoft Fabric OneLake — A closely related next step that adds useful context and practical depth.
- Power BI Copilot — A closely related next step that adds useful context and practical depth.
🚀 Want to be part of m365.fm?
Then stop just listening… and start showing up.
👉 Connect with me on LinkedIn and let’s make something happen:
- 🎙️ Be a podcast guest and share your story
- 🎧 Host your own episode (yes, seriously)
- 💡 Pitch topics the community actually wants to hear
- 🌍 Build your personal brand in the Microsoft 365 space
This isn’t just a podcast — it’s a platform for people who take action.
🔥 Most people wait. The best ones don’t.
👉 Connect with me on LinkedIn and send me a message:
"I want in"
Let’s build something awesome 👊
1
00:00:00,000 --> 00:00:03,440
Today's topic is one that almost everyone working with Power BI has heard of,
2
00:00:03,440 --> 00:00:05,400
but hardly anyone can actually explain.
3
00:00:05,400 --> 00:00:06,680
What exactly is DAX?
4
00:00:06,680 --> 00:00:10,080
Is it just Excel formulas inside Power BI or is it something completely different?
5
00:00:10,080 --> 00:00:13,600
Here's the thing, most people think DAX is basically Excel formulas with a different name,
6
00:00:13,600 --> 00:00:14,520
but it isn't.
7
00:00:14,520 --> 00:00:17,360
DAX is a whole different way of thinking about calculations.
8
00:00:17,360 --> 00:00:20,480
If you try to treat it like Excel, you'll end up frustrated and confused,
9
00:00:20,480 --> 00:00:22,520
wondering why your numbers don't add up.
10
00:00:22,520 --> 00:00:26,000
By the end of this episode, you'll know what DAX actually is, why it matters,
11
00:00:26,000 --> 00:00:28,880
and the core concepts you need to start using it with confidence.
12
00:00:28,880 --> 00:00:31,120
Grab your coffee and let's dive in.
13
00:00:31,120 --> 00:00:32,880
What exactly is DAX?
14
00:00:32,880 --> 00:00:35,240
DAX stands for data analysis expressions,
15
00:00:35,240 --> 00:00:39,280
and it's the formula language used inside Power BI, Power Pivot in Excel,
16
00:00:39,280 --> 00:00:41,360
and SQL Server Analysis Services.
17
00:00:41,360 --> 00:00:44,840
Think of it as the engine that powers your calculations behind the scenes.
18
00:00:44,840 --> 00:00:46,120
DAX isn't new.
19
00:00:46,120 --> 00:00:49,800
It's been around since Excel Power Pivot was introduced over a decade ago,
20
00:00:49,800 --> 00:00:54,280
but with Power BI, it's become the go-to language for anyone serious about data analysis.
21
00:00:54,280 --> 00:00:55,600
And here's what makes it different.
22
00:00:55,600 --> 00:00:58,880
In Excel, you write formulas that work with individual cells.
23
00:00:58,880 --> 00:01:02,400
Point to A1, multiply by B1, and you get a result for one cell.
24
00:01:02,400 --> 00:01:03,640
DAX doesn't work that way.
25
00:01:03,640 --> 00:01:05,840
It works with entire tables and columns at once.
26
00:01:05,840 --> 00:01:07,600
You're not calculating one cell at a time.
27
00:01:07,600 --> 00:01:10,960
Instead, you tell the engine, take this whole column of numbers and sum it up,
28
00:01:10,960 --> 00:01:14,320
this or filter this entire table based on this condition.
29
00:01:14,320 --> 00:01:15,520
So how do you picture it?
30
00:01:15,520 --> 00:01:17,600
Imagine your building and office building.
31
00:01:17,600 --> 00:01:20,520
Power BI gives you the structure, the floors, walls, and rooms.
32
00:01:20,520 --> 00:01:21,680
That's your data model.
33
00:01:21,680 --> 00:01:23,240
DAX is the wiring and the plumbing.
34
00:01:23,240 --> 00:01:24,480
It's what makes everything work.
35
00:01:24,480 --> 00:01:28,560
Without DAX, you have a building that looks nice, but has no electricity or running water.
36
00:01:28,560 --> 00:01:32,600
With it, the lights turn on, the faucets work, and your reports actually respond when someone
37
00:01:32,600 --> 00:01:33,800
clicks a slicer.
38
00:01:33,800 --> 00:01:35,560
That responsiveness is the whole point.
39
00:01:35,560 --> 00:01:40,000
DAX lets you create calculations that automatically react to filters and interactions.
40
00:01:40,000 --> 00:01:43,280
Build one measure, and it shows the right number, whether someone's looking at total
41
00:01:43,280 --> 00:01:45,440
sales by region, by product, or by month.
42
00:01:45,440 --> 00:01:46,520
It just works.
43
00:01:46,520 --> 00:01:49,920
But to use it well, you need to understand the two main ways to work with DAX.
44
00:01:49,920 --> 00:01:51,560
Let's break those down.
45
00:01:51,560 --> 00:01:54,880
The two worlds, calculated columns versus measures.
46
00:01:54,880 --> 00:01:59,000
Today we are talking about two building blocks and DAXs, calculated columns and measures.
47
00:01:59,000 --> 00:02:01,200
Most people think they are the same thing, they aren't.
48
00:02:01,200 --> 00:02:03,880
Mixing them up is one of the most common mistakes I see.
49
00:02:03,880 --> 00:02:05,680
A calculated column is static.
50
00:02:05,680 --> 00:02:07,160
It adds a new column to your table.
51
00:02:07,160 --> 00:02:10,000
It fills up during a refresh, and then it sits there.
52
00:02:10,000 --> 00:02:11,960
It doesn't change until the next refresh.
53
00:02:11,960 --> 00:02:13,880
Here's the simplest way to think about it.
54
00:02:13,880 --> 00:02:15,120
Imagine a filing cabinet.
55
00:02:15,120 --> 00:02:18,640
You put a piece of paper in a folder that paper has the customer's full name on it.
56
00:02:18,640 --> 00:02:21,120
It doesn't matter if you look at the file today or next week.
57
00:02:21,120 --> 00:02:22,120
The name is still there.
58
00:02:22,120 --> 00:02:23,120
That is a calculated column.
59
00:02:23,120 --> 00:02:24,840
A measure is completely different.
60
00:02:24,840 --> 00:02:26,080
It doesn't sit in the table.
61
00:02:26,080 --> 00:02:27,720
It lives in the memory of your report.
62
00:02:27,720 --> 00:02:33,080
Every single time someone filters, slices or clicks a visual, the measure wakes up and recalculates.
63
00:02:33,080 --> 00:02:34,080
Why does this matter?
64
00:02:34,080 --> 00:02:38,120
If a user clicks a slicer for the North East region, a measure recalculates instantly.
65
00:02:38,120 --> 00:02:40,280
A calculated column ignores the slicer.
66
00:02:40,280 --> 00:02:41,280
It has to.
67
00:02:41,280 --> 00:02:43,120
It is static.
68
00:02:43,120 --> 00:02:44,280
Here is the simple rule.
69
00:02:44,280 --> 00:02:48,160
If the number needs to change when someone clicks a button, use a measure.
70
00:02:48,160 --> 00:02:51,800
If it is the same no matter what, a calculated column is fine.
71
00:02:51,800 --> 00:02:53,640
Total sales should always be a measure.
72
00:02:53,640 --> 00:02:57,040
If someone filters by region or by month, the total must update.
73
00:02:57,040 --> 00:02:58,280
Customer full name is a column.
74
00:02:58,280 --> 00:02:59,280
It never changes.
75
00:02:59,280 --> 00:03:00,280
A slicer won't touch it.
76
00:03:00,280 --> 00:03:02,320
Now, here is where most beginners get confused.
77
00:03:02,320 --> 00:03:04,280
They create calculated columns for everything.
78
00:03:04,280 --> 00:03:07,040
It feels natural because that is how Excel works.
79
00:03:07,040 --> 00:03:09,000
But overusing columns bloats your model.
80
00:03:09,000 --> 00:03:10,880
Your reports become slow.
81
00:03:10,880 --> 00:03:14,360
Calculated columns create static numbers that ignore your users.
82
00:03:14,360 --> 00:03:16,120
Measures are almost always the better choice.
83
00:03:16,120 --> 00:03:17,120
They are dynamic.
84
00:03:17,120 --> 00:03:18,560
They respond.
85
00:03:18,560 --> 00:03:22,360
Once you understand this difference, you are ready for the real magic of DAX.
86
00:03:22,360 --> 00:03:24,680
That magic is called filter context.
87
00:03:24,680 --> 00:03:26,360
The big idea, filter context.
88
00:03:26,360 --> 00:03:28,280
OK, we have our two building blocks.
89
00:03:28,280 --> 00:03:30,400
Now let's talk about the engine behind them.
90
00:03:30,400 --> 00:03:34,520
Every number you see in a Power BI report is calculated inside something called filter context.
91
00:03:34,520 --> 00:03:36,760
It sounds complicated, but it is simple.
92
00:03:36,760 --> 00:03:40,400
Filter context is just the set of filters active at that exact moment.
93
00:03:40,400 --> 00:03:41,400
Where do those filters come from?
94
00:03:41,400 --> 00:03:42,920
They come from the slices on your page.
95
00:03:42,920 --> 00:03:44,680
They come from the visual you clicked.
96
00:03:44,680 --> 00:03:46,400
They come from the page itself.
97
00:03:46,400 --> 00:03:49,040
And the row you are looking at creates a filter context.
98
00:03:49,040 --> 00:03:50,120
Here is why you should care.
99
00:03:50,120 --> 00:03:53,560
When you write a measure like total sales, you are not telling it to look at the northeast
100
00:03:53,560 --> 00:03:54,880
region in Q3.
101
00:03:54,880 --> 00:03:56,720
You just tell it to add up the sales column.
102
00:03:56,720 --> 00:03:57,720
That is it.
103
00:03:57,720 --> 00:03:59,120
The measure doesn't know about regions.
104
00:03:59,120 --> 00:04:00,600
It doesn't know about quarters.
105
00:04:00,600 --> 00:04:03,440
It just adds up whatever rows are currently visible.
106
00:04:03,440 --> 00:04:06,360
The filter context decides what is visible.
107
00:04:06,360 --> 00:04:07,520
Imagine a spotlight.
108
00:04:07,520 --> 00:04:08,840
Your whole data set is the room.
109
00:04:08,840 --> 00:04:10,560
The filter context is the spotlight.
110
00:04:10,560 --> 00:04:13,720
The measure is a camera taking a picture of exactly what the light hits.
111
00:04:13,720 --> 00:04:15,600
Move the spotlight to the northeast region.
112
00:04:15,600 --> 00:04:17,400
The measure recalculates, move it to Q3.
113
00:04:17,400 --> 00:04:18,560
It recalculates again.
114
00:04:18,560 --> 00:04:19,720
You didn't change the formula.
115
00:04:19,720 --> 00:04:21,080
The context changed.
116
00:04:21,080 --> 00:04:22,640
This confuses most people.
117
00:04:22,640 --> 00:04:23,640
They write a measure.
118
00:04:23,640 --> 00:04:25,080
It looks right in one visual.
119
00:04:25,080 --> 00:04:28,680
Then they put it in a matrix with different filters and the number changes.
120
00:04:28,680 --> 00:04:30,040
They think something is broken.
121
00:04:30,040 --> 00:04:31,040
It is not broken.
122
00:04:31,040 --> 00:04:32,840
That is exactly what a measure is supposed to do.
123
00:04:32,840 --> 00:04:33,840
It is dynamic.
124
00:04:33,840 --> 00:04:34,840
This is the real power.
125
00:04:34,840 --> 00:04:38,520
You write one formula and it works for every possible filter combination in your entire
126
00:04:38,520 --> 00:04:39,520
report.
127
00:04:39,520 --> 00:04:40,520
One formula.
128
00:04:40,520 --> 00:04:41,520
Infinite answers.
129
00:04:41,520 --> 00:04:42,880
But you must be careful.
130
00:04:42,880 --> 00:04:45,960
If you don't know what filters are active, you won't understand your number.
131
00:04:45,960 --> 00:04:47,400
You need to trace the spotlight.
132
00:04:47,400 --> 00:04:51,280
Get comfortable with filter context and you unlock the real power of DAX.
133
00:04:51,280 --> 00:04:53,160
And that brings us to the star of the show.
134
00:04:53,160 --> 00:04:54,480
The Calculate function.
135
00:04:54,480 --> 00:04:55,800
The most important function.
136
00:04:55,800 --> 00:04:56,800
Calculate.
137
00:04:56,800 --> 00:04:57,800
Welcome back.
138
00:04:57,800 --> 00:05:00,880
Today's knowledge nugget is about the single most important function in DAX.
139
00:05:00,880 --> 00:05:02,080
It's called Calculate.
140
00:05:02,080 --> 00:05:05,240
If you only master one function, make it this one.
141
00:05:05,240 --> 00:05:06,240
Calculate.
142
00:05:06,240 --> 00:05:09,880
Let's you control filter context instead of just accepting whatever filters are active.
143
00:05:09,880 --> 00:05:11,080
Here's how normal measures work.
144
00:05:11,080 --> 00:05:14,680
When you write a measure, it respects the current filter context automatically.
145
00:05:14,680 --> 00:05:19,000
If someone selects 2024 from a slicer, your measure shows 2024 numbers.
146
00:05:19,000 --> 00:05:21,920
If they choose the northeast region, it shows northeast numbers.
147
00:05:21,920 --> 00:05:24,320
The measure responds to whatever filters are in play.
148
00:05:24,320 --> 00:05:25,320
No extra work needed.
149
00:05:25,320 --> 00:05:26,640
That's the default behavior.
150
00:05:26,640 --> 00:05:29,720
But what if you need a number that ignores the current filters?
151
00:05:29,720 --> 00:05:34,360
Maybe you want total sales for all regions right next to sales for the selected region?
152
00:05:34,360 --> 00:05:37,480
Or you need last year's sales while someone is looking at this year.
153
00:05:37,480 --> 00:05:39,720
In those cases, you can't rely on the default context.
154
00:05:39,720 --> 00:05:40,720
You need to modify it.
155
00:05:40,720 --> 00:05:42,200
That's exactly what Calculate does.
156
00:05:42,200 --> 00:05:44,960
Calculate works by temporarily changing the filter context.
157
00:05:44,960 --> 00:05:49,160
You give it an expression to calculate and then you give it one or more filters to apply.
158
00:05:49,160 --> 00:05:52,520
It changes the context, runs the calculation and returns the result.
159
00:05:52,520 --> 00:05:54,520
The original filter context stays untouched.
160
00:05:54,520 --> 00:05:55,520
That's the magic.
161
00:05:55,520 --> 00:05:56,760
The syntax is simple.
162
00:05:56,760 --> 00:06:01,040
You write calculate, expression, filter one, filter two.
163
00:06:01,040 --> 00:06:03,440
The expression is usually a measure you've already created.
164
00:06:03,440 --> 00:06:05,800
The filters are the conditions you want to apply.
165
00:06:05,800 --> 00:06:07,920
You can add as many filters as you need.
166
00:06:07,920 --> 00:06:08,920
Let's see it in action.
167
00:06:08,920 --> 00:06:10,960
Suppose you have a measure called total sales.
168
00:06:10,960 --> 00:06:12,760
It shows sales for the selected period.
169
00:06:12,760 --> 00:06:15,880
To show sales for the same period last year, you write calculate.
170
00:06:15,880 --> 00:06:18,600
Total sales, same period last year calendar date.
171
00:06:18,600 --> 00:06:19,600
That's all it takes.
172
00:06:19,600 --> 00:06:23,400
Calculate takes your existing measure and shifts the date context back one year.
173
00:06:23,400 --> 00:06:25,120
You get the comparison you need in one line.
174
00:06:25,120 --> 00:06:28,840
Without calculate, you're stuck with whatever filter context exists.
175
00:06:28,840 --> 00:06:32,760
With Calculate, you can override filters, add new ones, or remove existing ones.
176
00:06:32,760 --> 00:06:36,600
You can request total sales for all products even when someone filters to a specific category.
177
00:06:36,600 --> 00:06:39,800
You can pull sales from last month when the report shows this month.
178
00:06:39,800 --> 00:06:41,240
The control is in your hands.
179
00:06:41,240 --> 00:06:44,080
About 80% of advanced DAX relies on calculate.
180
00:06:44,080 --> 00:06:48,080
Time intelligence, dynamic comparisons, custom aggregations, running totals, they all
181
00:06:48,080 --> 00:06:49,840
use calculate under the hood.
182
00:06:49,840 --> 00:06:53,800
Getting comfortable with this single function gives you enormous power over your reports.
183
00:06:53,800 --> 00:06:55,880
But calculate works at the filter level.
184
00:06:55,880 --> 00:06:58,000
What about row by row logic inside a measure?
185
00:06:58,000 --> 00:07:00,400
That's where a different set of functions comes in.
186
00:07:00,400 --> 00:07:03,240
Iterator functions when you need to think row by row.
187
00:07:03,240 --> 00:07:05,600
So calculate handles filter level changes beautifully.
188
00:07:05,600 --> 00:07:09,680
Sometimes you need to step inside a table and compute on each row individually inside a
189
00:07:09,680 --> 00:07:10,680
measure.
190
00:07:10,680 --> 00:07:11,720
A simple sum can't do that.
191
00:07:11,720 --> 00:07:14,440
You need something that walks through the table row by row.
192
00:07:14,440 --> 00:07:15,800
Here's a common situation.
193
00:07:15,800 --> 00:07:19,200
You have a sales table with quantity and unit price in separate columns.
194
00:07:19,200 --> 00:07:20,920
You want a measure that shows total revenue.
195
00:07:20,920 --> 00:07:24,080
You can't just multiply some quantity by some unit price.
196
00:07:24,080 --> 00:07:26,800
That multiplies the totals, not the individual rows.
197
00:07:26,800 --> 00:07:31,640
You need to multiply each row's quantity by its unit price, then add up all those results.
198
00:07:31,640 --> 00:07:34,520
That's row by row math.
199
00:07:34,520 --> 00:07:36,200
Operator functions are built for this.
200
00:07:36,200 --> 00:07:41,920
They're the functions that end in x, SUMX, average x, count x, minx, max.
201
00:07:41,920 --> 00:07:43,600
The x stands for expression.
202
00:07:43,600 --> 00:07:47,720
These functions take a table, walk through every single row, perform a calculation on each
203
00:07:47,720 --> 00:07:50,800
row, and then aggregate the results into a single value.
204
00:07:50,800 --> 00:07:56,840
For the revenue example, you write SUMX, sales, sales quantity, sales unit price.
205
00:07:56,840 --> 00:07:59,600
The first argument is the table to iterate over.
206
00:07:59,600 --> 00:08:02,960
The second argument is the expression to evaluate on each row.
207
00:08:02,960 --> 00:08:07,640
SUMX goes row by row, multiplies quantity times price, and sums everything up.
208
00:08:07,640 --> 00:08:11,560
One measure gives you the correct total revenue, simple and direct.
209
00:08:11,560 --> 00:08:16,000
Use iterators whenever your calculation involves multiple columns from the same row.
210
00:08:16,000 --> 00:08:19,520
Profit per line item, discounted price, weighted scores.
211
00:08:19,520 --> 00:08:24,080
Anytime the math requires row by row logic inside a measure, an iterator is your tool, but
212
00:08:24,080 --> 00:08:25,680
iterators have a performance cost.
213
00:08:25,680 --> 00:08:29,920
They walk through every row, so overusing them on tables with millions of rows can slow
214
00:08:29,920 --> 00:08:31,680
your reports to a crawl.
215
00:08:31,680 --> 00:08:35,760
The simple rule only uses an iterator when you actually need row by row logic.
216
00:08:35,760 --> 00:08:39,240
If a simple sum or average gives you the right answer, use that instead.
217
00:08:39,240 --> 00:08:40,480
Your reports will thank you.
218
00:08:40,480 --> 00:08:41,480
One more tip.
219
00:08:41,480 --> 00:08:45,520
Sometimes a calculated column plus a simple sum is faster than SUMX.
220
00:08:45,520 --> 00:08:49,480
If you create a calculated column that does the row level math once at refresh time and
221
00:08:49,480 --> 00:08:53,760
then use a regular sum on that column, you avoid paying the iterator cost every time someone
222
00:08:53,760 --> 00:08:55,320
views the report.
223
00:08:55,320 --> 00:08:57,280
Test both approaches in your own data.
224
00:08:57,280 --> 00:09:01,120
The fastest option depends on your model size and how often the data changes.
225
00:09:01,120 --> 00:09:02,120
Use wisely.
226
00:09:02,120 --> 00:09:03,600
Time intelligence made simple.
227
00:09:03,600 --> 00:09:08,280
Now let's talk about one of the most requested features in Power BI, comparing time periods.
228
00:09:08,280 --> 00:09:10,560
How are sales this month compared to last month?
229
00:09:10,560 --> 00:09:12,720
How's the year tracking against last year?
230
00:09:12,720 --> 00:09:15,280
These questions come up in almost every business report.
231
00:09:15,280 --> 00:09:17,600
And DAX has functions built just for that.
232
00:09:17,600 --> 00:09:22,080
Time intelligence functions handle year-to-day totals, same period last year, rolling averages
233
00:09:22,080 --> 00:09:23,920
and month over month changes.
234
00:09:23,920 --> 00:09:28,080
They're part of DAX, so you don't have to write complex filter logic from scratch, but
235
00:09:28,080 --> 00:09:29,320
here's the catch.
236
00:09:29,320 --> 00:09:32,000
Time intelligence functions need a proper date table.
237
00:09:32,000 --> 00:09:35,600
Not just any date column from your fact table, you need a separate table with one row per
238
00:09:35,600 --> 00:09:40,080
day covering your full date range with no gaps and it has to be marked as a date table
239
00:09:40,080 --> 00:09:41,080
in your model.
240
00:09:41,080 --> 00:09:44,120
Skip that step and the functions simply won't work.
241
00:09:44,120 --> 00:09:48,560
Once you have that date table set up, the most useful functions are totaly TD, SAMHIPERIOD,
242
00:09:48,560 --> 00:09:50,800
last year, data and dates between.
243
00:09:50,800 --> 00:09:51,960
Total ITD is the simplest.
244
00:09:51,960 --> 00:09:54,760
You write total ITD, total sales, calendar date.
245
00:09:54,760 --> 00:09:58,840
And you get a running total from the start of the year through whatever date is in context.
246
00:09:58,840 --> 00:10:02,640
Keep it in a line chart by month and you'll see that cumulative total grow as the year goes
247
00:10:02,640 --> 00:10:03,640
on.
248
00:10:03,640 --> 00:10:05,800
Same period last year does exactly what it sounds like.
249
00:10:05,800 --> 00:10:09,720
It shifts the date context back one year, you pair it with calculate like this.
250
00:10:09,720 --> 00:10:13,520
Calculate, total sales, same period last year calendar date.
251
00:10:13,520 --> 00:10:17,760
Now you have last year's sales sitting right next to this year's numbers for easy comparison.
252
00:10:17,760 --> 00:10:19,000
That add is even more flexible.
253
00:10:19,000 --> 00:10:22,040
It lets you shift by days, months, quarters or years.
254
00:10:22,040 --> 00:10:26,000
You can compare this quarter to the same quarter two years ago or see last month's numbers
255
00:10:26,000 --> 00:10:27,600
by using minus one month.
256
00:10:27,600 --> 00:10:29,760
That's the Swiss Army knife of time shifting.
257
00:10:29,760 --> 00:10:32,720
The most common mistake people make is forgetting to mark their date table.
258
00:10:32,720 --> 00:10:36,720
You can have a perfect date table with every day from 2020 through 2030.
259
00:10:36,720 --> 00:10:40,680
But if you don't mark it as a date table in the model, the functions will return errors
260
00:10:40,680 --> 00:10:41,680
or blanks.
261
00:10:41,680 --> 00:10:42,680
It's a simple setting.
262
00:10:42,680 --> 00:10:45,640
Right click the table, choose Mark as date table and pick the date column.
263
00:10:45,640 --> 00:10:47,520
Do that once and everything starts working.
264
00:10:47,520 --> 00:10:51,760
Another mistake is using time intelligence functions on a date column inside your fact table
265
00:10:51,760 --> 00:10:53,760
instead of a dedicated date table.
266
00:10:53,760 --> 00:10:58,520
The functions expect a continuous gap free date range and fact tables almost never have that.
267
00:10:58,520 --> 00:11:03,240
So build a proper date table, market and your time intelligence will work smoothly.
268
00:11:03,240 --> 00:11:04,680
Common beginner pitfalls.
269
00:11:04,680 --> 00:11:07,720
Even with the right functions, beginners still hit common traps.
270
00:11:07,720 --> 00:11:10,880
Let me walk you through the biggest ones so you can avoid them from day one.
271
00:11:10,880 --> 00:11:15,040
The number one source of bugs and daxes is confusing row context with filter context.
272
00:11:15,040 --> 00:11:19,240
Earlier we talked about how calculated columns create row context, evaluating one row at
273
00:11:19,240 --> 00:11:23,360
a time while measures use filter context based on whatever filters are active.
274
00:11:23,360 --> 00:11:27,400
beginners often write a measure as if it has access to individual rows, then wonder why
275
00:11:27,400 --> 00:11:28,880
the results are wrong.
276
00:11:28,880 --> 00:11:32,800
If your measure needs to see individual rows, use an iterator function.
277
00:11:32,800 --> 00:11:34,280
If not, keep it simple.
278
00:11:34,280 --> 00:11:37,920
The second big mistake is using calculated columns when a measure would work.
279
00:11:37,920 --> 00:11:40,920
Calculated columns feel familiar because you can see the values in the table.
280
00:11:40,920 --> 00:11:45,520
But every calculated column makes your model larger and refreshes slower.
281
00:11:45,520 --> 00:11:49,080
Before adding one, ask yourself, does this value need to change when someone filters the
282
00:11:49,080 --> 00:11:50,080
report?
283
00:11:50,080 --> 00:11:51,640
If yes, it should be a measure.
284
00:11:51,640 --> 00:11:53,880
Another trap is ignoring the data model itself.
285
00:11:53,880 --> 00:11:55,160
Dax doesn't work in isolation.
286
00:11:55,160 --> 00:11:57,920
It depends on the relationships between your tables.
287
00:11:57,920 --> 00:12:02,760
If your model has weak relationships, wrong cardinality or missing join keys, your dax formulas
288
00:12:02,760 --> 00:12:03,760
will fail silently.
289
00:12:03,760 --> 00:12:06,280
You'll get numbers that look plausible but are actually wrong.
290
00:12:06,280 --> 00:12:07,520
The fix isn't better, dax.
291
00:12:07,520 --> 00:12:08,680
Fix your model first.
292
00:12:08,680 --> 00:12:10,560
Then there's misusing calculate.
293
00:12:10,560 --> 00:12:14,280
Beginners add multiple filters inside calculate without realizing they might cancel each
294
00:12:14,280 --> 00:12:15,400
other out.
295
00:12:15,400 --> 00:12:20,040
For example, a filter for sales for 2024 and another for sales from last year conflict,
296
00:12:20,040 --> 00:12:21,840
and the result won't be what you expect.
297
00:12:21,840 --> 00:12:24,480
Each filter inside calculate should have a clear purpose.
298
00:12:24,480 --> 00:12:27,800
If you're not sure what it's doing, test it in isolation first.
299
00:12:27,800 --> 00:12:30,360
One more common mistake is not using variables.
300
00:12:30,360 --> 00:12:34,040
Variables declared with VR are let you store intermediate results and reuse them later
301
00:12:34,040 --> 00:12:35,360
in the same measure.
302
00:12:35,360 --> 00:12:38,920
Without them, you repeat the same calculation multiple times in one formula, making your
303
00:12:38,920 --> 00:12:41,760
code harder to read, harder to debug and slower to run.
304
00:12:41,760 --> 00:12:43,520
Get in the habit of using VR early.
305
00:12:43,520 --> 00:12:47,240
It will save you hours of frustration and finally always validate your measures in different
306
00:12:47,240 --> 00:12:48,240
contexts.
307
00:12:48,240 --> 00:12:52,520
A measure that works perfectly in a card visual might break in a matrix total.
308
00:12:52,520 --> 00:12:56,000
That's because the total row evaluates in a different filter context than the detail
309
00:12:56,000 --> 00:12:57,000
rows.
310
00:12:57,000 --> 00:13:01,000
Test your measures in tables and cards in matrices and with different slicer combinations.
311
00:13:01,000 --> 00:13:05,680
If a measure holds up across all those scenarios, you know it's solid.
312
00:13:05,680 --> 00:13:06,680
Putting it all together.
313
00:13:06,680 --> 00:13:09,840
Alright, let's walk through a real example that pulls everything together.
314
00:13:09,840 --> 00:13:13,600
Imagine you're building a sales report and you need to show three numbers.
315
00:13:13,600 --> 00:13:17,160
Total sales for this period total sales for the same period last year and the growth
316
00:13:17,160 --> 00:13:18,960
percentage between them.
317
00:13:18,960 --> 00:13:20,840
First thing you need is a clean date table.
318
00:13:20,840 --> 00:13:25,520
Go into your model, create a date table that covers your full date range, one row per day,
319
00:13:25,520 --> 00:13:29,680
no gaps, then right click it, choose Marcus date table and pick the date column.
320
00:13:29,680 --> 00:13:33,920
Do that once and every time intelligence function you write from there on will just work.
321
00:13:33,920 --> 00:13:38,560
Next, write your base measure, call it total sales and type total sales, it will sum sales
322
00:13:38,560 --> 00:13:39,560
amount.
323
00:13:39,560 --> 00:13:43,720
That's the foundation and every other calculation will build on this one simple line.
324
00:13:43,720 --> 00:13:47,960
Then you write the prior year measure, use calculate with same period last year.
325
00:13:47,960 --> 00:13:52,880
It looks like this, prior year sales, epitome, calculate total sales, same period last year,
326
00:13:52,880 --> 00:13:54,480
calendar date.
327
00:13:54,480 --> 00:13:58,800
Now you've got current year sitting right next to last year, now the growth percentage.
328
00:13:58,800 --> 00:14:04,440
Use divide to handle cases where last year sales might be zero and they will be.
329
00:14:04,440 --> 00:14:10,920
Write it like this, growth percent is divide, total sales, prior year sales, prior year sales.
330
00:14:10,920 --> 00:14:15,200
It safely returns a blank instead of an error if the denominator is zero.
331
00:14:15,200 --> 00:14:17,040
That's the smart way to avoid crashes.
332
00:14:17,040 --> 00:14:20,880
Now you have three reusable measures that work across any filter you throw at them.
333
00:14:20,880 --> 00:14:24,720
Drop them into a table by product, by region, by month, they'll respond correctly every
334
00:14:24,720 --> 00:14:25,720
single time.
335
00:14:25,720 --> 00:14:26,720
That's the whole point.
336
00:14:26,720 --> 00:14:30,600
Build on a clean model, master a handful of core functions and the rest falls into place.
337
00:14:30,600 --> 00:14:34,240
So don't try to write complex stacks on day one, get your model right first, learn the
338
00:14:34,240 --> 00:14:38,640
basics, measures, filter context, calculate.
339
00:14:38,640 --> 00:14:42,160
And you'll solve most business problems with just a few lines of code.
340
00:14:42,160 --> 00:14:43,160
So here's where we land.
341
00:14:43,160 --> 00:14:46,880
You know what DAX is, why filter context matters and how calculate and iterator functions
342
00:14:46,880 --> 00:14:47,880
do their thing.
343
00:14:47,880 --> 00:14:50,520
You've seen the common traps and how to step around them.
344
00:14:50,520 --> 00:14:52,960
And we walk through a real example that ties it all together.
345
00:14:52,960 --> 00:14:56,400
The real power of DAX isn't about memorizing 100 functions.
346
00:14:56,400 --> 00:14:58,800
It's about clean data modeling and a few core patterns.
347
00:14:58,800 --> 00:15:01,640
Get the model right and the DAX becomes almost obvious.
348
00:15:01,640 --> 00:15:04,480
Here's what I'd suggest you try, open power BI.
349
00:15:04,480 --> 00:15:08,600
Build a simple model with a date table, a sales table and a product table.
350
00:15:08,600 --> 00:15:10,720
Then write one measure each day for a week.
351
00:15:10,720 --> 00:15:14,400
Start with total sales, add prior year sales, add growth percentage, then try a running
352
00:15:14,400 --> 00:15:15,400
total.
353
00:15:15,400 --> 00:15:18,440
By the end of the week, you'll be writing measures without even thinking about it.
354
00:15:18,440 --> 00:15:19,440
That's how it clicks.
355
00:15:19,440 --> 00:15:22,560
If this episode helped, subscribe and keep building that knowledge.
356
00:15:22,560 --> 00:15:25,800
Next time we'll talk about debugging DAX when things go wrong.
357
00:15:25,800 --> 00:15:26,800
Because they will.
358
00:15:26,800 --> 00:15:28,720
And knowing how to fix them is half the battle.

Founder of m365.fm, m365.show and m365con.net
Mirko Peters is a Microsoft 365 expert, content creator, and founder of m365.fm, a platform dedicated to sharing practical insights on modern workplace technologies. His work focuses on Microsoft 365 governance, security, collaboration, and real-world implementation strategies.
Through his podcast and written content, Mirko provides hands-on guidance for IT professionals, architects, and business leaders navigating the complexities of Microsoft 365. He is known for translating complex topics into clear, actionable advice, often highlighting common mistakes and overlooked risks in real-world environments.
With a strong emphasis on community contribution and knowledge sharing, Mirko is actively building a platform that connects experts, shares experiences, and helps organizations get the most out of their Microsoft 365 investments.


