Why It's Time to Abandon Folders for Graph-Based Architecture
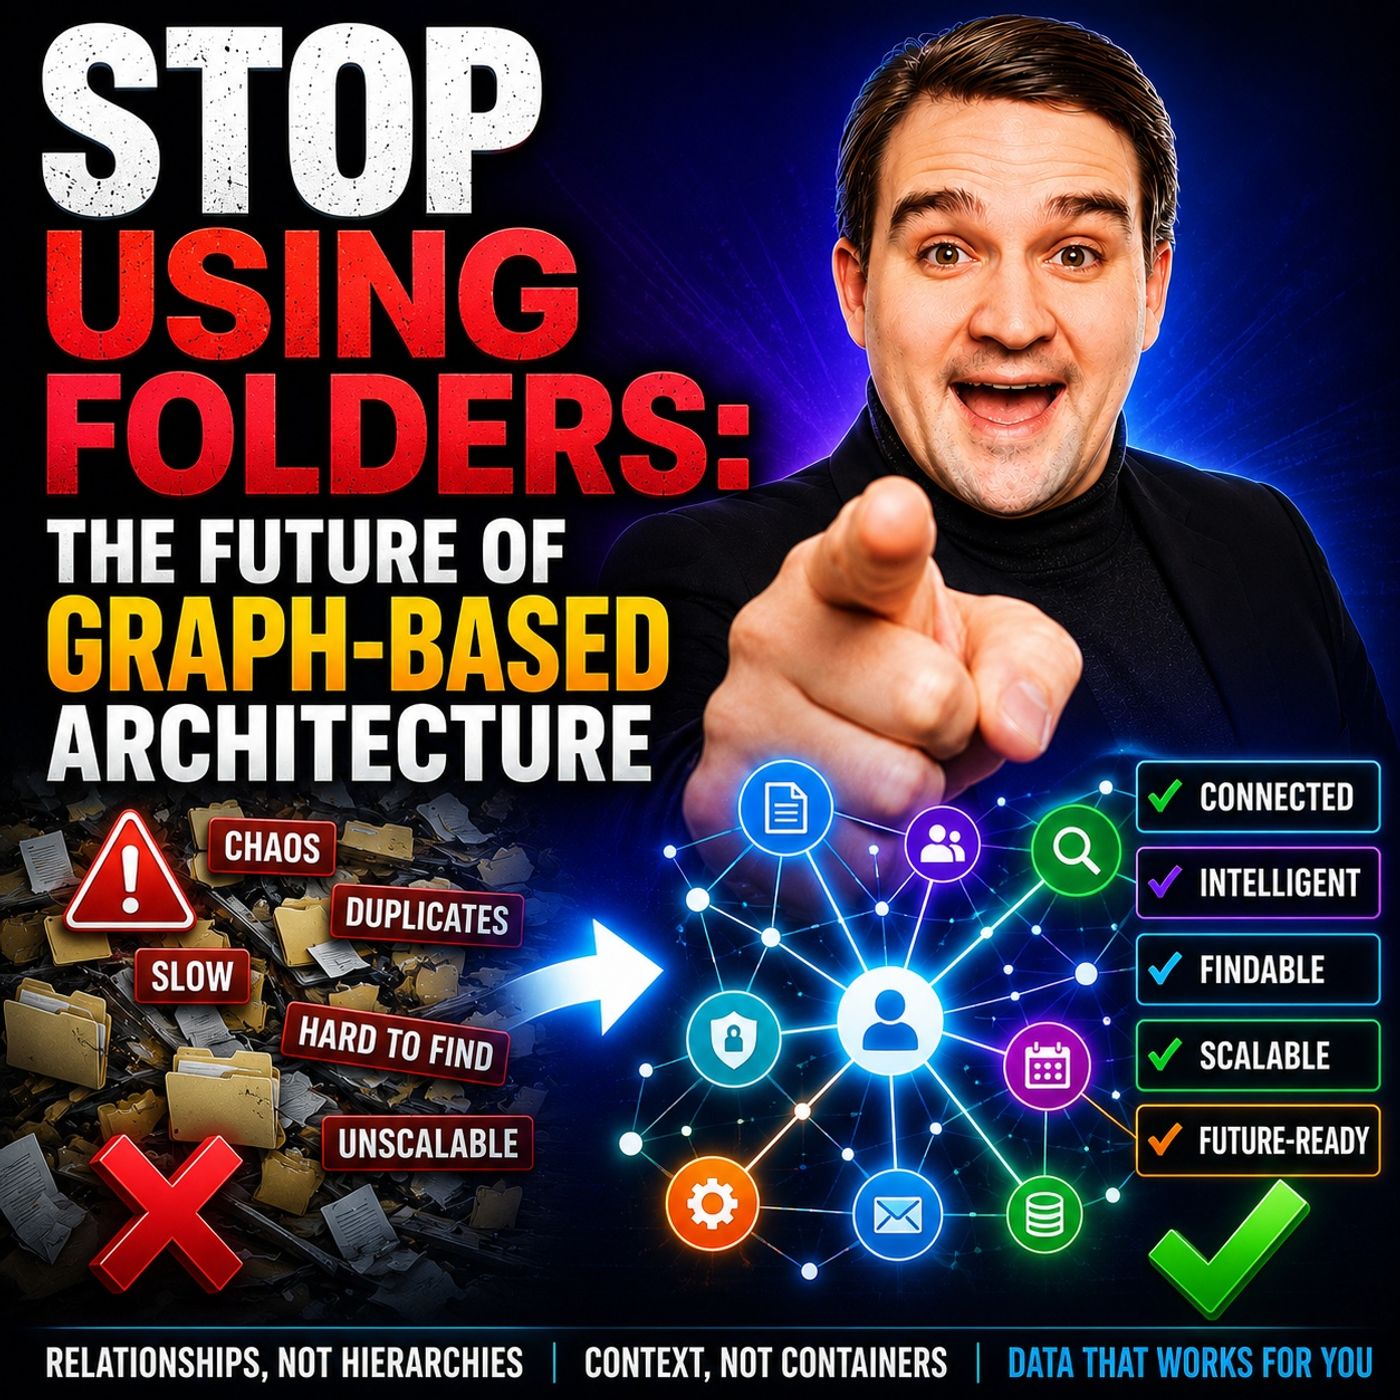
Welcome back, fellow tech enthusiasts and knowledge workers! If you have ever spent twenty minutes hunting for a misplaced spreadsheet, buried three sub-folders deep within a chaotic corporate directory, you already know the profound frustration of legacy file organization. For decades, we have relied on rigid folder hierarchies to manage our digital lives. But as our enterprises grow exponentially and artificial intelligence becomes the core engine of everyday business, those traditional filing cabinets are holding us back. In this post, we are diving deep into the massive paradigm shift happening right now across modern organizations: moving away from outdated folder structures and embracing dynamic, relationship-driven knowledge models. To explore how this works in real Microsoft environments, be sure to check out our companion podcast episode, Microsoft Graph Architecture Beyond Folders and Hierarchies.
Transforming Digital Systems
From Folders to Graphs
Context and Relationships
You have seen digital systems evolve rapidly over the past decade. Major organizations have moved from rigid folder-based models to flexible graph-based models. This shift marks the third generation of Knowledge Management. Early Wiki systems, like MediaWiki, introduced the idea of interconnected pages. These systems broke away from isolated documents and mirrored the structure of the World Wide Web. Tools for Thought, such as Roam and Obsidian, took this further. They allowed you to manage knowledge through networks that highlight relationships and context.
A graph does not store information in silos. Instead, it connects data points, making relationships visible and actionable. You can see how one project links to another or how a client’s needs relate to multiple teams. This approach helps you understand the bigger picture without getting lost in endless folders.
Intent-Driven Discovery
A graph-based system anticipates your needs. It uses context from your interactions, meetings, and collaboration signals. You do not have to remember where you saved a file. The system surfaces relevant information based on your intent. For example, when you prepare for a meeting, the graph brings up related documents, emails, and notes. This proactive discovery saves you time and keeps you focused on your goals.
Note: With a graph, you move from searching for information to receiving it when you need it most. This shift transforms how you work and make decisions.
Cultural Shift in Organizations
Transparency and Collaboration
When you adopt a graph-based architecture, you change more than your technology. You reshape your organization’s culture. Teams move from a folder-based mindset to one that values transparency and collaboration. You overcome the fear of losing ownership over information. You build trust as everyone adapts to a context-first culture. Instead of hiding knowledge, you make connections and metadata visible.
- Graph-based systems create a structural layer that links AI outputs to data points and reasoning paths. This transparency builds trust and improves decision-making.
- Graph databases make reasoning explicit. You and your colleagues can follow decision paths without needing deep technical knowledge. This supports collaboration among all stakeholders.
Reducing Cognitive Load
A graph reduces the mental effort required to find and use information. You no longer need to remember complex folder paths or manage duplicate files. The system organizes knowledge by relationships and context. You focus on your work, not on searching for documents. This reduction in cognitive load frees up your energy for creativity and problem-solving.
- You move from a need-to-know culture to one that embraces visible connections.
- The graph helps you see how your work fits into the larger mission of your organization.
You experience a workplace where information flows freely, and collaboration becomes second nature. The graph-based approach empowers you to innovate and adapt in a fast-changing digital world.
What Is Graph-Based Architecture?

Core Concepts
Nodes and Edges
You interact with graph-based models every day, even if you do not realize it. In these models, you see data represented as nodes and edges. A node stands for an entity, such as a document, person, or project. An edge connects two nodes, showing the relationship between them. Unlike traditional folder systems, graph databases organize information as a network. You do not need to search through rigid hierarchies. Instead, you explore connections that reflect how your work and data relate in real life.
- Graph databases model data as a network of interconnected entities, not as tables.
- Nodes represent entities, and relationships connect these nodes, which is different from foreign keys in relational models.
- You benefit from flexible schema design. Graph databases adapt to changing needs, while relational databases remain rigid.
- Relationships are first-class elements. You move through connected data quickly, avoiding slow JOIN operations.
Relationship Modeling
You see relationship modeling as the heart of graph-based architecture. Every connection tells a story. You can track how a client links to multiple projects or how a document relates to several teams. M365 FM’s implementation shows this in action. The platform replaces folders with dynamic graphs, making information more accessible and collaborative. You organize your data based on context and intent, not location. This flexibility lets you respond to new business needs without restructuring your entire system.
Tip: When you use graph-based models, you visualize relationships instantly. You gain clarity and insight that folder-based systems cannot provide.
Why It Matters Now
Complex Data Needs
Modern enterprises face complex data challenges. You must unify information from many sources and adapt quickly to change. Graph-based models help you meet these demands. You connect people, applications, and capabilities in one network. Automated visualization tools let you generate diagrams in real time. You analyze multiple perspectives from the same dataset, without duplicating information.
| Evidence Point | Description |
|---|---|
| Unification of Data Sources | Graph databases integrate siloed data into a cohesive network. |
| Flexibility to Evolve | You adapt to changes without redesigning your system. |
| Relationship-Centric Analysis | You reveal interdependencies for better decisions and risk assessment. |
You see how graph databases bring together data from across your organization. You gain a single view that supports strategic planning and innovation.
Real-Time Insights
You need real-time insights to stay competitive. Graph-based architecture delivers information as soon as you need it. The fusion of AI and graph databases enables proactive discovery. You receive relevant documents, updates, and recommendations based on your activity. M365 FM’s approach surfaces information before you even ask. You make faster decisions and respond to opportunities with confidence.
Note: Real-time insights transform your workflow. You spend less time searching and more time acting.
You experience a digital landscape where information flows freely. Graph-based models empower you to connect, analyze, and innovate. You move beyond folders and embrace a future shaped by relationships and context.
Key Mechanisms and Graph-Based AI Model
Knowledge Mapping
Visualizing Data Networks
You can transform your organization’s information landscape by using knowledge mapping. This process starts with collecting and analyzing your data. You extract and integrate data from multiple sources, then link and enrich it to build a unified network. You store this network in a graph, which allows you to query and infer new insights. Finally, you search and visualize the results to reveal hidden connections.
- Collect and analyze your data
- Extract and integrate data
- Link and enrich information
- Store in a graph
- Query and infer relationships
- Search and visualize results
Ontologies play a key role in this process. They define what entities and relationships mean for your business. You use these frameworks to set rules and constraints, ensuring that your graph reflects your organization’s reality.
Uncovering Patterns
Knowledge graphs unify master data across departments and platforms. You gain a single view of your enterprise and customer data. This integration supports regulatory compliance and improves traceability. When you use knowledge mapping, you address data inconsistency and duplication. You can trust your data, which leads to better analytics and faster, AI-powered decision-making. You uncover patterns that drive strategic planning and innovation.
Graph-Based AI Model Integration
Semantic Indexing
A graph-based AI model uses semantic indexing to predict relationships between events. It labels them as relevant or irrelevant, which helps you receive tailored information. This process ensures that you access content that matches your needs. A semantic hub organizes knowledge and user context. You benefit from automatic content delivery, powered by a graph database and taxonomy management tools. You always get the right information at the right time.
Proactive Information Delivery
You experience proactive information delivery with a graph-based AI model. The system anticipates your needs by analyzing your interactions and context. You receive recommendations and updates before you even ask. This approach leverages generative AI to enhance productivity and creativity. You spend less time searching and more time acting on insights.
Tip: Proactive delivery means you stay ahead of your tasks and make smarter decisions.
Real-Time Data and Interoperability
Connecting Systems
A graph-based control plane connects your systems in real time. You access data across platforms without barriers. This interoperability gives you a holistic view of your organization. You use standardized data to unlock information that was once inaccessible. Real-time streaming helps you adapt quickly to market changes. You improve collaboration and efficiency by sharing a common understanding of your datasets.
Scalable Architecture
You need a scalable architecture to support growing data and AI workloads. A graph-based AI model uses modular microservices and dynamic resource allocation. Each component scales independently, ensuring robust performance. Near-linear scaling maintains speed as your data volume increases. You achieve higher agility and efficiency, which is essential for generative AI and graph reasoning. You can trust your system to deliver accurate, explainable results, even as demands grow.
| Benefit | Description |
|---|---|
| Independent Scalability | Each part grows as needed |
| Robust Performance | Stable and responsive under heavy workloads |
| Dynamic Allocation | Resources adjust to workload changes |
You build a foundation for advanced AI, generative AI, and graph reasoning. Your organization stays ready for the future of data integration and digital transformation.
IT Management and Enterprise Applications
Real-Time Knowledge Graphs
Automation in IT Management
You can transform your approach to IT management by adopting real-time knowledge graphs. These systems provide structured and contextualized data that supports AI-driven automation. You no longer need to rely on manual processes for routine tasks. Instead, you harness AI-driven automation to streamline workflows and reduce errors. With graph-driven IT management, you integrate data from multiple sources, making your enterprise more agile and responsive. You improve data integration and reuse existing assets efficiently. This approach enables you to track data quality, discover errors quickly, and make informed decisions.
- Real-time knowledge graphs support AI-driven processes for effective IT management.
- You gain better visibility into your enterprise assets and operations.
- Automation reduces repetitive work and allows your team to focus on strategic initiatives.
- You use AI-powered tools to monitor systems, predict issues, and resolve incidents before they impact users.
Security and Asset Mapping
Security remains a top priority in enterprise IT strategy. You need to protect sensitive information and ensure compliance. Graph-based systems help you map assets and monitor security relationships in real time. You visualize connections between users, devices, and applications, which helps you detect vulnerabilities and respond to threats faster. With graph-driven IT management, you track access patterns and identify anomalies. Automation supports continuous monitoring, so you maintain a strong security posture. You can also ensure that only authorized users access critical resources, reducing the risk of breaches.
Business Innovation
Personalization Engines
You drive business innovation by leveraging AI and knowledge graphs. Personalization engines analyze customer preferences and behaviors, delivering tailored recommendations that boost satisfaction. You use AI-driven automation to adapt content and services in real time. This approach increases engagement and builds loyalty. Your enterprise gains a competitive edge by anticipating customer needs and responding proactively.
Supply Chain Optimization
You optimize your supply chain with AI-powered graph-based IT operating models. These models provide a unified view of inventory, logistics, and suppliers. You use AI to analyze dynamic factors and improve forecast accuracy by up to 45%. Automation helps you reduce inventory levels by 28% and minimize disruption costs. You ensure product availability and meet customer expectations, which protects revenue streams. Your enterprise benefits from seamless coordination across departments and partners.
| Metric | Impact |
|---|---|
| Annual disruption cost per Fortune 500 company | $184M |
| Improvement in forecast accuracy with AI | 45% |
| Average inventory reduction through optimization | 28% |
Interdisciplinary Research
Scientific Discovery
You accelerate scientific discovery by using graph-based systems to map knowledge across disciplines. AI models analyze thousands of research papers, revealing connections and key ideas. You uncover unexpected relationships, such as parallels between biological materials and music, which inspire new innovations. Graphs serve as information maps, helping you identify central topics and novel research directions.
Healthcare Integration
You improve healthcare integration by connecting patient data, treatments, and outcomes in a unified graph. AI-driven automation supports personalized care and enhances collaboration among providers. You use knowledge graphs to identify trends, optimize resource allocation, and improve patient outcomes. Your enterprise stays at the forefront of innovation by adopting these advanced tools.
Note: By embracing real-time, interconnected knowledge graphs, you position your enterprise to outperform competitors, ensure security, and drive continuous innovation.
Challenges and Considerations
Data Governance
You face new governance challenges as you transition to graph-based architecture. You must ensure that your organization manages information responsibly and transparently. Governance becomes more complex when you connect data across departments and platforms. You need to address privacy, compliance, and access control to protect sensitive information and maintain trust.
Privacy and Compliance
You must comply with regulations such as GDPR and HIPAA. Privacy rules require you to track how information flows through your graph. Compliance complexity increases as you integrate multiple systems. You need to monitor data usage and ensure that only authorized users access confidential records. You advocate for enhanced governance approaches to meet these requirements.
- Data quality issues
- Compliance complexity
- Stakeholder buy-in
- Technical integration difficulties
- Resistance to change
You understand the root causes of governance dilemmas. You address technology fragmentation and promote unified data management strategies.
Access Control
You implement access control policies to safeguard information. You assign permissions based on roles and responsibilities. You monitor who can view, edit, or share data. You ensure that governance frameworks support secure collaboration. You map dependencies between users, applications, and documents to prevent unauthorized access.
- Complexity of data integration
- Ensuring data quality and consistency
You build governance structures that adapt to evolving business needs. You foster a culture of accountability and transparency.
Data Quality
You recognize that data quality is essential for effective IT management. You must validate information at every stage to detect anomalies. You assign stewardship roles to business users who flag issues and publish reports. You use dashboards and rule-based systems to monitor patterns and identify problems. You adopt advanced AI tools for real-time interventions.
Consistency Issues
You face challenges in maintaining consistency across large-scale graphs. You optimize infrastructure and monitor system health to ensure accuracy. You pull information from reliable sources to support compliance and standardization. You use conceptual frameworks like ISO/IEC 25012 to map quality dimensions to business outcomes.
| Strategy | Description |
|---|---|
| Continuous Data Quality Strategies | Validate and monitor data at every stage to detect anomalies immediately. |
| Infrastructure Management | Optimize resource utilization and monitor system health. |
| Security Data Standardization | Pull from reliable sources for consistency and compliance. |
| Conceptual Framework | Map data quality dimensions to business outcomes. |
| Data Stewardship | Assign responsibility for flagging issues and publishing reports. |
Trust in Graph Systems
You build trust by embedding quality at the metadata layer. For example, VillageCare improved trusted catalog usage by 250% in one year by using open data quality frameworks and AI alerts. Clinicians accessed validated patient records, demonstrating how strong governance enhances reliability. You rely on AI-driven automation to maintain trust and support IT management.
Scalability
You encounter scalability issues as your graph-based architecture grows. You must manage complexity, adaptability, and performance to support enterprise operations. You address dependencies between systems and optimize resource allocation.
Large-Scale Graphs
You struggle to understand interdependencies within enterprise architecture. Data fragmentation becomes a barrier to AI success. 42% of AI initiatives underperform due to poor data readiness. 68% of organizations with less than half of their data centralized experience revenue losses. You centralize information to improve IT management and reduce fragmentation.
| Issue Type | Description |
|---|---|
| Complexity | Difficulty in understanding dependencies within enterprise architecture. |
| Adaptability | Challenges in adapting architecture to changes. |
| Performance | Inability to implement analytical queries due to performance issues. |
Performance Optimization
You optimize performance by scaling components independently. You use modular microservices and dynamic resource allocation. You monitor system health and adjust resources to meet changing demands. You ensure that IT management processes remain efficient as your graph expands. You leverage AI to enhance scalability and maintain robust performance.
Tip: You build a resilient architecture by focusing on governance, data quality, and scalability. You empower your organization to innovate and adapt in a rapidly changing digital landscape.
The Future of Graph-Based Architecture
Preparing for Change
Building Graph Literacy
You prepare for the future of graph-based architecture by building graph literacy across your organization. Data literacy now stands as a fundamental skill in every sector. You must help your teams understand how to use and interpret data effectively. Many professionals lack training in data structures and accuracy, which limits their ability to leverage graph-based systems. When you invest in graph literacy, you empower your workforce to navigate complex relationships and extract value from connected information.
Upskilling Teams
You drive success by upskilling your teams. Encourage your staff to develop graph query skills and become comfortable with new tools. You define clear ownership and governance for your graph initiatives. You integrate graphs across IT domains and manage data for quality and usefulness. These steps ensure your organization adapts quickly as the future of graph-based architecture unfolds.
Tip: Upskilling your teams today prepares you for tomorrow’s challenges.
Strategic Adoption
Identifying Use Cases
You maximize impact by focusing on high-value use cases. Target structured information and prioritize high-quality curation. Start with proof of value initiatives instead of broad deployments. This approach lets you demonstrate quick wins while controlling complexity. Select processes with clear user groups and well-defined tasks. Address major information access challenges to show the true power of the future of graph-based architecture.
Integrating with Legacy Systems
You face challenges when integrating graph-based systems with legacy infrastructure. You must map and transform data extensively to ensure smooth interoperability. Use connectors, APIs, or virtualization layers to enhance integration and avoid new silos. Tooling optimized for graphs simplifies ETL processes. For a seamless migration, sync data bidirectionally, migrate modules one at a time, and validate each step before decommissioning old systems. This method reduces risk, prevents downtime, and helps you catch problems early.
Continuous Evolution
Staying Ahead of Trends
You stay ahead in the future of graph-based architecture by learning from industry leaders. For example, Trend Micro improved answer quality by 20% using connected security data. NewDay reduced undetected fraud by up to 15% with advanced graph analytics. BMW Group supports thousands of analytical use cases for its users. Paysafe cut investigation times from an hour to minutes. Uber uses knowledge graphs to validate business processes and adapt quickly.
| Organization | Use Case | Benefit |
|---|---|---|
| Trend Micro | AI security assistant | 20% better answers |
| NewDay | Fraud detection | 10-15% fewer undetected cases |
| BMW Group | Cloud Data Hub | 1,000+ use cases for 9,000 users |
| Paysafe | Fraud investigations | Minutes instead of hours |
| Uber | Config Knowledge Graph | Early conflict detection |
Embracing Innovation
You unlock new opportunities when you embrace it strategically. The future of graph-based architecture brings better discovery of hidden patterns, stronger AI grounding, and greater traceability. You build adaptable models that thrive in changing environments. As you continue to evolve, you position your organization to lead in a connected, data-driven world.
Note: The future of graph-based architecture rewards those who invest in literacy, strategic adoption, and continuous innovation.
You stand at the forefront of digital transformation as graph-based architecture reshapes how you manage information. The table below highlights the measurable advantages you gain:
| Key Outcome | Description |
|---|---|
| AI accuracy and reliability | Teams see AI outputs reach 90–100% accuracy, with a 26% improvement in overall AI performance. |
| Efficiency and cost | Token usage can drop by up to 80%, manual tagging is reduced by 60%, and duplicate work drops by half. |
| Productivity and speed | Time to action is nearly three times faster, searches run 40% quicker, and teams save more than 30 minutes per query. |
| Innovation and growth | Collaboration improves across teams, and organizations can unlock up to 25% growth in revenue by leveraging insights more effectively. |
| Compliance and governance | Offers automated mapping, risk flagging, and consistent auditability — making governance simpler and more reliable. |
Knowledge graphs connect data, workflows, and applications, creating a digital thread that enhances every business process.
The integration of AI with graph databases enables real-time, automated decision-making and dynamic IT governance.
You prepare your teams for this shift by fostering a culture of transparency and adaptability. M365 FM’s approach ensures you stay ready for a world where information is dynamic, connected, and actionable. The future is here, and you lead the way as graph-based systems shape tomorrow’s digital business.
FAQ
What is graph-based architecture?
Graph-based architecture organizes information as a network of connected entities. You see data as nodes and relationships as edges. This approach helps you find context and connections quickly, unlike traditional folder systems.
How does M365 FM improve information discovery?
M365 FM uses context and relationships to surface relevant information. You receive documents and insights based on your activities, meetings, and collaborations. This proactive delivery saves you time and boosts productivity.
Can I integrate graph-based systems with my existing tools?
Yes, you can connect graph-based systems with legacy tools using APIs and connectors. M365 FM supports seamless integration, so you do not need to replace your current infrastructure immediately.
Is my data secure in a graph-based system?
You control access with role-based permissions and monitoring. M365 FM uses advanced security features to protect sensitive information and ensure compliance with industry standards.
How does graph-based architecture reduce cognitive load?
You no longer search through complex folders. The system organizes information by relationships and context. You find what you need faster, which lets you focus on your work.
What industries benefit most from graph-based architecture?
You see value in industries like healthcare, finance, research, and manufacturing. Any organization that manages complex data and relationships can benefit from this approach.
How do I start adopting graph-based architecture?
Begin with a pilot project. Identify a high-impact use case. Upskill your team on graph concepts. Use M365 FM’s resources and support to guide your transition.
Tip: Start small, measure results, and expand as your team gains confidence.
🎧 Listen to this episode
Want a practical explanation of Microsoft Graph Architecture Beyond Folders and Hierarchies? This episode breaks down the topic in clear language and shows why it matters for Microsoft 365, Azure, Power Platform, security, AI, and modern work.
Listen to this episode if you want to:
- Understand the key concepts behind Microsoft Graph Architecture Beyond Folders and Hierarchies
- See how it fits into the wider Microsoft technology ecosystem
- Learn where it can create practical value for your organization
You may also enjoy these related M365 FM episodes:
- Microsoft Graph Automation Architecture: Beyond Scripts
- Graph-Powered AI Agents: An Enterprise Architecture Guide
- Enterprise AI Agent Fabric: Architecture Beyond Chatbots
- Microsoft Cowork IQ Knowledge Graph Architecture
- Microsoft Copilot Coworker Architecture Beyond Prompting
Discover more practical Microsoft conversations on M365 FM.
Last reviewed: July 2026.
Who Should Listen
This episode is for Microsoft administrators, architects, developers, security professionals, and business leaders who need a practical foundation before making implementation, operations, or governance decisions.
🎧 You Should Also Listen To
- Microsoft Fabric — A strongly related next step for extending this topic.
- Microsoft Graph Data Connect — A strongly related next step for extending this topic.
- Power BI Copilot — A strongly related next step for extending this topic.

Founder of M365 Show, M365con.net & m365.fm
Mirko Peters is a Microsoft MVP, Microsoft 365 expert, content creator, and founder of m365.fm, a platform dedicated to sharing practical insights on modern workplace technologies. His work focuses on Microsoft 365 governance, security, collaboration, and real-world implementation strategies.
Through his podcast and written content, Mirko provides hands-on guidance for IT professionals, architects, and business leaders navigating the complexities of Microsoft 365. He is known for translating complex topics into clear, actionable advice, often highlighting common mistakes and overlooked risks in real-world environments.
With a strong emphasis on community contribution and knowledge sharing, Mirko is actively building a platform that connects experts, shares experiences, and helps organizations get the most out of their Microsoft 365 investments.