


 Apple Podcasts
 Spotify
 Youtube Music
 Spreaker
 Podchaser
 Amazon Music
 Microsoft Graph Data Connect - Simply Explained


Microsoft Graph Data Connect is Microsoft's enterprise-scale data export solution for Microsoft 365. Instead of querying Microsoft Graph API one request at a time, Data Connect allows organizations to securely extract large volumes of Microsoft 365 data into analytics platforms such as Microsoft Fabric, Azure Synapse Analytics, or Azure Data Factory for reporting, business intelligence, AI, and machine learning workloads.
In this episode, you'll learn why Graph Data Connect exists, how it differs from the Microsoft Graph API, and when each approach should be used. While the Graph API is optimized for real-time applications, automation, and user interactions, Graph Data Connect is designed for batch processing and enterprise analytics, making it possible to analyze millions of emails, Teams messages, calendar events, SharePoint files, or collaboration patterns without running into API throttling limits.
The episode explains the architecture in simple terms, showing how data is exported through governed pipelines instead of live API calls. It also covers Microsoft's strong security and compliance model, including administrator approval, least-privilege access, auditing, and data governance to ensure organizations stay in control of sensitive Microsoft 365 data.
You'll also discover common use cases such as workplace analytics, compliance reporting, AI model training, organizational network analysis, customer relationship insights, and large-scale business intelligence projects. Finally, the episode discusses licensing considerations, implementation best practices, and why Microsoft Graph Data Connect has become an essential service for organizations that want to unlock the full value of their Microsoft 365 data without impacting production workloads.
Whether you're an IT administrator, data engineer, architect, or analytics professional, this episode provides a clear, non-technical introduction to one of Microsoft's most powerful enterprise data services.
Quick answer: Microsoft Graph Data Connect is covered in this M365 FM episode with a practical focus on what it is, how it works, and the decisions that matter for architecture, adoption, security, governance, or day-to-day operations.
Microsoft Graph Data Connect is an innovative service that simplifies the extraction of large volumes of Microsoft 365 data. It helps you integrate this data into Azure or Microsoft Fabric for advanced analytics and reporting. Efficient data management is crucial for organizations. Studies show that effective data usage can boost productivity and performance. For example, research indicates a positive link between customer analytics and firm performance. By leveraging tools like Microsoft Graph Data Connect, you can enhance your organization's ability to access and utilize valuable data.
Key Takeaways
- Microsoft Graph Data Connect simplifies data extraction from Microsoft 365, making it easier to analyze and report on large datasets.
- Automate data transfers to Azure or Microsoft Fabric to ensure you always have the latest data for analysis.
- Enhance security with explicit administrator approval, data encryption, and identity obfuscation to protect sensitive information.
- Utilize automated tagging and centralized management to streamline document handling and improve data visibility.
- Leverage insights from collaboration patterns and user behaviors to make informed decisions that drive organizational success.
- Integrate Microsoft Graph Data Connect with third-party systems for enhanced data management and predictive insights.
- Follow best practices like efficient query design and caching to optimize your data extraction processes.
- Embrace a data-driven culture by utilizing Microsoft Graph Data Connect to unlock valuable insights from Microsoft 365 data.
What Is Graph Data Connect?

Overview of the Service
Microsoft Graph Data Connect is a robust solution that allows you to extract large volumes of Microsoft 365 data efficiently. This service is designed for organizations that need to analyze and report on data from various Microsoft 365 services, such as SharePoint, Teams, Exchange, and OneDrive. By using Microsoft Graph Data Connect, you can streamline the process of moving data into Azure or Microsoft Fabric. This capability enables you to perform advanced analytics, machine learning, and governance tasks with ease.
The service stands out because it simplifies the extraction process. You can define specific datasets and schedule bulk data transfers without worrying about pagination or throttling. This means you can focus on gaining insights rather than getting bogged down by technical challenges.
Key Components
Understanding the key components of Microsoft Graph Data Connect helps you appreciate how it operates. Here’s a breakdown of its core elements:
| Component | Description |
|---|---|
| Microsoft Graph Data Connect | Enables extraction of Microsoft 365 data at scale with granular data consent and supports Azure-native services. |
| Azure Data Factory | Facilitates the construction of ETL and ELT processes in a user-friendly environment. |
| Azure Data Lake | Provides storage for large amounts of structured and unstructured data in various formats. |
| Microsoft Entra ID | Manages authentication for Microsoft Graph APIs and supports OAuth flow for permissions. |
These components work together to ensure that you can access and manage your Microsoft 365 data effectively. With Microsoft Graph Data Connect, you gain the tools necessary to harness your data for better decision-making and improved organizational performance.
How Microsoft Graph Data Connect Works
Data Access Process
The data access process in Microsoft Graph Data Connect is designed to be straightforward and efficient. You start by defining the specific datasets you want to extract from Microsoft 365 services. This could include data from SharePoint, Teams, Exchange, or OneDrive. Once you have defined your datasets, you can schedule bulk data transfers to Azure or Microsoft Fabric. This scheduling allows you to automate the extraction process, ensuring that you always have the most up-to-date data available for analysis.
Here’s a quick overview of the steps involved in the data access process:
- Define Datasets: Identify the specific data you need from Microsoft 365.
- Select Destination: Choose where you want to store the data, such as Azure Data Lake.
- Schedule Transfers: Set up a schedule for regular data extraction.
- Run Pipelines: Execute the scheduled pipelines to transfer data without manual intervention.
This process eliminates the complexities of pagination and throttling, allowing you to focus on analyzing your data rather than managing the extraction logistics.
Security Features
Security is a top priority when handling sensitive data. Microsoft Graph Data Connect incorporates several robust security features to protect your information throughout the data access process. Here are some key aspects of its security framework:
- Explicit Administrator Approval: Before accessing any data, administrators must provide explicit consent. This ensures that only authorized personnel can access sensitive information.
- Data Encryption: All data transfers are encrypted, safeguarding your data from unauthorized access during transit.
- Identity Obfuscation: To protect individual identities, Microsoft Graph Data Connect employs identity obfuscation techniques. This allows for meaningful analysis while maintaining user privacy.
Additionally, Microsoft Graph Data Connect helps organizations comply with data privacy regulations such as GDPR. Here’s how it supports compliance:
| Compliance Feature | Description |
|---|---|
| Persistent Data Governance | Helps organizations manage their data in accordance with GDPR requirements. |
| Minimized Compliance Management Overhead | Reduces the burden on Microsoft 365 administrators by providing specified compliance policies. |
| Support for Critical Data Protection Regulations | Ensures adherence to GDPR and HIPAA standards, promoting data privacy and confidentiality. |
By implementing these security features, Microsoft Graph Data Connect not only protects your data but also enhances your organization’s ability to manage compliance effectively.
Benefits of Using Microsoft Graph Data Connect
Enhanced Insights
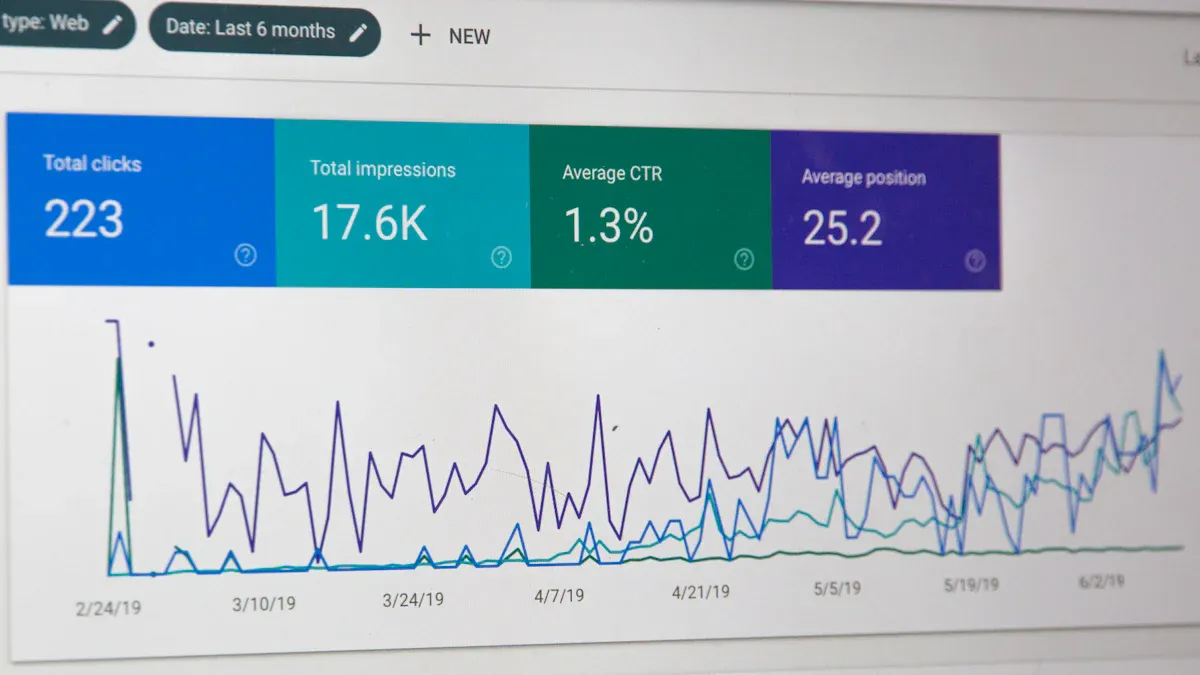
Using Microsoft Graph Data Connect allows you to gain deeper insights into your organization's data. By extracting large volumes of data from Microsoft 365 services, you can analyze collaboration patterns and user behaviors. This analysis helps you identify trends and make informed decisions. With the ability to combine data from various sources, you can create a comprehensive view of your operations. This holistic perspective enables you to uncover valuable insights that drive strategic initiatives.
Streamlined Management
Microsoft Graph Data Connect simplifies data management processes significantly. It automates tasks that would otherwise require manual effort. For instance, the service offers automated tagging of documents and mapping relationships between diverse data types. This automation streamlines document management and enhances data visibility within a unified platform. You can also benefit from a centralized platform that empowers your teams to make data-driven decisions based on comprehensive project lifecycle insights. Instant AI tagging replaces manual effort, delivering richer and more accurate metadata. This allows your experts to focus on high-value tasks rather than getting bogged down in routine data management.
Here’s a summary of how Microsoft Graph Data Connect streamlines management:
| Evidence Description | Key Benefits |
|---|---|
| Automated tagging of documents and mapping relationships between diverse data types. | Streamlines document management and enhances data visibility within a unified platform. |
| Centralized platform for visibility and data-driven decisions. | Empowers teams to make informed decisions based on comprehensive project lifecycle insights. |
| Instant AI tagging replaces manual effort. | Delivers richer, more accurate metadata, allowing experts to focus on high-value tasks. |
Cost Efficiency
Implementing Microsoft Graph Data Connect can lead to significant cost savings for your organization. By automating data extraction and management, you reduce the time and resources spent on manual processes. This efficiency allows your teams to allocate their efforts toward more strategic initiatives. Additionally, the ability to analyze data effectively can lead to better resource allocation and improved operational performance. As a result, you can achieve a higher return on investment while minimizing unnecessary expenses.
Use Cases for Microsoft Graph Data Connect
Analytics and Reporting
You can leverage Microsoft Graph Data Connect to enhance your analytics and reporting capabilities significantly. By extracting data from Microsoft 365 services, you gain access to valuable insights that drive informed decision-making. Here are some common scenarios where organizations utilize this service:
- Security: Analyze information oversharing and external sharing issues.
- Capacity: Understand site lifecycle and manage storage effectively.
- Sync Health: Monitor OneDrive Sync, device health, and folder backup.
Additionally, you can explore deeper insights through:
- Security Analytics: Detect unusual account behavior and suspicious file activity.
- Collaboration Analytics: Analyze team communication and inter-departmental collaboration.
- Content Governance: Identify stale files, duplicate documents, and excessive permissions.
These analytics empower you to make data-driven decisions that align with your organizational goals.
Integration with Other Systems
Microsoft Graph Data Connect excels in integrating with various third-party systems, enhancing your data management capabilities. You can connect with platforms such as:
- Microsoft Fabric Lakehouses
- Azure Data Lake Storage
- Azure Blob Storage
- Azure Synapse Analytics
- Azure Data Factory pipelines
- Custom analytics platforms through additional processing pipelines
This integration allows you to combine Microsoft 365 productivity data with project data. As a result, you can gain predictive insights into initiative execution and outcomes. This capability helps you identify program delays, distractions, and resource dependencies, ultimately enhancing your decision-making process.
Microsoft Graph Data Connect for SharePoint
When it comes to Microsoft Graph Data Connect for SharePoint, the benefits are substantial. This service enhances data access and management within SharePoint, allowing you to interact with external content seamlessly. Here are some key features and benefits:
| Feature/Benefit | Description |
|---|---|
| Integration with external data sources | Enables users to access and interact with external content directly within SharePoint. |
| Unified search experience | Facilitates a cohesive search experience across Microsoft 365 applications, including SharePoint. |
| Improved collaboration and knowledge management | Enhances the ability to manage and share knowledge effectively within organizations. |
By utilizing Microsoft Graph Data Connect for SharePoint, you can streamline your workflows and improve collaboration across your organization. This integration fosters a more efficient environment where teams can access the information they need quickly.
Implementing Microsoft Graph Data Connect
Prerequisites
Before you implement Microsoft Graph Data Connect, ensure you meet the following prerequisites:
| Prerequisite | Description |
|---|---|
| Enable Data Connect | Work with your Microsoft 365 tenant admin to enable the Data Connect service for your tenant. |
| Global Administrator Role | At least one user in your Microsoft 365 tenant must have the Global Administrator role enabled. |
| Same Microsoft Entra Tenancy | Ensure that your Microsoft 365 and Azure tenants are in the same Microsoft Entra tenancy. |
| Azure Subscription | The Azure subscription must be in the same tenant as the Microsoft 365 tenant. |
| Application Administrator or Developer Role | A different user in your Microsoft 365 tenant must have either the Application Administrator or Application Developer role. |
Configuration Steps
Setting up Microsoft Graph Data Connect involves several steps. Follow these instructions to configure the service effectively:
- Access Microsoft Graph Data Connect in the Azure portal.
- Choose Add or Add a new application.
- Follow the Add wizard to provide project details for registration.
- Select a subscription and configure the resource group and storage account.
- Choose datasets and review the application details.
- Approve your application in the Microsoft 365 admin center.
- Set up your Azure resource with Azure Synapse or Azure Data Factory.
- Enable Microsoft Graph Data Connect in your Microsoft 365 tenant.
- Set up your Microsoft Entra application.
- Set up your Azure Storage resource.
Best Practices
To optimize your experience with Microsoft Graph Data Connect, consider these best practices:
- Efficient Query Design: Focus on fetching only necessary data with precise filters.
- Caching: Use caching strategies to minimize API calls, especially for infrequently changing data.
- Pagination and Batching: Implement pagination for large datasets and batch requests to reduce HTTP overhead.
- Concurrency: Make concurrent requests to speed up data retrieval while managing rate limits.
By following these guidelines, you can enhance the performance and efficiency of your data management processes.
Ongoing Security and Compliance
Maintaining security and compliance is crucial when using Microsoft Graph Data Connect. Here are some strategies to ensure ongoing protection:
- Utilize real-time visibility into tenant activities for proactive threat detection.
- Integrate with Microsoft 365 to enhance security capabilities and automate compliance processes.
- Set up security alerts for immediate notifications about potential threats.
- Regularly analyze activity logs to identify unusual user behavior.
- Conduct quarterly security assessments to identify vulnerabilities.
By implementing these practices, you can safeguard your data while leveraging the full potential of Microsoft Graph Data Connect.
Microsoft Graph Data Connect offers a powerful solution for organizations looking to leverage Microsoft 365 data effectively. By simplifying data extraction and enhancing security, you can gain valuable insights that drive informed decision-making.
Consider these key takeaways as you explore Microsoft Graph Data Connect:
- Select the tools that work best for you. Utilize existing tools within Microsoft 365 and Azure before creating custom solutions.
- Get reports to the right people. Identify stakeholders who will receive and act on oversharing reports.
- Put thought into your communication strategy. Collaborate with communication professionals to effectively address oversharing with content owners.
- Consider the content of your reports. Tailor reports to meet the specific needs of different stakeholders.
As organizations develop a data-driven culture, adopting Microsoft Graph Data Connect will unlock access to Microsoft 365 data for various analytics scenarios. Embrace this opportunity to enhance your data management and insights.
FAQ
What is Microsoft Graph Data Connect?
Microsoft Graph Data Connect is a service that simplifies the extraction of large volumes of Microsoft 365 data into Azure or Microsoft Fabric for analytics and reporting.
How does Microsoft Graph Data Connect enhance data security?
It enhances security by requiring explicit administrator approval for data access, encrypting data during transfer, and employing identity obfuscation techniques to protect user identities.
Can I schedule data transfers with Microsoft Graph Data Connect?
Yes, you can schedule bulk data transfers to automate the extraction process, ensuring you always have the latest data available for analysis.
What types of data can I extract using this service?
You can extract data from various Microsoft 365 services, including SharePoint, Teams, Exchange, and OneDrive, allowing for comprehensive analytics.
Is Microsoft Graph Data Connect suitable for small businesses?
Yes, Microsoft Graph Data Connect can benefit organizations of all sizes. It helps streamline data management and enhances insights, making it valuable for small businesses as well.
How do I get started with Microsoft Graph Data Connect?
To get started, ensure you meet the prerequisites, configure the service in the Azure portal, and follow the setup steps outlined in the documentation.
What are the main benefits of using Microsoft Graph Data Connect?
The main benefits include enhanced insights, streamlined data management, and cost efficiency, allowing organizations to make informed decisions based on comprehensive data analysis.
Can I integrate Microsoft Graph Data Connect with other systems?
Absolutely! You can integrate it with various third-party systems, such as Azure Data Lake Storage and Azure Synapse Analytics, to enhance your data management capabilities.
🎧 Listen to this episode
Want a practical explanation of Microsoft Graph Data Connect? This episode breaks down the topic in clear language and shows why it matters for Microsoft 365, Azure, Power Platform, security, AI, and modern work.
Listen to this episode if you want to:
- Understand the key concepts behind Microsoft Graph Data Connect
- See how it fits into the wider Microsoft technology ecosystem
- Learn where it can create practical value for your organization
You may also enjoy these related M365 FM episodes:
- Enterprise Microsoft 365 Analytics with Graph Data Connect
- How Microsoft Graph Connects Microsoft 365 Data and Context
- Connect Azure SQL to Copilot Studio Through a Data Gateway
- Connect External Business Data with Microsoft 365 Copilot Connectors
- Connect Internal Data to Microsoft 365 Copilot Safely
Discover more practical Microsoft conversations on M365 FM.
Last reviewed: July 2026.
Who Should Listen
This episode is for Microsoft 365 administrators, architects, IT leaders, and practitioners who need a practical understanding of Microsoft Graph Data Connect before planning, implementing, or supporting it.
🚀 Want to be part of m365.fm?
Then stop just listening… and start showing up.
👉 Connect with me on LinkedIn and let’s make something happen:
- 🎙️ Be a podcast guest and share your story
- 🎧 Host your own episode (yes, seriously)
- 💡 Pitch topics the community actually wants to hear
- 🌍 Build your personal brand in the Microsoft 365 space
This isn’t just a podcast — it’s a platform for people who take action.
🔥 Most people wait. The best ones don’t.
👉 Connect with me on LinkedIn and send me a message:
"I want in"
Let’s build something awesome 👊
1
00:00:00,000 --> 00:00:02,640
Today's topic is something most people haven't heard of,
2
00:00:02,640 --> 00:00:04,400
but it's one of the most powerful tools
3
00:00:04,400 --> 00:00:07,480
for pulling Microsoft 365 data out at scale.
4
00:00:07,480 --> 00:00:09,160
It's called Microsoft Graph Data Connecting.
5
00:00:09,160 --> 00:00:10,080
Here's the thing.
6
00:00:10,080 --> 00:00:12,400
You've probably tried grabbing data from SharePoint
7
00:00:12,400 --> 00:00:14,680
or Teams with the regular Graph API.
8
00:00:14,680 --> 00:00:16,120
It works fine for a few items,
9
00:00:16,120 --> 00:00:17,640
but when you need millions of records,
10
00:00:17,640 --> 00:00:19,840
throttling and pagination hit you hard.
11
00:00:19,840 --> 00:00:22,040
You get rate limits, HTTP 429 errors,
12
00:00:22,040 --> 00:00:23,560
and you end up spending more time managing
13
00:00:23,560 --> 00:00:25,320
retreats than actually getting work done.
14
00:00:25,320 --> 00:00:27,000
Graph Data Connect lets you skip all that.
15
00:00:27,000 --> 00:00:29,280
One single request can move terabytes of data
16
00:00:29,280 --> 00:00:31,040
into Azure or Microsoft fabric,
17
00:00:31,040 --> 00:00:32,800
no pagination, no throttling.
18
00:00:32,800 --> 00:00:34,040
By the end of this episode,
19
00:00:34,040 --> 00:00:35,400
you'll know exactly what it is,
20
00:00:35,400 --> 00:00:37,400
how it's different from the regular Graph APIs
21
00:00:37,400 --> 00:00:38,840
and when to use it.
22
00:00:38,840 --> 00:00:41,240
The scale problem with M365 data.
23
00:00:41,240 --> 00:00:43,440
So let's break down why regular API calls
24
00:00:43,440 --> 00:00:45,760
just don't cut it when you're doing big analytics.
25
00:00:45,760 --> 00:00:49,280
Every day Microsoft 365 generates billions of interactions.
26
00:00:49,280 --> 00:00:51,560
Email, send, Teams messages posted,
27
00:00:51,560 --> 00:00:53,560
files uploaded, meetings scheduled.
28
00:00:53,560 --> 00:00:55,040
That's data sitting inside your tenant.
29
00:00:55,040 --> 00:00:56,680
If you want to analyze it, say,
30
00:00:56,680 --> 00:00:59,080
to understand collaboration patterns across departments,
31
00:00:59,080 --> 00:01:00,280
you need to get it out.
32
00:01:00,280 --> 00:01:01,400
That's where the trouble starts.
33
00:01:01,400 --> 00:01:04,160
The standard Graph API is built for real time access.
34
00:01:04,160 --> 00:01:07,040
You ask for a user's messages and it gives you the last 20.
35
00:01:07,040 --> 00:01:08,800
Ask for the next 20 you page in it.
36
00:01:08,800 --> 00:01:12,400
If you ask too fast, you get throttled with HTTP 429 errors
37
00:01:12,400 --> 00:01:15,080
and you have to back off, wait and try again.
38
00:01:15,080 --> 00:01:16,760
For small scale, that works fine.
39
00:01:16,760 --> 00:01:19,160
But imagine you want to analyze every sharepoint site
40
00:01:19,160 --> 00:01:20,600
in a 10,000 user company,
41
00:01:20,600 --> 00:01:22,880
even with batching it would take hours or days
42
00:01:22,880 --> 00:01:24,800
and you'd be fighting rate limits the whole way.
43
00:01:24,800 --> 00:01:26,080
If you need to do this regularly,
44
00:01:26,080 --> 00:01:27,880
it's simply not sustainable.
45
00:01:27,880 --> 00:01:29,680
This is why Graph Data Connect exists.
46
00:01:29,680 --> 00:01:31,400
It's not a replacement for the Graph API.
47
00:01:31,400 --> 00:01:33,600
It's a completely different tool for a different job.
48
00:01:33,600 --> 00:01:35,600
The Graph API handles a real time access
49
00:01:35,600 --> 00:01:38,280
to small amounts of data while Data Connect is built
50
00:01:38,280 --> 00:01:41,120
for bulk extraction at massive scale.
51
00:01:41,120 --> 00:01:43,120
What Graph Data Connect actually is?
52
00:01:43,120 --> 00:01:44,600
So what is Graph Data Connect?
53
00:01:44,600 --> 00:01:46,760
Let's clear up a common confusion first.
54
00:01:46,760 --> 00:01:50,520
Microsoft Graph is the gateway to all Microsoft 365 data.
55
00:01:50,520 --> 00:01:53,400
It covers users, messages, files, calendar, teams,
56
00:01:53,400 --> 00:01:54,400
and security signals.
57
00:01:54,400 --> 00:01:56,240
It's the single endpoint for everything,
58
00:01:56,240 --> 00:01:58,480
but there are three different ways to interact with that data
59
00:01:58,480 --> 00:01:59,800
and people often mix them up.
60
00:01:59,800 --> 00:02:01,200
First up is the Graph API.
61
00:02:01,200 --> 00:02:03,080
That's the real time request response model.
62
00:02:03,080 --> 00:02:04,800
You ask for a single user's mailbox
63
00:02:04,800 --> 00:02:06,600
and you get it back instantly.
64
00:02:06,600 --> 00:02:08,960
It's great for building apps and handling small queries,
65
00:02:08,960 --> 00:02:10,400
but it's not built for scale.
66
00:02:10,400 --> 00:02:11,520
Then we have Graph Connectors.
67
00:02:11,520 --> 00:02:14,160
These bring external data into Microsoft 365
68
00:02:14,160 --> 00:02:15,440
for search and co-pilot.
69
00:02:15,440 --> 00:02:16,680
It's ingestion.extraction.
70
00:02:16,680 --> 00:02:18,520
You're pulling data in, not pulling it out.
71
00:02:18,520 --> 00:02:20,520
And finally, there's Graph Data Connect.
72
00:02:20,520 --> 00:02:21,800
This is bulk extraction.
73
00:02:21,800 --> 00:02:24,640
It pulls massive data sets out of Microsoft 365
74
00:02:24,640 --> 00:02:26,280
into your own analytics environment.
75
00:02:26,280 --> 00:02:27,960
That's the one we're talking about today.
76
00:02:27,960 --> 00:02:28,760
Think of it this way.
77
00:02:28,760 --> 00:02:30,880
Using the Graph API is like asking a librarian
78
00:02:30,880 --> 00:02:32,040
for one book at a time.
79
00:02:32,040 --> 00:02:34,920
You walk up to the desk, ask for a book, they hand it to you,
80
00:02:34,920 --> 00:02:37,080
and then you walk back and ask for another.
81
00:02:37,080 --> 00:02:38,720
It works, but it's slow.
82
00:02:38,720 --> 00:02:40,280
Graph Data Connect is like saying,
83
00:02:40,280 --> 00:02:42,000
I want a copy of every book in this section
84
00:02:42,000 --> 00:02:44,280
and having them delivered to your office on a pallet.
85
00:02:44,280 --> 00:02:46,240
One request, one delivery, everything you need.
86
00:02:46,240 --> 00:02:47,760
So how does it actually work?
87
00:02:47,760 --> 00:02:49,040
You create a scheduled pipeline
88
00:02:49,040 --> 00:02:50,720
where you define what data you want,
89
00:02:50,720 --> 00:02:53,680
SharePoint sites, Teams, chats, Exchange mailboxes,
90
00:02:53,680 --> 00:02:56,160
and set a destination like an Azure storage account
91
00:02:56,160 --> 00:02:57,360
or a fabric lake house.
92
00:02:57,360 --> 00:02:59,680
Then Microsoft delivers that data as parking files
93
00:02:59,680 --> 00:03:02,600
directly into your storage, no pagination, no throttling,
94
00:03:02,600 --> 00:03:04,760
just one copy job, and it's done.
95
00:03:04,760 --> 00:03:06,560
The data arrives in Delta Parquet format,
96
00:03:06,560 --> 00:03:08,400
which is efficient and ready for analysis.
97
00:03:08,400 --> 00:03:11,120
You can query it with SQL, build Power BI reports,
98
00:03:11,120 --> 00:03:12,920
or run machine learning models.
99
00:03:12,920 --> 00:03:15,240
All of that comes from a single extraction pipeline.
100
00:03:15,240 --> 00:03:16,680
So that's the core idea.
101
00:03:16,680 --> 00:03:18,400
Graph Data Connect is for when you need
102
00:03:18,400 --> 00:03:21,320
to analyze your entire M365 data state,
103
00:03:21,320 --> 00:03:22,600
not just a small slice.
104
00:03:22,600 --> 00:03:24,600
Next, we'll talk about the security model
105
00:03:24,600 --> 00:03:26,760
that keeps your sensitive data safe,
106
00:03:26,760 --> 00:03:28,520
the security and governance layer.
107
00:03:28,520 --> 00:03:29,600
Now, you might be thinking,
108
00:03:29,600 --> 00:03:32,080
can I just dump everyone's emails into a storage account
109
00:03:32,080 --> 00:03:33,360
and do whatever I want?
110
00:03:33,360 --> 00:03:36,000
The answer is no, and here's why that's actually a good thing.
111
00:03:36,000 --> 00:03:38,000
Because Graph Data Connect handles sensitive data
112
00:03:38,000 --> 00:03:40,120
like emails, Teams, messages, and files,
113
00:03:40,120 --> 00:03:41,600
its security model is faster
114
00:03:41,600 --> 00:03:43,440
after than the regular Graph API.
115
00:03:43,440 --> 00:03:45,040
And that's by design, you don't want to tool
116
00:03:45,040 --> 00:03:46,920
this powerful without proper guardrails.
117
00:03:46,920 --> 00:03:49,360
First, it requires explicit admin consent.
118
00:03:49,360 --> 00:03:51,800
An administrator must approve each application
119
00:03:51,800 --> 00:03:54,600
and define exactly which data sets it can access.
120
00:03:54,600 --> 00:03:55,520
And I mean exactly.
121
00:03:55,520 --> 00:03:57,200
You can scope it down to the property level,
122
00:03:57,200 --> 00:03:59,000
want only site URLs, but not site owners,
123
00:03:59,000 --> 00:04:00,000
you can set that.
124
00:04:00,000 --> 00:04:01,800
Want only message timestamps, but not message content,
125
00:04:01,800 --> 00:04:03,960
you can set that to this is way more granular
126
00:04:03,960 --> 00:04:05,840
than standard Graph API permissions,
127
00:04:05,840 --> 00:04:07,120
which are usually all or nothing
128
00:04:07,120 --> 00:04:08,520
for a given resource type.
129
00:04:08,520 --> 00:04:11,560
Second, the data is encrypted in transit by default.
130
00:04:11,560 --> 00:04:14,040
Microsoft delivers it to your storage already encrypted,
131
00:04:14,040 --> 00:04:15,480
and if you want even more control,
132
00:04:15,480 --> 00:04:16,960
you can bring your own encryption keys
133
00:04:16,960 --> 00:04:18,200
through Azure Key Vault.
134
00:04:18,200 --> 00:04:19,320
Here's how it works.
135
00:04:19,320 --> 00:04:22,240
Your data gets encrypted with a key that only you hold.
136
00:04:22,240 --> 00:04:24,280
Microsoft stores the encrypted version of that key,
137
00:04:24,280 --> 00:04:25,480
but can't decrypt it.
138
00:04:25,480 --> 00:04:27,400
Only your application using your private key
139
00:04:27,400 --> 00:04:28,600
can unlock the data.
140
00:04:28,600 --> 00:04:31,760
This means even Microsoft can't read your data during delivery.
141
00:04:31,760 --> 00:04:34,440
Third, there's identity obfuscation.
142
00:04:34,440 --> 00:04:36,400
Real user IDs like email addresses
143
00:04:36,400 --> 00:04:38,120
and user principle names get replaced
144
00:04:38,120 --> 00:04:39,840
with non-reversible tokens.
145
00:04:39,840 --> 00:04:41,240
So you can still analyze trends,
146
00:04:41,240 --> 00:04:42,840
how many users access the file,
147
00:04:42,840 --> 00:04:44,600
or which department communicates most,
148
00:04:44,600 --> 00:04:46,960
but you can't tie that data back to a specific person.
149
00:04:46,960 --> 00:04:48,640
This is critical for privacy compliance,
150
00:04:48,640 --> 00:04:50,920
especially with regulations like GDPR.
151
00:04:50,920 --> 00:04:52,680
Fourth, every pipeline run is locked,
152
00:04:52,680 --> 00:04:55,560
creating a complete audit trail that shows who approved what,
153
00:04:55,560 --> 00:04:58,080
when data was extracted, which data sets were used,
154
00:04:58,080 --> 00:05:00,040
and how much data was transferred.
155
00:05:00,040 --> 00:05:02,800
If an auditor asks who accessed this data and why,
156
00:05:02,800 --> 00:05:03,800
you have the answer.
157
00:05:03,800 --> 00:05:06,360
This security layer is what makes data connect safe
158
00:05:06,360 --> 00:05:08,320
for regulated industries like healthcare,
159
00:05:08,320 --> 00:05:09,760
finance, and government.
160
00:05:09,760 --> 00:05:12,440
You get the analytics power without the compliance headache.
161
00:05:12,440 --> 00:05:13,920
The data never leaves your control,
162
00:05:13,920 --> 00:05:15,640
and every step is tracked.
163
00:05:15,640 --> 00:05:17,120
Where can the data go, sons?
164
00:05:17,120 --> 00:05:19,280
So once the data leaves Microsoft 365,
165
00:05:19,280 --> 00:05:20,320
where does it actually end up?
166
00:05:20,320 --> 00:05:22,800
Originally, graph data connect could only send data
167
00:05:22,800 --> 00:05:25,280
to Azure Synapse or Azure Data Lake Storage.
168
00:05:25,280 --> 00:05:27,080
That worked fine if you were a data engineer
169
00:05:27,080 --> 00:05:28,280
who lived in those tools.
170
00:05:28,280 --> 00:05:30,600
But if you were a business analyst or just starting out,
171
00:05:30,600 --> 00:05:32,280
it wasn't exactly friendly.
172
00:05:32,280 --> 00:05:33,680
Today that's changed.
173
00:05:33,680 --> 00:05:36,080
Data connect now works directly with Microsoft Fabric,
174
00:05:36,080 --> 00:05:38,800
and you can set a fabric lake house as your destination.
175
00:05:38,800 --> 00:05:40,880
The data shows up as Delta Park A files
176
00:05:40,880 --> 00:05:43,360
ready to analyze with no extra setup needed.
177
00:05:43,360 --> 00:05:44,720
If you're already using fabric,
178
00:05:44,720 --> 00:05:46,000
this is the simplest path,
179
00:05:46,000 --> 00:05:47,680
but you're not stuck with just fabric.
180
00:05:47,680 --> 00:05:49,720
You can also use Azure Data Factory Pipelines
181
00:05:49,720 --> 00:05:52,000
to manage the extraction, schedule it to run nightly,
182
00:05:52,000 --> 00:05:54,920
and your analytics environment always has fresh data.
183
00:05:54,920 --> 00:05:56,800
You can point it at Azure Blob Storage,
184
00:05:56,800 --> 00:05:59,480
Azure Data Lake, or any compatible destination.
185
00:05:59,480 --> 00:06:02,080
But here's the thing, you're not locked into one destination.
186
00:06:02,080 --> 00:06:04,040
Your options include Azure, Fabric,
187
00:06:04,040 --> 00:06:06,800
and even third-party platforms through custom pipelines.
188
00:06:06,800 --> 00:06:08,520
Once the data arrives, it's yours.
189
00:06:08,520 --> 00:06:10,360
You decide where it goes and what happens to it.
190
00:06:10,360 --> 00:06:12,040
That flexibility is what makes it valuable.
191
00:06:12,040 --> 00:06:15,760
You can combine M365 data with data from other systems,
192
00:06:15,760 --> 00:06:18,320
like your CRM, your ERP, your HR platform,
193
00:06:18,320 --> 00:06:20,960
and build one complete picture of your entire business.
194
00:06:20,960 --> 00:06:22,600
That's something you simply can't do
195
00:06:22,600 --> 00:06:24,720
with the regular Graph API alone.
196
00:06:24,720 --> 00:06:26,880
How it compares to other extraction tools.
197
00:06:26,880 --> 00:06:27,880
You might be thinking,
198
00:06:27,880 --> 00:06:30,440
can't I just use Power Automate or a custom script?
199
00:06:30,440 --> 00:06:33,720
Let's talk about when each tool works and when it doesn't.
200
00:06:33,720 --> 00:06:36,920
Power Automate is great for real-time, small-scale automation.
201
00:06:36,920 --> 00:06:38,840
You trigger a flow when a file is added,
202
00:06:38,840 --> 00:06:40,280
and it sends a notification.
203
00:06:40,280 --> 00:06:41,680
That works, but here's the thing.
204
00:06:41,680 --> 00:06:43,960
Power Automate handles kilobytes, not terabytes.
205
00:06:43,960 --> 00:06:45,680
It has no bulk extraction pattern,
206
00:06:45,680 --> 00:06:48,560
if you try to pull millions of records through a flow,
207
00:06:48,560 --> 00:06:52,480
it will time out, hit API limits, or just fail quietly.
208
00:06:52,480 --> 00:06:53,880
It's the wrong tool for this job.
209
00:06:53,880 --> 00:06:56,320
Custom Graph API scripts are fine for small data sets.
210
00:06:56,320 --> 00:06:58,400
You write a PowerShell script, loop through pages,
211
00:06:58,400 --> 00:06:59,360
and get your data.
212
00:06:59,360 --> 00:07:02,280
But pagination and throttling limits make it impractical
213
00:07:02,280 --> 00:07:03,680
for full-tenant analytics,
214
00:07:03,680 --> 00:07:05,600
because you'd need to manage retries, batching,
215
00:07:05,600 --> 00:07:07,000
and rate limits yourself.
216
00:07:07,000 --> 00:07:09,400
And if your script runs for hours and fails halfway through,
217
00:07:09,400 --> 00:07:10,760
good luck debugging that one.
218
00:07:10,760 --> 00:07:12,600
Azure Data Factory has over 90 connectors
219
00:07:12,600 --> 00:07:15,200
and is a solid choice for managing ETL pipelines.
220
00:07:15,200 --> 00:07:17,320
But ADF itself doesn't connect directly
221
00:07:17,320 --> 00:07:18,960
to M365 data at scale.
222
00:07:18,960 --> 00:07:20,440
It needs a source connector, and that's
223
00:07:20,440 --> 00:07:21,960
where data connect fills the gap.
224
00:07:21,960 --> 00:07:24,560
ADF becomes the manager, and data connect becomes the data
225
00:07:24,560 --> 00:07:25,240
source.
226
00:07:25,240 --> 00:07:26,960
Graph Data Connect is built specifically
227
00:07:26,960 --> 00:07:29,040
for bulk M365 data.
228
00:07:29,040 --> 00:07:30,880
One pipeline can extract millions of records.
229
00:07:30,880 --> 00:07:32,280
The trade-off is latency.
230
00:07:32,280 --> 00:07:34,520
Every pipeline run has about a 45 minute overhead
231
00:07:34,520 --> 00:07:35,800
before the data starts moving.
232
00:07:35,800 --> 00:07:37,240
So it's not for real-time dashboards.
233
00:07:37,240 --> 00:07:39,160
It's for scheduled, large-scale analytics
234
00:07:39,160 --> 00:07:40,760
that run nightly or weekly.
235
00:07:40,760 --> 00:07:41,680
Think of it this way.
236
00:07:41,680 --> 00:07:44,440
Power Automate is real-time, handled small data,
237
00:07:44,440 --> 00:07:45,280
and is low-code.
238
00:07:45,280 --> 00:07:47,840
The Graph API is real-time, handles medium data,
239
00:07:47,840 --> 00:07:49,280
and requires a developer.
240
00:07:49,280 --> 00:07:52,120
Graph Data Connect is scheduled, handles massive data,
241
00:07:52,120 --> 00:07:53,640
and requires admin consent.
242
00:07:53,640 --> 00:07:56,000
That's three different tools for three different jobs.
243
00:07:56,000 --> 00:07:58,160
If you need a real-time alert when a file changes,
244
00:07:58,160 --> 00:07:59,400
use Power Automate.
245
00:07:59,400 --> 00:08:00,960
If you need to analyze usage patterns
246
00:08:00,960 --> 00:08:03,240
across all your SharePoint sites every night,
247
00:08:03,240 --> 00:08:04,720
use Graph Data Connect.
248
00:08:04,720 --> 00:08:08,160
Don't try to make one tool do something it wasn't built for.
249
00:08:08,160 --> 00:08:09,720
Real-world use cases.
250
00:08:09,720 --> 00:08:11,560
So what does all this data actually let you do?
251
00:08:11,560 --> 00:08:13,560
Let me give you a few concrete examples.
252
00:08:13,560 --> 00:08:15,120
First up is security analytics.
253
00:08:15,120 --> 00:08:17,640
You can pull audit logs and activity data from Exchange
254
00:08:17,640 --> 00:08:19,800
and SharePoint, then run anomaly detection
255
00:08:19,800 --> 00:08:22,920
to spot compromised accounts or weird data access patterns.
256
00:08:22,920 --> 00:08:25,240
If an employee suddenly downloads thousands of files
257
00:08:25,240 --> 00:08:27,480
at 2 in the morning, you'd want to know about it.
258
00:08:27,480 --> 00:08:28,960
Data Connect gives you the raw data
259
00:08:28,960 --> 00:08:30,600
to build that kind of detection.
260
00:08:30,600 --> 00:08:32,600
Collaboration insights is another big one.
261
00:08:32,600 --> 00:08:35,120
By analyzing Teams messages and meeting data,
262
00:08:35,120 --> 00:08:37,200
you can see how Teams really work together.
263
00:08:37,200 --> 00:08:39,160
Which departments talk to each other most?
264
00:08:39,160 --> 00:08:40,920
Where are the bottlenecks in your workflow?
265
00:08:40,920 --> 00:08:41,960
You can answer questions like
266
00:08:41,960 --> 00:08:44,360
across functional Teams actually collaborating
267
00:08:44,360 --> 00:08:47,080
or just sitting in meetings without guessing.
268
00:08:47,080 --> 00:08:49,240
Then there's content management at scale.
269
00:08:49,240 --> 00:08:51,600
You can pull metadata from millions of SharePoint files,
270
00:08:51,600 --> 00:08:54,040
find stale content that hasn't been touched in years,
271
00:08:54,040 --> 00:08:56,160
identify duplicate files, eating up storage
272
00:08:56,160 --> 00:08:59,200
and flag documents with sensitive labels that shouldn't be there.
273
00:08:59,200 --> 00:09:01,560
That kind of data hygiene is impossible to do manually,
274
00:09:01,560 --> 00:09:03,560
but with Data Connect it's straightforward.
275
00:09:03,560 --> 00:09:05,600
Employee experience is a growing use case.
276
00:09:05,600 --> 00:09:07,840
Combine Viva Insights data with HR data
277
00:09:07,840 --> 00:09:09,000
to answer questions like,
278
00:09:09,000 --> 00:09:11,600
are Teams with frequent meetings more or less productive?
279
00:09:11,600 --> 00:09:13,280
The key is identity obfuscation.
280
00:09:13,280 --> 00:09:16,200
You can analyze patterns without exposing individual identities.
281
00:09:16,200 --> 00:09:18,120
So you get inside without the privacy risk
282
00:09:18,120 --> 00:09:20,000
and here's one that's becoming really important.
283
00:09:20,000 --> 00:09:21,120
Copilot readiness.
284
00:09:21,120 --> 00:09:22,760
Before you roll out Microsoft Copilot,
285
00:09:22,760 --> 00:09:24,640
you need to understand your data estate.
286
00:09:24,640 --> 00:09:25,720
Where does your data live?
287
00:09:25,720 --> 00:09:26,640
How is it organized?
288
00:09:26,640 --> 00:09:28,120
What permissions are in place?
289
00:09:28,120 --> 00:09:30,160
Data Connect can give you that inventory.
290
00:09:30,160 --> 00:09:32,240
You can see which sites have excessive permissions,
291
00:09:32,240 --> 00:09:35,280
which files are orphaned and where sensitive data might be exposed.
292
00:09:35,280 --> 00:09:36,520
Without that foundation,
293
00:09:36,520 --> 00:09:38,960
Copilot could surface things you'd rather it didn't.
294
00:09:38,960 --> 00:09:40,160
Here's a real example.
295
00:09:40,160 --> 00:09:43,160
The Polytechnic University of Milan used Data Connect
296
00:09:43,160 --> 00:09:46,600
to analyze employee sentiment at scale across thousands of users.
297
00:09:46,600 --> 00:09:48,160
They got objective granular data
298
00:09:48,160 --> 00:09:49,840
they couldn't have gotten any other way.
299
00:09:49,840 --> 00:09:52,160
No surveys, no bias, just real behavioral data
300
00:09:52,160 --> 00:09:53,600
from how people actually work.
301
00:09:53,600 --> 00:09:55,400
That's the power of this tool.
302
00:09:55,400 --> 00:09:57,120
A simple setup walkthrough.
303
00:09:57,120 --> 00:09:58,280
This might sound complicated,
304
00:09:58,280 --> 00:10:00,840
but the actual setup is surprisingly straightforward.
305
00:10:00,840 --> 00:10:02,120
Let me walk you through it.
306
00:10:02,120 --> 00:10:06,200
First, enable Graph Data Connect in the Microsoft 365 Admin Center.
307
00:10:06,200 --> 00:10:09,320
Go to org settings, find the Data Connect toggle, and turn it on.
308
00:10:09,320 --> 00:10:11,760
Then select which data sets you want to make available.
309
00:10:11,760 --> 00:10:14,000
SharePoint, OneDrive, Exchange, Teams.
310
00:10:14,000 --> 00:10:15,560
You can always add more later.
311
00:10:15,560 --> 00:10:19,080
Second, create an app registration in Microsoft Entra ID.
312
00:10:19,080 --> 00:10:20,880
This is your applications identity.
313
00:10:20,880 --> 00:10:23,000
Think of it like an ID badge for the pipeline.
314
00:10:23,000 --> 00:10:26,080
You'll need to note the app ID and generate a client secret.
315
00:10:26,080 --> 00:10:27,640
Keep that secret somewhere safe.
316
00:10:27,640 --> 00:10:30,080
You'll need it when you set up the connection.
317
00:10:30,080 --> 00:10:33,560
Third, create a Graph Data Connect application in the Azure portal.
318
00:10:33,560 --> 00:10:35,600
Link it to the app registration you just created,
319
00:10:35,600 --> 00:10:36,880
then choose your destination.
320
00:10:36,880 --> 00:10:39,960
For most beginners, a fabric lake house is the easiest option.
321
00:10:39,960 --> 00:10:42,880
No extra storage accounts to manage, no complex configuration.
322
00:10:42,880 --> 00:10:43,760
Just point and go.
323
00:10:43,760 --> 00:10:45,480
Fourth, this is the governance gate.
324
00:10:45,480 --> 00:10:49,360
Go back to the Microsoft 365 Admin Center and approve the application.
325
00:10:49,360 --> 00:10:52,640
And administrator reviews the requested data sets and permissions.
326
00:10:52,640 --> 00:10:57,000
What data will be accessed, which columns are included, and then gives consent.
327
00:10:57,000 --> 00:11:00,320
This step ensures nothing happens without explicit approval.
328
00:11:00,320 --> 00:11:03,680
Fifth, build a pipeline in fabric or Azure Data Factory.
329
00:11:03,680 --> 00:11:07,120
Use the copy activity with the Microsoft 365 source.
330
00:11:07,120 --> 00:11:08,280
Select your data set.
331
00:11:08,280 --> 00:11:10,160
For example, SharePoint sites basic.
332
00:11:10,160 --> 00:11:12,800
Configure a date filter if you only want recent data.
333
00:11:12,800 --> 00:11:13,920
Point it to your lake house.
334
00:11:13,920 --> 00:11:15,360
That's the bulk of the work done.
335
00:11:15,360 --> 00:11:16,560
Sixth, run the pipeline.
336
00:11:16,560 --> 00:11:17,360
Here's where you wait.
337
00:11:17,360 --> 00:11:19,280
There's about 45 minutes of initial preparation
338
00:11:19,280 --> 00:11:21,200
while Microsoft gets your data ready.
339
00:11:21,200 --> 00:11:23,880
After that, data streams in as Delta Park A files.
340
00:11:23,880 --> 00:11:24,840
And that's it.
341
00:11:24,840 --> 00:11:26,960
From there, you can query the data with SQL,
342
00:11:26,960 --> 00:11:30,200
build Power BI reports, or run machine learning models,
343
00:11:30,200 --> 00:11:33,640
all within fabric, limitations, and what to watch for.
344
00:11:33,800 --> 00:11:35,320
Before you run off to set this up,
345
00:11:35,320 --> 00:11:37,400
let me walk you through a few things to keep in mind.
346
00:11:37,400 --> 00:11:38,320
First, latency.
347
00:11:38,320 --> 00:11:39,960
That 45 minute overhead is real.
348
00:11:39,960 --> 00:11:42,320
So data connect is not for real time dashboards.
349
00:11:42,320 --> 00:11:45,680
If you need to see data updated every few minutes, this isn't your tool.
350
00:11:45,680 --> 00:11:48,680
It's designed for nightly or weekly analytics, so plan accordingly.
351
00:11:48,680 --> 00:11:50,080
Next, cross tenant access.
352
00:11:50,080 --> 00:11:53,320
You cannot pull data into a different Microsoft 365 tenant.
353
00:11:53,320 --> 00:11:55,280
The data stays inside your organizational boundary.
354
00:11:55,280 --> 00:11:57,480
If you're a consultant managing multiple tenants,
355
00:11:57,480 --> 00:11:59,640
you'll need separate pipelines for each one.
356
00:11:59,640 --> 00:12:02,040
Data set availability is another thing to watch.
357
00:12:02,040 --> 00:12:04,800
Not all M365 data is available through data connect.
358
00:12:04,800 --> 00:12:08,280
The basic data sets cover SharePoint, Exchange, Teams, and Groups.
359
00:12:08,280 --> 00:12:10,240
But some advanced properties may be missing.
360
00:12:10,240 --> 00:12:13,440
Check the documentation before you commit to a specific analysis.
361
00:12:13,440 --> 00:12:14,720
Now, costs.
362
00:12:14,720 --> 00:12:16,560
Data connect has consumption-based pricing.
363
00:12:16,560 --> 00:12:18,240
Your charge per object retrieved.
364
00:12:18,240 --> 00:12:19,920
For a small tenant, that's negligible.
365
00:12:19,920 --> 00:12:23,520
But for 100,000 user tenant with millions of files, it adds up fast.
366
00:12:23,520 --> 00:12:26,240
Budget accordingly and test with a small data set first.
367
00:12:26,240 --> 00:12:28,200
Approval process matters too.
368
00:12:28,200 --> 00:12:30,800
Every application needs explicit admin consent.
369
00:12:30,800 --> 00:12:34,320
And if you change the data set, so add new columns, you need to re-approved.
370
00:12:34,320 --> 00:12:36,840
Build that into your workflow so you're not caught off guard
371
00:12:36,840 --> 00:12:38,080
when a pipeline stops working.
372
00:12:38,080 --> 00:12:40,400
And one more thing, this isn't for citizen developers.
373
00:12:40,400 --> 00:12:44,040
Unlike power automate, data connect requires a data engineering mindset.
374
00:12:44,040 --> 00:12:48,160
You need to understand pipelines, storage formats like Parquet, and identity management.
375
00:12:48,160 --> 00:12:49,640
It's powerful, but it's not low-code.
376
00:12:49,640 --> 00:12:50,360
Bottom line.
377
00:12:50,360 --> 00:12:53,320
Graph data connect is a valuable tool for the right use case.
378
00:12:53,320 --> 00:12:57,000
Just know when to use it and when to reach for something simpler.
379
00:12:57,000 --> 00:12:58,160
So there you have it.
380
00:12:58,160 --> 00:13:00,520
Microsoft Graph Data Connect is the hidden pipeline
381
00:13:00,520 --> 00:13:04,240
that lets you extract M365 data at scale for real analytics.
382
00:13:04,240 --> 00:13:05,480
The key takeaway is simple.
383
00:13:05,480 --> 00:13:08,240
If you need to answer big picture questions about your organization,
384
00:13:08,240 --> 00:13:12,040
how people collaborate, where data lives, and what security risks exist,
385
00:13:12,040 --> 00:13:13,320
data connect is your tool.
386
00:13:13,320 --> 00:13:16,960
If you need real-time answers, use the Graph API or power automate.
387
00:13:16,960 --> 00:13:18,640
Different tools for different jobs.
388
00:13:18,640 --> 00:13:19,680
Here's what I'd suggest.
389
00:13:19,680 --> 00:13:24,080
Go to your Microsoft 365 admin center and check if Graph Data Connect is enabled.
390
00:13:24,080 --> 00:13:27,280
Even if you never use it knowing it's there and understanding how it works,
391
00:13:27,280 --> 00:13:29,320
puts a powerful tool in your back pocket.
392
00:13:29,320 --> 00:13:32,960
Next time, we'll explore how to combine this data with Microsoft Fabric
393
00:13:32,960 --> 00:13:34,720
for a complete analytics solution.
394
00:13:34,720 --> 00:13:38,080
If you enjoyed this episode, subscribe on your favorite podcast platform
395
00:13:38,080 --> 00:13:38,960
so you don't miss it.

Founder of m365.fm, m365.show and m365con.net
Mirko Peters is a Microsoft 365 expert, content creator, and founder of m365.fm, a platform dedicated to sharing practical insights on modern workplace technologies. His work focuses on Microsoft 365 governance, security, collaboration, and real-world implementation strategies.
Through his podcast and written content, Mirko provides hands-on guidance for IT professionals, architects, and business leaders navigating the complexities of Microsoft 365. He is known for translating complex topics into clear, actionable advice, often highlighting common mistakes and overlooked risks in real-world environments.
With a strong emphasis on community contribution and knowledge sharing, Mirko is actively building a platform that connects experts, shares experiences, and helps organizations get the most out of their Microsoft 365 investments.




