


 Apple Podcasts
 Spotify
 Youtube Music
 Spreaker
 Podchaser
 Amazon Music
 Power BI Copilot - Simply Explained


Power BI Copilot brings generative AI directly into Microsoft's business intelligence platform, making it easier for users to analyze data, build reports, and uncover insights using natural language. Instead of manually creating complex visualizations or writing DAX queries from scratch, users can ask questions in plain English and let Copilot generate charts, summaries, measures, and report suggestions.
This episode explains how Power BI Copilot works, where it delivers the most value, and why successful AI-powered analytics depend on far more than simply enabling a feature. You'll learn how clean data, well-designed semantic models, governance, and Microsoft Fabric create the foundation that allows Copilot to deliver accurate and trustworthy business insights.
The discussion also explores the current limitations of Power BI Copilot, including its reliance on high-quality data, the need for human validation, and scenarios where traditional BI expertise remains essential. Whether you're a business analyst, data professional, IT administrator, or executive, this episode provides a practical introduction to using AI in Power BI and explains how organizations can move from static dashboards to more intelligent, conversational analytics that support better decision-making.
Quick answer: Power BI Copilot is the focus of this M365 FM episode, which explains what it does, where it fits in the Microsoft ecosystem, and the architecture, security, governance, or operational choices that matter before teams adopt or manage it.
Imagine having an AI assistant that makes data analysis and report creation a breeze. That’s exactly what Power BI Copilot offers! This innovative tool integrates seamlessly with Microsoft Power BI, allowing you to interact with your data using simple, natural language commands. You no longer need to navigate complex syntax or spend hours crafting reports. Just tell Copilot what you need, and watch it transform your ideas into insightful reports. With its user-friendly approach, the power of data is now accessible to everyone!
Key Takeaways
- Power BI Copilot is an AI tool that simplifies data analysis and report creation using natural language commands.
- You can create reports quickly without needing coding skills. Just describe what you need, and Copilot does the rest.
- Copilot integrates well with Microsoft tools like Excel and Teams, making collaboration easier for teams.
- The tool can save you time, with reports generated in seconds and average time savings of up to 34.2% in content creation.
- Copilot helps you create visual reports easily, allowing you to focus on insights rather than technical details.
- Always review the outputs from Copilot for accuracy, especially for complex reports, as its accuracy can vary.
- Training your team on how to use Copilot effectively is crucial for maximizing its benefits.
- High-quality data models improve Copilot's performance, so ensure your data is well-structured and validated.
What Is Copilot?
Power BI Copilot is your intelligent assistant within the Power BI platform. It’s designed to make data analysis and report creation easier than ever. With Copilot, you can interact with your data using natural language, which means you don’t need to be a coding expert to get valuable insights. Just ask questions or describe what you need, and Copilot will handle the rest.
Key Features of Power BI Copilot
Power BI Copilot comes packed with features that set it apart from other AI tools. Here are some of the standout functionalities:
| Functionality | Description |
|---|---|
| Microsoft ecosystem integration | Provides native access to Excel, Teams, SharePoint, and Azure data sources, making it seamless for Microsoft 365 users. |
| Report summarization | Generates summaries of report pages and visual data, aiding executives in understanding dashboards quickly. |
| DAX assistance | Helps users generate DAX queries from natural language, simplifying the use of a complex formula language. |
| Conversational multi-turn | Supports back-and-forth interactions based on report context, enhancing user engagement and understanding. |
With these features, you can create reports and gain insights without needing technical expertise. For example, you can describe your needs in simple terms, and Copilot translates these into actionable data queries. This functionality streamlines your decision-making process by automatically generating reports with interactive visualizations.
Additionally, Power BI Copilot enhances workflow efficiency for business analysts. Here’s how:
- Simplified DAX Formula Creation: You can create DAX formulas without coding expertise, making data analysis accessible to more users.
- Efficient Data Model Changes: Copilot’s suggestions facilitate quick modifications to data models, promoting agile decision-making.
- Streamlined Visual Reporting: Adding visuals to reports is more intuitive, allowing you to create appealing reports without extensive technical knowledge.
- Faster Report Generation: Reports can be generated in seconds using natural language queries, enabling swift access to insights.
- Advanced Natural Language Reporting: You can ask complex questions and create detailed reports efficiently, fostering deeper analysis.
Power BI Copilot also supports collaboration among team members. You can work together in Power BI workspaces, allowing small teams to view content without formal publishing. Integration with Microsoft Teams enhances discussions about data while you view Power BI content, making your workflow smoother.
Benefits of Copilot for Power BI

Power BI Copilot transforms the way you create reports, making the process faster and more efficient. With its AI-driven capabilities, you can save significant time and effort. Imagine cutting down the hours you spend on report creation to just minutes! Here’s how Copilot helps you streamline your workflow:
Streamlining Report Creation
-
Time-Saving Capabilities: Power BI Copilot automates many tasks that typically consume your time. For instance, organizations have reported an average time savings of up to 34.2% in content creation alone. This means you can focus on analyzing data rather than getting bogged down in the details of report generation. Here’s a quick look at some average time savings across various tasks:
Task Average Time Savings (%) Meeting notes/summarization 18.6% Information search 29.8% Content creation 34.2% Email writing 20.0% Data analytics 20.6% 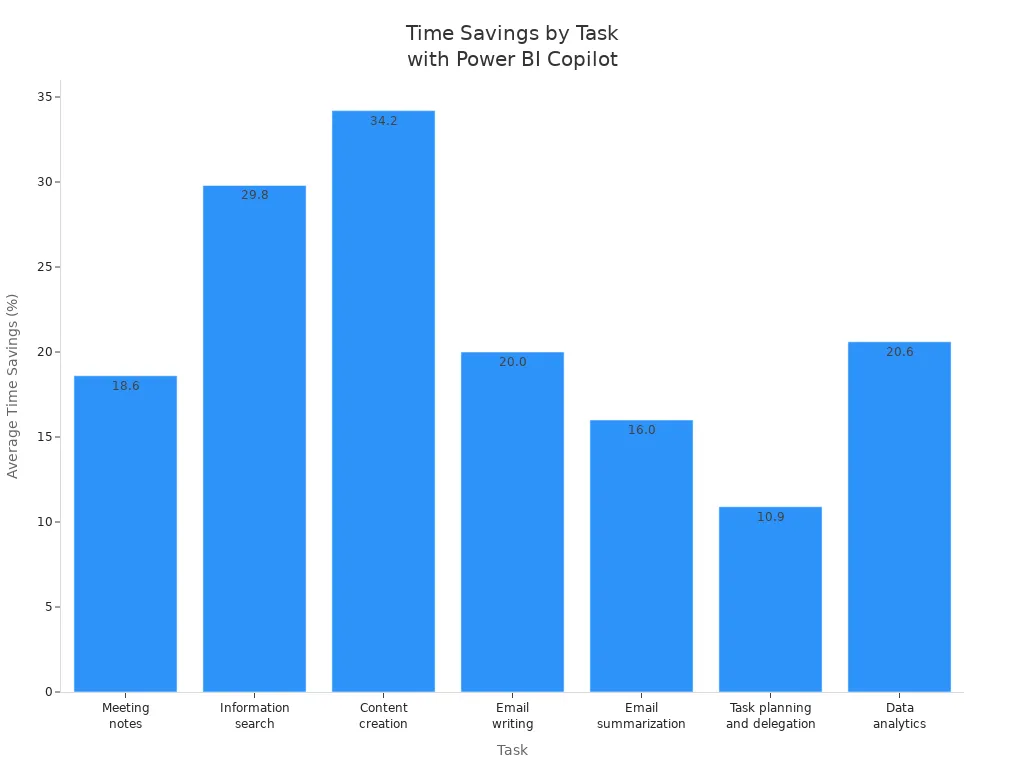
-
Enhanced User Experience: The user experience with Power BI Copilot is designed to be intuitive. You can ask questions in natural language, and Copilot provides instant visual answers. This feature eliminates the need for technical expertise, allowing you to dive straight into data insights. The AI also generates visualizations automatically, highlighting trends and anomalies without manual input. This means you can create visually appealing reports quickly and easily.
-
Improved Data Analysis: With Copilot, you gain access to context-aware insights that help you make informed decisions. The AI analyzes your data and offers recommendations based on what it finds. This capability not only speeds up your decision-making process but also enhances the quality of your analyses. You can trust that the insights you receive are relevant and actionable.
-
Automated Report Generation: Say goodbye to repetitive tasks! Power BI Copilot automates report generation, allowing you to focus on what matters most—your data. You can generate reports in seconds, which means you can respond to business needs faster than ever before. This efficiency is crucial in today’s fast-paced environment.
Preparing for Power BI Copilot

Getting ready to implement Power BI Copilot in your organization involves a few key steps. By following best practices, you can ensure a smooth transition and maximize the benefits of this powerful AI tool.
Best Practices for Implementation
System Requirements
Before diving into Power BI Copilot, make sure your system meets the necessary requirements. Here’s a quick overview:
| Requirement | Detail | Blocker? |
|---|---|---|
| Admin Access | Fabric tenant administrator role required to change tenant settings | Yes |
| Fabric Capacity | F2 or higher (Fabric) OR P1 or higher (Power BI Premium). Trial SKUs and trial capacities are not supported. | Yes |
| Supported Region | Tenant and capacity must be in a Microsoft Fabric-supported region. Check Microsoft’s regional availability list. | Yes |
| Cross-Region Processing | Required for tenants outside the US or France if Azure OpenAI is not available in the same region as your Fabric capacity | Conditional |
| Sovereign Cloud | Not supported in sovereign cloud environments (GCC, GCC High, DoD) due to GPU requirements | Hard limit |
| Power BI Desktop version | January 2025 or later required for the report view Copilot pane | Yes |
To get started, you’ll also need a Microsoft Fabric F64+ capacity or a Premium Per User (PPU) license. Ensuring these requirements are met will help you avoid any hiccups during implementation.
Training Resources
Training your team is crucial for successful adoption. Here are some effective training strategies:
| Training Type | Implementation Strategies | Real-World Example |
|---|---|---|
| Instructor-led training | - Kickoff sessions (30-90 min webinars) | A firm conducted general sessions for all staff and service-focused workshops for consultants. |
| - Department workshops (2-hour sessions) | 95% of attendees used Copilot within 48 hours of training. | |
| - Advanced masterclasses (deep-dive sessions) | ||
| Self-paced e-learning | - Micromodules (5-15 min lessons) | A healthcare organization built a tiered e-learning program for different staff roles. |
| - Learning paths (sequenced modules) | ||
| - Interactive tutorials (guided simulations) | ||
| Microlearning | - Daily tips (brief actionable tips) | A retail company created a campaign delivering a short tip each day, resulting in users trying 12 new functions. |
| - Quick guides (one-page PDFs) | ||
| - Video snippets (1-2 min demonstrations) | ||
| In-app guidance | - Contextual tips (pop-up hints) | A financial services firm implemented a digital adoption platform that increased usage by 36%. |
| - Guided workflows (step-by-step walkthroughs) | ||
| - Help panels (accessible guides) |
These training resources can help your team get up to speed quickly, ensuring they feel confident using Power BI Copilot.
Integration with Existing Tools
Integrating Power BI Copilot into your existing analytics workflows can present challenges. Here are some common issues to consider:
| Challenge Type | Description |
|---|---|
| Governance | Establish security groups and ensure users complete training before accessing Copilot. Roll out in phases for better management. |
| Preparation of Semantic Models | Invest time in preparing semantic models, including naming conventions and linguistic modeling, to avoid inaccurate outputs from Copilot. |
| Evaluation of Outputs | Copilot may produce inaccurate and inconsistent outputs; users should be prepared to evaluate and validate these results. |
By addressing these challenges upfront, you can create a more effective and efficient implementation process.
Limitations of Power BI Copilot
While Power BI Copilot is a powerful tool, it’s essential to recognize its limitations. Understanding these challenges can help you use the tool more effectively and avoid potential pitfalls.
Challenges to Consider
-
Potential Inaccuracies in Outputs: Even though Copilot can generate impressive insights, it doesn’t always get it right. In fact, the accuracy of its outputs can vary significantly. For standard patterns, you might see an accuracy rate of 85-90%. However, when dealing with complex scenarios, this drops to around 50-60%. If your data is well-modeled, you can expect about 70% accuracy. This means you should always review the results, especially for critical reports. Here’s a quick look at some common inaccuracies:
Scenario Type Accuracy Rate Standard Patterns 85-90% Complex Scenarios 50-60% Well-Modeled Data 70% You might encounter issues like incorrect measure selection or wrong aggregations. These inaccuracies highlight the importance of human oversight. Always double-check the outputs before sharing them with your team.
-
Reliance on Data Model Quality: The effectiveness of Power BI Copilot heavily depends on the quality of your data models. High-quality models, which include well-defined measures and meaningful metadata, enhance Copilot's performance. On the flip side, low-quality models can lead to inaccuracies and inefficiencies in the insights generated. To ensure you get the best results, consider implementing these strategies for high-quality data models:
Strategy Description Data Quality Checks Ensure referential integrity, data completeness, and business rule validation. Relationship Validation Test filter propagation, measure accuracy, and security implementations. Model Validation and Testing Validate performance and user acceptance through testing. Schema Design Recommend star schema structures for optimal data organization. Performance Optimization Identify opportunities to enhance model size and query performance. Security Design Implement proper data security measures. Scalability Planning Design models for future growth and requirements. By focusing on these strategies, you can improve the quality of your data models and, in turn, enhance the performance of Power BI Copilot.
Power BI Copilot truly transforms how you analyze data and create reports. With its user-friendly design, you can now access business intelligence tools without needing advanced technical skills. Here’s what makes it special:
- Self-Service Analytics: You can generate reports independently, freeing up data analysts for more complex tasks.
- Natural Language Processing: Just ask questions in plain English, and Copilot delivers insights in seconds.
- Enhanced Decision-Making: Real-time data analysis speeds up your decision-making process, making insights more accessible.
As you embrace Power BI Copilot, remember to engage critically with its outputs. Always verify the insights it provides to ensure accuracy. By doing so, you’ll harness the full potential of this powerful tool while fostering a culture of informed data-driven decisions.
FAQ
What is Power BI Copilot?
Power BI Copilot is an AI assistant integrated into Microsoft Power BI. It helps you analyze data and create reports using natural language commands, making data insights accessible to everyone.
How does Power BI Copilot improve report creation?
Copilot streamlines report creation by automating tasks, generating DAX formulas, and creating visualizations based on your descriptions. This saves you time and enhances your overall efficiency.
Can I use Power BI Copilot without coding skills?
Absolutely! You don’t need coding skills to use Power BI Copilot. Just describe what you need in plain language, and Copilot will handle the technical details for you.
Is Power BI Copilot suitable for beginners?
Yes! Power BI Copilot is designed for users of all skill levels. Its intuitive interface and natural language processing make it easy for beginners to create impactful reports.
How can I ensure accurate results from Power BI Copilot?
To get the best results, ensure your data models are well-structured and validated. Always review Copilot's outputs to confirm their accuracy before sharing insights.
What types of reports can I create with Power BI Copilot?
You can create various reports, including sales analysis, financial summaries, and performance dashboards. Copilot can generate visualizations and insights tailored to your specific needs.
Does Power BI Copilot integrate with other Microsoft tools?
Yes! Power BI Copilot integrates seamlessly with other Microsoft tools like Excel, Teams, and SharePoint, enhancing collaboration and data accessibility across your organization.
How can I get started with Power BI Copilot?
To start using Power BI Copilot, ensure your system meets the requirements, and consider training resources for your team. Once set up, you can begin exploring its features right away!
🎧 Listen to this episode
Want a practical explanation of Power BI Copilot? This episode breaks down the topic in clear language and shows why it matters for Microsoft 365, Azure, Power Platform, security, AI, and modern work.
Listen to this episode if you want to:
- Understand the key concepts behind Power BI Copilot
- See how it fits into the wider Microsoft technology ecosystem
- Learn where it can create practical value for your organization
You may also enjoy these related M365 FM episodes:
- Copilot for Dynamics 365 Finance and Operations - Simply Explained
- Copilot in Microsoft Entra ID - Simply Explained
- Copilot for Microsoft Fabric - Simply Explained
- Microsoft Security Copilot - Simply Explained
- Copilot in Business Central - Simply Explained
Discover more practical Microsoft conversations on M365 FM.
Last reviewed: July 2026.
Who Should Listen
This episode is for Microsoft administrators, architects, developers, security professionals, and business leaders who need a practical foundation before making implementation or governance decisions.
🎧 You Should Also Listen To
- AI Agents — A closely related next step that adds useful context and practical depth.
- Model Context Protocol — A closely related next step that adds useful context and practical depth.
- Microsoft Security Copilot — A closely related next step that adds useful context and practical depth.
🚀 Want to be part of m365.fm?
Then stop just listening… and start showing up.
👉 Connect with me on LinkedIn and let’s make something happen:
- 🎙️ Be a podcast guest and share your story
- 🎧 Host your own episode (yes, seriously)
- 💡 Pitch topics the community actually wants to hear
- 🌍 Build your personal brand in the Microsoft 365 space
This isn’t just a podcast — it’s a platform for people who take action.
🔥 Most people wait. The best ones don’t.
👉 Connect with me on LinkedIn and send me a message:
"I want in"
Let’s build something awesome 👊
1
00:00:00,000 --> 00:00:04,160
Today's topic is one almost everyone has heard of but few actually understand,
2
00:00:04,160 --> 00:00:06,280
Power BI Copilot.
3
00:00:06,280 --> 00:00:10,080
Microsoft markets it as this AI assistant that writes reports for you and on the surface,
4
00:00:10,080 --> 00:00:13,360
that's true, but the truth is more useful and a little dangerous.
5
00:00:13,360 --> 00:00:16,240
By the end of this episode, you'll know what Copilot actually does,
6
00:00:16,240 --> 00:00:19,000
where it falls short and how to use it without getting burned.
7
00:00:19,000 --> 00:00:23,600
Here's the thing, most beginners try it once, get a wrong answer, and never come back.
8
00:00:23,600 --> 00:00:25,880
You're going to avoid that trap.
9
00:00:25,880 --> 00:00:27,880
What exactly is Power BI Copilot?
10
00:00:27,880 --> 00:00:29,680
Let's start with the simplest definition.
11
00:00:29,680 --> 00:00:33,000
Copilot is Microsoft's AI assistant built right into Power BI.
12
00:00:33,000 --> 00:00:37,040
Think of it like having a coworker who knows DAX and report design sitting next to you.
13
00:00:37,040 --> 00:00:39,600
You tell them what you need and they help you get it done.
14
00:00:39,600 --> 00:00:42,760
Now Copilot uses the same tech as ChatGPT but here's the big difference.
15
00:00:42,760 --> 00:00:47,520
It's trained specifically on Power BI features and it's connected to your actual data model.
16
00:00:47,520 --> 00:00:51,200
So when you ask it something, it's not guessing based on generic internet knowledge.
17
00:00:51,200 --> 00:00:54,800
It's looking at your tables, your columns, your measures and your relationships.
18
00:00:54,800 --> 00:00:56,920
You'll find Copilot in two main places.
19
00:00:56,920 --> 00:01:01,360
In Power BI Desktop, there's a Copilot button in the ribbon that opens a Chat pane.
20
00:01:01,360 --> 00:01:05,360
In Power BI service, the web version, there's a similar Chat pane for asking questions about
21
00:01:05,360 --> 00:01:06,760
your published reports.
22
00:01:06,760 --> 00:01:08,160
But here's the key thing to know.
23
00:01:08,160 --> 00:01:10,640
Copilot can see your tables, columns, measures and relationships.
24
00:01:10,640 --> 00:01:13,040
It works with your data, not some generic data set.
25
00:01:13,040 --> 00:01:16,200
That's what makes it powerful and it's also what makes it tricky if your data model isn't
26
00:01:16,200 --> 00:01:17,200
well-organized.
27
00:01:17,200 --> 00:01:19,280
So what can you actually ask this thing to do?
28
00:01:19,280 --> 00:01:21,800
Let's break down the three main things it's good at.
29
00:01:21,800 --> 00:01:23,320
Copilot's three superpowers.
30
00:01:23,320 --> 00:01:25,800
Let's break down Copilot's three superpowers.
31
00:01:25,800 --> 00:01:28,040
The first one is probably the most popular.
32
00:01:28,040 --> 00:01:30,240
Writing DAX measures from plain English.
33
00:01:30,240 --> 00:01:34,040
You type something like create a measure for year-over-year sales growth and Copilot writes
34
00:01:34,040 --> 00:01:35,360
the formula for you.
35
00:01:35,360 --> 00:01:39,360
It generates the DAX, explains what each part does and gives you the steps to add it to your
36
00:01:39,360 --> 00:01:40,360
model.
37
00:01:40,360 --> 00:01:44,400
Prompts like, show total sales for last year, produce working time intelligence measures
38
00:01:44,400 --> 00:01:45,400
in seconds.
39
00:01:45,400 --> 00:01:46,400
Here's the thing.
40
00:01:46,400 --> 00:01:48,920
Copilot doesn't add measures directly to your model.
41
00:01:48,920 --> 00:01:52,440
It gives you the code and instructions to add it yourself, so you still need to copy
42
00:01:52,440 --> 00:01:53,440
and paste.
43
00:01:53,440 --> 00:01:58,160
This small price to pay for not having to remember the exact syntax for same period last year.
44
00:01:58,160 --> 00:02:01,040
Next up is generating entire report pages from a description.
45
00:02:01,040 --> 00:02:03,480
This is where Copilot really shines for report authors.
46
00:02:03,480 --> 00:02:04,680
You describe what you want.
47
00:02:04,680 --> 00:02:09,120
A sales performance overview with KPIs and a bar chart by region and Copilot builds
48
00:02:09,120 --> 00:02:10,120
it.
49
00:02:10,120 --> 00:02:13,880
It picks visual types, lays them out on the page, applies your report theme and even adds
50
00:02:13,880 --> 00:02:14,880
slices.
51
00:02:14,880 --> 00:02:17,720
Users find this is the feature that saves the most time.
52
00:02:17,720 --> 00:02:20,840
Instead of spending an hour dragging and dropping visuals, you can describe what you
53
00:02:20,840 --> 00:02:23,080
need and get a solid first draft in seconds.
54
00:02:23,080 --> 00:02:27,240
And the third superpower is for business users who don't want to dig through reports, answering
55
00:02:27,240 --> 00:02:29,680
questions about your data in plain English.
56
00:02:29,680 --> 00:02:33,440
Someone can ask what were our top products last quarter and get an answer with supporting
57
00:02:33,440 --> 00:02:34,440
visuals.
58
00:02:34,440 --> 00:02:36,760
Copilot can also generate narrative summaries.
59
00:02:36,760 --> 00:02:39,720
A paragraph that explains what the data on a page actually means.
60
00:02:39,720 --> 00:02:43,440
This is perfect for executive briefings or saving time writing report commentary.
61
00:02:43,440 --> 00:02:47,240
Instead of staring at a chart and trying to put it into words, you ask Copilot to summarize
62
00:02:47,240 --> 00:02:49,400
it and you've got your first draft.
63
00:02:49,400 --> 00:02:52,000
The big gotcha, confident, wrong answers.
64
00:02:52,000 --> 00:02:53,840
And all sounds amazing and it is.
65
00:02:53,840 --> 00:02:56,200
But here's the gotcha people don't talk about enough.
66
00:02:56,200 --> 00:02:59,720
Copilot can sound absolutely certain and be completely wrong at the same time.
67
00:02:59,720 --> 00:03:02,840
And because it sounds so confident, you might not think to double check it.
68
00:03:02,840 --> 00:03:04,120
Let me give you a real example.
69
00:03:04,120 --> 00:03:06,840
Someone asked Copilot what were total orders last month.
70
00:03:06,840 --> 00:03:10,640
And Copilot confidently returned 14,941.
71
00:03:10,640 --> 00:03:11,720
Sounds like a real number, right?
72
00:03:11,720 --> 00:03:13,920
The actual number for February was around 2000.
73
00:03:13,920 --> 00:03:15,720
So Copilot was off by about 13,000.
74
00:03:15,720 --> 00:03:19,120
When the person clicked through to the source, they found Copilot had pulled the all-time
75
00:03:19,120 --> 00:03:23,440
total from a headline on a completely different page, not February's figure at all.
76
00:03:23,440 --> 00:03:27,760
If you'd put that number in an email or a board presentation, you'd have a real problem.
77
00:03:27,760 --> 00:03:28,760
So why does this happen?
78
00:03:28,760 --> 00:03:29,920
It's not that Copilot is broken.
79
00:03:29,920 --> 00:03:32,640
It's that Copilot doesn't understand your data the way a human does.
80
00:03:32,640 --> 00:03:36,040
It's matching words in your question to words it finds in your report.
81
00:03:36,040 --> 00:03:38,760
Column names, page titles, chart labels.
82
00:03:38,760 --> 00:03:43,720
When you say total orders but your report labels the chart order volume, Copilot has to guess.
83
00:03:43,720 --> 00:03:44,960
Sometimes it guess is wrong.
84
00:03:44,960 --> 00:03:46,120
There's another issue too.
85
00:03:46,120 --> 00:03:48,680
The same question asked twice can give you different answers.
86
00:03:48,680 --> 00:03:51,840
Copilot is what they call non-deterministic.
87
00:03:51,840 --> 00:03:54,720
The output varies even with identical input.
88
00:03:54,720 --> 00:03:57,400
One session you ask, which manager is struggling?
89
00:03:57,400 --> 00:04:00,040
And you get a useful breakdown with names and numbers.
90
00:04:00,040 --> 00:04:01,440
Next session, same question.
91
00:04:01,440 --> 00:04:03,280
And Copilot asks for clarification.
92
00:04:03,280 --> 00:04:04,760
What do you mean by struggling?
93
00:04:04,760 --> 00:04:06,800
Third session, it gets blocked entirely.
94
00:04:06,800 --> 00:04:08,400
Same question, three different outcomes.
95
00:04:08,400 --> 00:04:09,400
That's a confusing pattern.
96
00:04:09,400 --> 00:04:11,480
For something like dinner ideas, that's fine.
97
00:04:11,480 --> 00:04:14,640
But when you're dealing with revenue figures or SLA numbers, you're presenting to your
98
00:04:14,640 --> 00:04:17,480
board, you need the same answer every single time.
99
00:04:17,480 --> 00:04:19,880
So how do you get consistent reliable answers?
100
00:04:19,880 --> 00:04:22,920
The key is in how you phrase your questions.
101
00:04:22,920 --> 00:04:24,680
How to ask Copilot the right way?
102
00:04:24,680 --> 00:04:26,080
Here's the key insight.
103
00:04:26,080 --> 00:04:28,120
Use the exact words that are already in your report.
104
00:04:28,120 --> 00:04:32,120
If your report calls something order volume and rag status, then those are the terms you
105
00:04:32,120 --> 00:04:33,440
need to type in.
106
00:04:33,440 --> 00:04:35,120
Don't rephrase into everyday language.
107
00:04:35,120 --> 00:04:37,360
Copilot matches vocabulary, not meaning.
108
00:04:37,360 --> 00:04:41,160
So a specific question using the report's own language gets you a consistent correct answer
109
00:04:41,160 --> 00:04:42,160
every time.
110
00:04:42,160 --> 00:04:43,440
Let me show you what that looks like.
111
00:04:43,440 --> 00:04:46,440
A vague question like, what were total orders last month?
112
00:04:46,440 --> 00:04:48,520
That's you that wrong answer we saw earlier.
113
00:04:48,520 --> 00:04:53,880
But a specific question using the reports own words, what was order volume for March 2026,
114
00:04:53,880 --> 00:04:56,480
gets you the correct answer you can actually verify.
115
00:04:56,480 --> 00:04:59,520
Same intent, different wording, completely different result.
116
00:04:59,520 --> 00:05:02,760
Another tip, be specific about visual types and data fields.
117
00:05:02,760 --> 00:05:07,720
Instead of saying show me sales, try create a column chart showing monthly sales for 2024
118
00:05:07,720 --> 00:05:08,920
with data labels.
119
00:05:08,920 --> 00:05:12,280
The more context you give, the less room Copilot has to guess what you want.
120
00:05:12,280 --> 00:05:15,240
You're basically narrowing the field of possible answers.
121
00:05:15,240 --> 00:05:17,240
And here's something a lot of people miss.
122
00:05:17,240 --> 00:05:18,600
Copilot supports conversation.
123
00:05:18,600 --> 00:05:21,960
If the first result isn't quite right, ask it to adjust.
124
00:05:21,960 --> 00:05:25,800
Change the time period to quarterly or sort from highest to lowest.
125
00:05:25,800 --> 00:05:28,400
Treat it like a colleague who needs clear instructions.
126
00:05:28,400 --> 00:05:30,760
That back and forth is where you get the best results.
127
00:05:30,760 --> 00:05:35,000
But there are also things Copilot simply cannot do, no matter how well you ask.
128
00:05:35,000 --> 00:05:36,600
What Copilot cannot do.
129
00:05:36,600 --> 00:05:41,080
Let's talk about the limits, because knowing what Copilot can't do saves you a lot of frustration.
130
00:05:41,080 --> 00:05:42,840
First, it cannot forecast future numbers.
131
00:05:42,840 --> 00:05:46,080
If you ask how many orders will we get next month, Copilot will tell you it can't predict
132
00:05:46,080 --> 00:05:47,080
the future.
133
00:05:47,080 --> 00:05:49,600
It only works with data that already exists in your model.
134
00:05:49,600 --> 00:05:53,360
It can show historical patterns as a rough guide, but no predictions.
135
00:05:53,360 --> 00:05:57,680
So if you need a forecast, you're still looking at Power BI's native forecasting features
136
00:05:57,680 --> 00:05:59,080
or a separate tool.
137
00:05:59,080 --> 00:06:02,520
Second, it cannot tell you why something happened.
138
00:06:02,520 --> 00:06:04,320
Why did delivery spike in August?
139
00:06:04,320 --> 00:06:05,480
Copilot can't answer that.
140
00:06:05,480 --> 00:06:09,600
It can show you the numbers, but causal explanations require human business context.
141
00:06:09,600 --> 00:06:10,600
Maybe there was a promotion.
142
00:06:10,600 --> 00:06:11,600
Maybe a supplier changed.
143
00:06:11,600 --> 00:06:12,800
Copilot doesn't know that.
144
00:06:12,800 --> 00:06:16,360
It can show you the data, but the story behind it is still your job.
145
00:06:16,360 --> 00:06:18,200
Third, it cannot fix bad data.
146
00:06:18,200 --> 00:06:23,400
If your source data has errors, missing values or inconsistent naming, Copilot can't magically
147
00:06:23,400 --> 00:06:24,400
clean it.
148
00:06:24,400 --> 00:06:25,400
Here's the thing.
149
00:06:25,400 --> 00:06:27,440
Copilot is only as good as your semantic model.
150
00:06:27,440 --> 00:06:29,320
Garbage in, garbage out, same as any tool.
151
00:06:29,320 --> 00:06:33,480
If your data is a mess, Copilot will give you confident wrong answers based on that mess.
152
00:06:33,480 --> 00:06:37,240
And fourth, it cannot make major formatting or layout changes.
153
00:06:37,240 --> 00:06:41,680
It's difficult to change the bar color to blue and it will give you manual instructions instead
154
00:06:41,680 --> 00:06:42,680
of doing it.
155
00:06:42,680 --> 00:06:46,480
Visual customization still requires you to use Power BI's formatting panels.
156
00:06:46,480 --> 00:06:50,440
So for the polished presentation ready stuff, you're still doing the work.
157
00:06:50,440 --> 00:06:53,480
So if Copilot has all these limitations, is it still worth using?
158
00:06:53,480 --> 00:06:54,480
Absolutely.
159
00:06:54,480 --> 00:06:56,840
If you set it up for success.
160
00:06:56,840 --> 00:06:58,600
What makes Copilot work well?
161
00:06:58,600 --> 00:07:00,040
Your data model matters most.
162
00:07:00,040 --> 00:07:03,600
Clean table names, clear columns and proper relationships are what Copilot reads.
163
00:07:03,600 --> 00:07:06,040
If your model is messy, Copilot will be messy.
164
00:07:06,040 --> 00:07:07,040
There's no way around it.
165
00:07:07,040 --> 00:07:08,520
What does that mean for you?
166
00:07:08,520 --> 00:07:09,840
Use names people actually say.
167
00:07:09,840 --> 00:07:12,520
A field called Revenue is useless to Copilot.
168
00:07:12,520 --> 00:07:14,000
Rename it to net revenue.
169
00:07:14,000 --> 00:07:16,840
Now Copilot understands when someone asks about revenue.
170
00:07:16,840 --> 00:07:18,920
This helps every human who uses the report too.
171
00:07:18,920 --> 00:07:21,160
It's one of those fixes that pays off everywhere.
172
00:07:21,160 --> 00:07:24,000
There's a feature in Power BI called Prep Data for AI.
173
00:07:24,000 --> 00:07:26,600
It lets you simplify the schema and add instructions.
174
00:07:26,600 --> 00:07:29,280
You tell Copilot which tables and measures matter.
175
00:07:29,280 --> 00:07:32,640
You add context like Geography is used for borrow analysis.
176
00:07:32,640 --> 00:07:37,720
That dramatically improves answer quality because you're teaching Copilot how your data works.
177
00:07:37,720 --> 00:07:41,760
A small investment of time makes everything Copilot does more reliable.
178
00:07:41,760 --> 00:07:43,720
Here's the most practical advice I can give.
179
00:07:43,720 --> 00:07:45,240
Start small and validate everything.
180
00:07:45,240 --> 00:07:49,040
Don't ask Copilot to build your entire executive dashboard on the first try.
181
00:07:49,040 --> 00:07:51,080
Start with one measure or one visual.
182
00:07:51,080 --> 00:07:52,080
Verify it.
183
00:07:52,080 --> 00:07:53,080
Then expand.
184
00:07:53,080 --> 00:07:56,240
Users who treat Copilot as a drafting assistant rather than a finished product have
185
00:07:56,240 --> 00:07:57,520
much better results.
186
00:07:57,520 --> 00:08:00,240
They don't get burned because they're not trusting it blindly.
187
00:08:00,240 --> 00:08:02,080
This is all stuff you can do today.
188
00:08:02,080 --> 00:08:06,640
There's a bigger question here about what Copilot means for you as someone learning Power BI.
189
00:08:06,640 --> 00:08:10,040
What Copilot means for beginners and citizen developers.
190
00:08:10,040 --> 00:08:13,360
So what does all this mean for you as someone learning Power BI?
191
00:08:13,360 --> 00:08:16,400
The short answer is that Copilot lowers the barrier to entry.
192
00:08:16,400 --> 00:08:17,400
And that's a good thing.
193
00:08:17,400 --> 00:08:21,080
You don't need to memorize DAX syntax to start building useful reports anymore.
194
00:08:21,080 --> 00:08:24,400
You can describe what you want in plain English and see working examples right away.
195
00:08:24,400 --> 00:08:26,960
Think of Copilot as both an assistant and a teacher.
196
00:08:26,960 --> 00:08:27,960
It's both at once.
197
00:08:27,960 --> 00:08:29,200
It teaches you as you go.
198
00:08:29,200 --> 00:08:32,640
When Copilot generates a DAX formula, it also explains what each part does.
199
00:08:32,640 --> 00:08:37,160
You see the code, you read the explanation, and over time you start recognizing patterns.
200
00:08:37,160 --> 00:08:40,600
You learn what calculate does, how filter works, and how time intelligence functions like
201
00:08:40,600 --> 00:08:42,800
same period last year fit together.
202
00:08:42,800 --> 00:08:46,200
You're learning by doing which is the most effective way to pick up a new skill.
203
00:08:46,200 --> 00:08:50,560
Instead of reading a textbook on DAX, you're writing real measures and seeing how they behave.
204
00:08:50,560 --> 00:08:52,080
But here's the part that matters.
205
00:08:52,080 --> 00:08:54,720
Copilot doesn't replace the need to understand your data.
206
00:08:54,720 --> 00:08:57,920
It can write the formula, but you still need to know if the result is reasonable.
207
00:08:57,920 --> 00:09:01,520
It can build the chart, but you need to know if it tells the right story.
208
00:09:01,520 --> 00:09:02,840
Validation is still your job.
209
00:09:02,840 --> 00:09:05,240
Copilot is a tool, not a replacement for thinking.
210
00:09:05,240 --> 00:09:06,760
The risk is over reliance.
211
00:09:06,760 --> 00:09:09,720
Beginners who trust Copilot completely are the ones who get burned.
212
00:09:09,720 --> 00:09:12,880
That confident wrong answer problem we talked about earlier hits hardest when you don't
213
00:09:12,880 --> 00:09:13,880
know enough to spot it.
214
00:09:13,880 --> 00:09:17,880
If you've never seen a revenue report before, you might not realize that 14,1441 is way
215
00:09:17,880 --> 00:09:19,160
too high for one month.
216
00:09:19,160 --> 00:09:23,000
The right approach is to use Copilot as an accelerator, not a crutch.
217
00:09:23,000 --> 00:09:26,280
Let it speed you up, but don't let it think for you.
218
00:09:26,280 --> 00:09:27,280
Practical framework.
219
00:09:27,280 --> 00:09:28,920
How to use Copilot today.
220
00:09:28,920 --> 00:09:32,320
So how do you actually use Copilot in Power BI without getting burned?
221
00:09:32,320 --> 00:09:34,680
Think of it as a brilliant but forgetful junior analyst.
222
00:09:34,680 --> 00:09:38,040
It can draft reports in seconds, but you still need to supervise the work.
223
00:09:38,040 --> 00:09:40,080
Here are four principles to keep in mind.
224
00:09:40,080 --> 00:09:41,840
First, always verify the numbers.
225
00:09:41,840 --> 00:09:45,040
Copilot typically gives you a click through link to the source visual it used.
226
00:09:45,040 --> 00:09:48,360
Click that link, confirm the number matches, every single time.
227
00:09:48,360 --> 00:09:50,520
If it can't show you a source, be skeptical.
228
00:09:50,520 --> 00:09:52,840
That's your first warning sign that something might be wrong.
229
00:09:52,840 --> 00:09:55,240
Next, use Copilot for what it does best.
230
00:09:55,240 --> 00:09:59,160
Using DAX measures, generating starter report pages, creating narrative summaries, those
231
00:09:59,160 --> 00:10:00,560
are its strengths.
232
00:10:00,560 --> 00:10:04,360
Complex calculations, causal analysis or anything that requires business judgment, keep
233
00:10:04,360 --> 00:10:05,600
those for yourself.
234
00:10:05,600 --> 00:10:07,040
That territory is still yours.
235
00:10:07,040 --> 00:10:10,640
Also, invest in your data model before you ask Copilot anything.
236
00:10:10,640 --> 00:10:14,200
Clean up table and column names, set clear relationships between tables.
237
00:10:14,200 --> 00:10:17,240
Use the prep data for AI feature to add instructions.
238
00:10:17,240 --> 00:10:20,680
Every hour you spend here pays back 10 in Copilot accuracy.
239
00:10:20,680 --> 00:10:24,920
A well structured model is the single biggest factor in getting reliable answers.
240
00:10:24,920 --> 00:10:27,960
Finally, treat everything Copilot gives you as a rough draft.
241
00:10:27,960 --> 00:10:29,960
It's a starting point, not a finished product.
242
00:10:29,960 --> 00:10:34,040
Refine it manually, test it with different filters, and make sure it behaves correctly in
243
00:10:34,040 --> 00:10:35,920
all the scenarios you care about.
244
00:10:35,920 --> 00:10:37,400
Then promote it to production.
245
00:10:37,400 --> 00:10:40,680
That one habit will save you from the most embarrassing mistakes.
246
00:10:40,680 --> 00:10:42,440
So here's what you need to take away.
247
00:10:42,440 --> 00:10:46,640
Copilot is a powerful drafting assistant for your DAX, reports and data questions.
248
00:10:46,640 --> 00:10:47,880
But it comes with a catch.
249
00:10:47,880 --> 00:10:51,160
It sounds confident even when it's wrong, and it needs a clean data model and specific
250
00:10:51,160 --> 00:10:52,680
prompts to work reliably.
251
00:10:52,680 --> 00:10:53,920
Your homework is simple.
252
00:10:53,920 --> 00:10:58,560
In Power BI, clean up your main reports column names, and ask Copilot to write one measure
253
00:10:58,560 --> 00:10:59,560
you've been avoiding.
254
00:10:59,560 --> 00:11:01,360
Most people will just watch this and move on.
255
00:11:01,360 --> 00:11:04,000
You have a chance to actually try it and see the difference.
256
00:11:04,000 --> 00:11:07,360
If this helped, subscribe and share it with someone starting their Power BI journey.

Founder of m365.fm, m365.show and m365con.net
Mirko Peters is a Microsoft 365 expert, content creator, and founder of m365.fm, a platform dedicated to sharing practical insights on modern workplace technologies. His work focuses on Microsoft 365 governance, security, collaboration, and real-world implementation strategies.
Through his podcast and written content, Mirko provides hands-on guidance for IT professionals, architects, and business leaders navigating the complexities of Microsoft 365. He is known for translating complex topics into clear, actionable advice, often highlighting common mistakes and overlooked risks in real-world environments.
With a strong emphasis on community contribution and knowledge sharing, Mirko is actively building a platform that connects experts, shares experiences, and helps organizations get the most out of their Microsoft 365 investments.




