


 Apple Podcasts
 Spotify
 Youtube Music
 Spreaker
 Podchaser
 Amazon Music
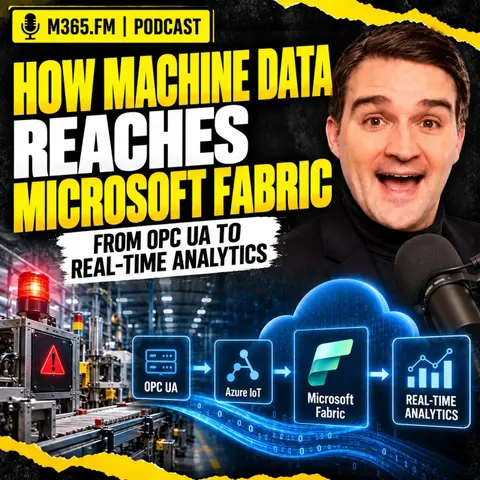
 How Machine Data Reaches Microsoft Fabric - From OPC UA to Real-Time Analytics

Key Takeaways
- Fast telemetry pipelines from the factory floor are only the beginning; raw machine data lacks immediate business context until linked with MES, ERP, and maintenance systems.
- OPC UA provides a standardized industrial interface exposing variables, alarms, and methods, but a tag name alone is never a complete data model.
- The edge layer should collect, filter, normalize, and buffer data, but it must never guess production meaning that belongs in higher-level systems.
- Choosing between Azure IoT Edge and Azure IoT Operations depends on your site-level operating model and readiness to support Kubernetes and Arc-enabled environments.
- MQTT acts as a powerful factory event backbone, but it requires a unified namespace with clear governance to ensure consistent asset identification and payload structure.
- Maintaining both source and arrival timestamps, along with data quality codes, prevents misleading analytics during network delays or sensor failures.
Getting machine alarms, sensor values, production counters, and fault events into the cloud is easier than ever. OPC UA exposes the machine signal, an edge layer collects it, MQTT can distribute it locally, and Microsoft Fabric can ingest and analyze the resulting stream. The difficult part starts after the data arrives: how do you turn raw telemetry into enough production context to support an actual decision?
This episode follows one machine signal from the factory floor through the Microsoft industrial data stack. It starts with OPC UA, moves through the edge and MQTT, crosses securely into Azure and Microsoft Fabric, and then looks at how Eventstream, Eventhouse, KQL, Lakehouse, Power BI, MES, ERP, maintenance data, and production context fit together. The goal is not simply to show another telemetry pipeline. It is to explain what has to happen before machine data becomes useful for production, maintenance, quality, and planning.
FROM MACHINE STOPPAGE TO PRODUCTION CONSEQUENCE
A machine stoppage looks simple at the controller level. The state changes from running to faulted, a fault code appears, the part counter stops, and perhaps other values change around the same time. That information is useful, but production usually asks a different question: which work order is affected, how much quantity remains, can another machine take over, and does this delay threaten a delivery?
The machine understands its own condition, but it does not automatically understand the business consequence. MES may know the operation and work order. ERP may know the due date and demand. Maintenance may understand the equipment history. Quality may determine whether output can still be used. That is why a fast telemetry pipeline is only the beginning of the architecture.
OPC UA — WHERE THE SIGNAL ENTERS THE DATA PATH
OPC UA provides a standardized industrial interface for accessing information from equipment without requiring every cloud application to understand proprietary controller protocols. A server can expose variables, machine states, alarms, events, methods, timestamps, quality information, and sometimes structured equipment models.
That structure matters because a useful industrial event should carry more than a numeric value. Source timestamps, server timestamps, quality status, units, source identity, and the original OPC UA node information can all become important later when somebody asks where a number came from or why a production calculation looks wrong.
The episode also emphasizes that a tag name is not a data model. A field called “temperature” or “machine state” still needs context such as the asset, engineering unit, allowed range, state definition, and the production situation in which the signal was observed.
KEEP THE OT BOUNDARY CONTROLLED
Machine connectivity should not turn the production network into an extension of the corporate or cloud environment. Industrial networks need controlled boundaries, typically including segmentation and an industrial DMZ, so that approved edge systems can communicate with equipment without giving enterprise applications direct access to controllers.
The recommended pattern is generally outbound-oriented. The edge layer connects to approved OPC UA endpoints and then sends selected information toward cloud services through controlled destinations, ports, protocols, and identities. Analytics platforms should receive data without inheriting broad rights to browse or modify production systems.
Certificates, firewall rules, trust relationships, expiry handling, and ownership also need to be treated as operational processes rather than one-time configuration work.
THE EDGE SHOULD IMPROVE DATA — NOT INVENT BUSINESS MEANING
The edge layer sits between the machine environment and the wider data platform. Its first responsibility is connection, but it can also filter, normalize, buffer, enrich, and route the information before it leaves the plant.
Useful edge responsibilities include:
• Selecting only signals required for defined use cases
• Filtering unnecessary high-frequency data
• Applying agreed unit conversions
• Preserving source timestamps and quality indicators
• Adding stable site, line, and asset identifiers
• Buffering during cloud outages
• Handling retry and back-pressure behavior
• Exposing connector and queue health
• Performing selected local calculations or AI inference where latency or disconnected operation requires it
The important boundary is that the edge should add facts it knows with confidence. It should not guess which production order is active based on stale information or quietly create business context that belongs to MES, ERP, planning, or quality systems.
AZURE IOT EDGE VS AZURE IOT OPERATIONS
The episode compares two Microsoft approaches for running industrial edge workloads.
Azure IoT Edge works well when the requirement is focused around a gateway or individual device. Containerized modules can collect data, apply local logic, buffer information, and send it upstream through Azure IoT Hub. This can be a practical choice for a defined cell or smaller workload where the organization wants a lighter operating footprint.
Azure IoT Operations is positioned more as a site-level industrial data environment. It runs on an Azure Arc-enabled Kubernetes environment and includes capabilities around OPC UA connectivity, MQTT, data flows, and asset or device management. That can make more sense when a site has several lines, multiple machine vendors, local consumers, and a need to repeat a governed edge pattern across plants.
The decision should not be based on which platform has the longest feature list. It should be based on the operating model the organization is prepared to support. Azure IoT Operations provides broader site-level capabilities, but it also introduces Kubernetes, Arc, cluster operations, monitoring, storage, patching, and recovery responsibilities.
MQTT AS THE FACTORY EVENT BACKBONE
When several consumers need the same machine events, MQTT can dramatically simplify the architecture. The machine connector publishes once to a broker, and maintenance applications, local historians, cloud data flows, or other approved consumers subscribe independently.
That removes many point-to-point dependencies. A new application can subscribe to an approved topic without creating another direct link into the PLC or OPC UA server.
Topic design still matters. A hierarchy can represent site, area, line, cell, and asset, but the topic should not become the entire data model. Important facts such as event identity, source timestamp, asset ID, quality, contract version, and event type should remain in the message payload so the event stays understandable even when stored, replayed, or routed elsewhere.
THE UNIFIED NAMESPACE IS A CONTRACT — NOT JUST A TOPIC TREE
The Unified Namespace pattern can provide a shared operational contract across industrial systems. The useful part is not simply having one huge MQTT hierarchy. The value comes from agreeing how assets are identified, how events are shaped, who owns the data, how schemas change, and which systems are authoritative for different facts.
A good Unified Namespace can provide a stable way to identify assets and publish governed operational events while allowing source systems to keep ownership of their own records.
That contract should define things such as:
• Asset identity
• Event types
• Message shape
• Timestamp rules
• Quality information
• Ownership
• Security
• Versioning
• Change management
MQTT can transport the contract, but MQTT does not create the contract.
FROM OPC UA NOTIFICATION TO MQTT EVENT
Turning an OPC UA notification into an MQTT event is more than protocol translation. The connector needs to preserve evidence from the industrial source while transforming the message into a format that downstream systems can understand.
For a state event, that could include a stable asset ID, signal name, value, source time, source quality, event type, and the original OPC UA node reference. For an alarm, additional fields might include fault code, severity, and source text where appropriate.
Different event types should remain distinct. Machine state, fault events, production counts, quality rejects, and condition measurements are not all the same type of telemetry and should not be forced into a vague generic record if consumers need different behavior.
THE PACKAGING CELL EXAMPLE
The episode uses a packaging cell to show why context matters even when the source signals appear simple. Machine state, good count, reject count, speed, and fault information may look straightforward, but each needs interpretation.
A zero speed can mean failure, planned changeover, waiting for material, or another expected condition. A reject counter may not identify which product or inspection point caused the rejection. A machine speed value means very little without the product-specific expected speed. A fault code may help maintenance but still does not explain the impact on the current order.
The design therefore needs explicit states, source evidence, timestamps, and links to the production context that will be added later.
Become a supporter of this podcast: https://www.spreaker.com/podcast/m365-fm-a-microsoft-mvp-podcast-by-mirko-peters--6704921/support.
🚀 Want to be part of m365.fm?
Then stop just listening… and start showing up.
👉 Connect with me on LinkedIn and let’s make something happen:
- 🎙️ Be a podcast guest and share your story
- 🎧 Host your own episode (yes, seriously)
- 💡 Pitch topics the community actually wants to hear
- 🌍 Build your personal brand in the Microsoft 365 space
This isn’t just a podcast — it’s a platform for people who take action.
🔥 Most people wait. The best ones don’t.
👉 Connect with me on LinkedIn and send me a message:
"I want in"
Let’s build something awesome 👊
Frequently Asked Questions
What is OPC UA in industrial automation?
OPC UA (Open Platform Communications Unified Architecture) is a standardized industrial interface that allows cloud applications and edge systems to securely access data, variables, alarms, and events from equipment without needing to understand proprietary controller protocols.
How does machine telemetry differ from production context?
Telemetry simply describes what a machine reports—such as state changes, fault codes, or part counts—while production context explains what those signals mean in the flow of work, including active work orders, delivery deadlines, and material lots.
What is the difference between Azure IoT Edge and Azure IoT Operations?
Azure IoT Edge is ideal for gateway-focused deployments or single-device cells using IoT Hub, whereas Azure IoT Operations is a site-level industrial data environment running on Azure Arc-enabled Kubernetes for multi-line, multi-vendor environments.
Why is a raw tag name insufficient for data modeling?
Raw tag paths like controller memory addresses or generic labels lack necessary engineering units, allowed ranges, and asset definitions, making them impossible to interpret accurately without broader surrounding metadata and context.
00:00:00,000 --> 00:00:05,000
You can get machine alarms, sensor values, and cycle counts into the cloud faster than ever now.
2
00:00:05,000 --> 00:00:10,560
An OPC-UA server exposes a signal, an edge gateway picks it up, a stream lands in Microsoft
3
00:00:10,560 --> 00:00:12,840
Fabric, and a dashboard refreshes.
4
00:00:12,840 --> 00:00:14,520
That part usually isn't the hard part.
5
00:00:14,520 --> 00:00:18,440
The problem starts when a machine stops and somebody asks a normal production question,
6
00:00:18,440 --> 00:00:22,360
which order is now at risk, what else can run, and who needs to act.
7
00:00:22,360 --> 00:00:26,400
A red machine status doesn't answer that, and neither does a fault code on its own.
8
00:00:26,400 --> 00:00:30,320
WaterLemetry tells you an asset changed state at a certain time, but production needs to
9
00:00:30,320 --> 00:00:34,480
know what that state change means for the order, the root, the material, the people on
10
00:00:34,480 --> 00:00:36,440
shift, and the delivery promise.
11
00:00:36,440 --> 00:00:41,160
That gap between a machine signal and a production decision is where most industrial data projects
12
00:00:41,160 --> 00:00:44,160
either become useful or become another dashboard.
13
00:00:44,160 --> 00:00:47,080
For this episode, I want to follow one signal all the way through.
14
00:00:47,080 --> 00:00:51,400
We'll start with a tag in an OPC-UA server on the shop floor, move through Azure IoT at
15
00:00:51,400 --> 00:00:55,920
the edge, into Microsoft Fabric, and then ask the part that often gets skipped.
16
00:00:55,920 --> 00:01:00,960
How does that signal gain enough context to support a real production action?
17
00:01:00,960 --> 00:01:03,720
Let's start where the impact first shows up, on the line.
18
00:01:03,720 --> 00:01:07,520
A machine stoppage is never just a machine stoppage.
19
00:01:07,520 --> 00:01:10,160
Picture a packaging line during an active production order.
20
00:01:10,160 --> 00:01:12,800
The line is running a particular product variant.
21
00:01:12,800 --> 00:01:16,600
Material has already entered the cell, operators are on shift, and the MES has recorded that
22
00:01:16,600 --> 00:01:18,000
the order is active.
23
00:01:18,000 --> 00:01:21,960
Downstream equipment expects output from this line, and the planner has promised a delivery
24
00:01:21,960 --> 00:01:24,880
date based on that plan, then the packaging machine stops.
25
00:01:24,880 --> 00:01:27,320
At the machine level, the data looks straight forward.
26
00:01:27,320 --> 00:01:30,720
The state changes from running to faulted, a fault code appears.
27
00:01:30,720 --> 00:01:33,040
The part counter stops increasing.
28
00:01:33,040 --> 00:01:37,120
Current draw may change, and maybe the machine already reported several short interruptions
29
00:01:37,120 --> 00:01:38,720
before the full stop.
30
00:01:38,720 --> 00:01:43,240
Those are useful facts, they tell maintenance that something changed and may help with diagnosis.
31
00:01:43,240 --> 00:01:47,240
But the first question from production is rarely, what is the current draw?
32
00:01:47,240 --> 00:01:49,680
The question is, what does this stop do to the order?
33
00:01:49,680 --> 00:01:51,240
That requires a different set of facts.
34
00:01:51,240 --> 00:01:53,240
Which work order is active on this machine right now?
35
00:01:53,240 --> 00:01:54,680
Which operation is it performing?
36
00:01:54,680 --> 00:01:56,920
How many good parts have already passed through?
37
00:01:56,920 --> 00:01:58,240
How many are still needed?
38
00:01:58,240 --> 00:02:00,120
Is there enough time left in the shift?
39
00:02:00,120 --> 00:02:02,800
Is another machine qualified for the same product and process step?
40
00:02:02,800 --> 00:02:05,960
If there is, does it have the right tooling installed, the right operator available, and
41
00:02:05,960 --> 00:02:08,320
free capacity that won't disrupt another urgent order?
42
00:02:08,320 --> 00:02:10,080
A machine knows its own condition.
43
00:02:10,080 --> 00:02:12,960
It doesn't automatically know the production consequence.
44
00:02:12,960 --> 00:02:15,400
Maintenance sees the stoppage from another angle.
45
00:02:15,400 --> 00:02:17,360
Is the fault one that has occurred before?
46
00:02:17,360 --> 00:02:21,560
Did the machine report an alarm that points to a jam, a sensor problem, a dry fault, or
47
00:02:21,560 --> 00:02:22,560
something else?
48
00:02:22,560 --> 00:02:26,120
Does the asset need to enter a safe state before anyone intervenes?
49
00:02:26,120 --> 00:02:28,040
Is there a standard response procedure?
50
00:02:28,040 --> 00:02:29,880
Does the maintenance team need a spare part?
51
00:02:29,880 --> 00:02:32,080
A specialist or access approval?
52
00:02:32,080 --> 00:02:35,880
The telemetry can help answer some of that, but a fault code still needs interpretation
53
00:02:35,880 --> 00:02:39,560
against the asset, its configuration, and its maintenance history.
54
00:02:39,560 --> 00:02:42,320
Then there's OE, overall equipment effectiveness.
55
00:02:42,320 --> 00:02:45,920
Many teams want to calculate OE from machine signals, which makes sense.
56
00:02:45,920 --> 00:02:49,320
But when the machine changes from running to stopped, you still need a rule that classifies
57
00:02:49,320 --> 00:02:53,160
the last time.
58
00:02:53,160 --> 00:02:56,400
Was the machine waiting for an operator?
59
00:02:56,400 --> 00:02:58,160
Or was it a true equipment failure?
60
00:02:58,160 --> 00:03:00,000
The duration alone doesn't tell you.
61
00:03:00,000 --> 00:03:03,440
Say the machine stops for 10 minutes during a planned product change.
62
00:03:03,440 --> 00:03:08,240
Treat that as unplanned downtime, and the OE figure tells a story that isn't true.
63
00:03:08,240 --> 00:03:12,240
Now say it stops for 10 minutes, because an upstream feeder failed, but the packaging machine
64
00:03:12,240 --> 00:03:13,600
itself stayed healthy.
65
00:03:13,600 --> 00:03:17,040
If you assign that loss to the packaging machine without context, you've created another
66
00:03:17,040 --> 00:03:18,040
wrong story.
67
00:03:18,040 --> 00:03:21,520
Just with more precision, factories already deal with this every day.
68
00:03:21,520 --> 00:03:26,280
That's why someone often checks the MES, asks an operator, calls maintenance, opens a spreadsheet,
69
00:03:26,280 --> 00:03:29,120
and then starts piecing together the situation.
70
00:03:29,120 --> 00:03:33,120
Excel survives because people need context, and the systems often keep pieces of it in different
71
00:03:33,120 --> 00:03:34,120
places.
72
00:03:34,120 --> 00:03:37,800
That isn't a failure of the people doing the work, it's a sign that the architecture hasn't
73
00:03:37,800 --> 00:03:39,280
connected the facts they need.
74
00:03:39,280 --> 00:03:41,080
Now think about the sequence after the stop.
75
00:03:41,080 --> 00:03:44,680
The machine sends a state change, an edge layer collects it, a message travels to the
76
00:03:44,680 --> 00:03:47,040
cloud, and fabric can store and query it quickly.
77
00:03:47,040 --> 00:03:52,560
A real-time view shows that machine 12 is faulted, useful, yes, still incomplete.
78
00:03:52,560 --> 00:03:55,920
For a supervisor, the next action may be to dispatch maintenance.
79
00:03:55,920 --> 00:03:58,480
For a planner, it may be to test an alternate route.
80
00:03:58,480 --> 00:04:02,960
For quality, it may be to isolate products produced just before the fault.
81
00:04:02,960 --> 00:04:06,680
Those actions depend on different facts owned by different systems, and they can change
82
00:04:06,680 --> 00:04:07,680
during the day.
83
00:04:07,680 --> 00:04:11,000
That's the distinction to hold onto through the rest of this discussion.
84
00:04:11,000 --> 00:04:14,600
Telemetry describes what a machine reports, while production context explains what that
85
00:04:14,600 --> 00:04:16,800
report means in the flow of work.
86
00:04:16,800 --> 00:04:19,080
But the first, you're guessing about the shop flow.
87
00:04:19,080 --> 00:04:23,520
Without the second, you're staring at a very fast stream of machine data and still asking
88
00:04:23,520 --> 00:04:25,440
the planner to work it out manually.
89
00:04:25,440 --> 00:04:29,000
The data exists, but the meaning is scattered.
90
00:04:29,000 --> 00:04:31,680
Here's the reality check, most factories don't talk about.
91
00:04:31,680 --> 00:04:33,480
You already have plenty of data.
92
00:04:33,480 --> 00:04:34,600
That's not the issue.
93
00:04:34,600 --> 00:04:38,240
The problem is that each system records only its own corner of the operation.
94
00:04:38,240 --> 00:04:42,200
No single system carries the full story from a machine condition all the way through
95
00:04:42,200 --> 00:04:45,000
to production impact, start near the equipment.
96
00:04:45,000 --> 00:04:49,800
A PLC, a programmable logic controller, works close to the physical process.
97
00:04:49,800 --> 00:04:51,480
It sees inputs and outputs.
98
00:04:51,480 --> 00:04:55,560
It knows whether a sensor is high or low, whether a motor is running, whether a drive has a
99
00:04:55,560 --> 00:04:58,280
fault, or whether a counter just ticked over.
100
00:04:58,280 --> 00:05:01,280
That information matters because it comes from the process itself.
101
00:05:01,280 --> 00:05:04,640
But the PLC doesn't care about the sales order, the delivery date, or whether another line
102
00:05:04,640 --> 00:05:05,640
can take over.
103
00:05:05,640 --> 00:05:09,760
Its job is to control equipment safely and predictably, not to manage the business around it.
104
00:05:09,760 --> 00:05:12,960
A supervisory system might collect more of those signals.
105
00:05:12,960 --> 00:05:15,200
Sometimes trends recipes machine states.
106
00:05:15,200 --> 00:05:18,160
In some plants it holds years of history.
107
00:05:18,160 --> 00:05:19,680
But the meaning stays technical.
108
00:05:19,680 --> 00:05:23,360
Tag names, alarm numbers, controller addresses, equipment specific states.
109
00:05:23,360 --> 00:05:26,560
You have to know the system to decode what the data actually means.
110
00:05:26,560 --> 00:05:29,360
Now move one layer closer to execution.
111
00:05:29,360 --> 00:05:33,720
Your manufacturing execution system, the MES, sees a different part of the same day.
112
00:05:33,720 --> 00:05:35,440
It knows which operation should run.
113
00:05:35,440 --> 00:05:39,120
It records when an order starts, pauses, completes, or produces a reject.
114
00:05:39,120 --> 00:05:43,120
It knows the operator who logged in the material, lot consumed, and the production declaration
115
00:05:43,120 --> 00:05:44,720
that moved the order forward.
116
00:05:44,720 --> 00:05:47,480
That puts the MES much closer to production context.
117
00:05:47,480 --> 00:05:49,760
But it probably doesn't capture every fast machine event.
118
00:05:49,760 --> 00:05:52,440
Its timestamps really match what the PLC first saw.
119
00:05:52,440 --> 00:05:56,520
More importantly, the MES may know that an operation paused, without knowing whether the
120
00:05:56,520 --> 00:06:02,520
root cause was a server drive, a blocked conveyor, a missing label role, or a network hiccup
121
00:06:02,520 --> 00:06:04,440
between two systems.
122
00:06:04,440 --> 00:06:08,040
Then there's the ERP, your enterprise resource planning system.
123
00:06:08,040 --> 00:06:10,800
ERP holds the commercial and planning view.
124
00:06:10,800 --> 00:06:15,400
Work orders, rootings, bills of material, demand, stock positions, promised dates.
125
00:06:15,400 --> 00:06:18,440
It can tell you an order needs a certain operation before shipment.
126
00:06:18,440 --> 00:06:22,080
It usually doesn't know that a machine entered a fault state 30 seconds ago.
127
00:06:22,080 --> 00:06:23,240
That separation isn't a flaw.
128
00:06:23,240 --> 00:06:24,960
ERP has a different job.
129
00:06:24,960 --> 00:06:29,000
You don't want your production planner relying on a PLC tag as the authority for a customer
130
00:06:29,000 --> 00:06:30,000
commitment.
131
00:06:30,000 --> 00:06:33,360
In the same way, you don't want the PLC waiting for a cloud transaction before it keeps
132
00:06:33,360 --> 00:06:34,360
the machine safe.
133
00:06:34,360 --> 00:06:39,240
OT and IT work at different speeds and carry different kinds of responsibility.
134
00:06:39,240 --> 00:06:40,960
Maintenance adds another source of meaning.
135
00:06:40,960 --> 00:06:46,800
Your CMS, computerized maintenance management system, sometimes called enterprise asset management,
136
00:06:46,800 --> 00:06:48,600
contains the asset record.
137
00:06:48,600 --> 00:06:53,600
Preventive maintenance plans, spare parts, service history, manuals, approved work procedures,
138
00:06:53,600 --> 00:06:54,800
previous failure reports.
139
00:06:54,800 --> 00:06:58,120
When you see a fault code from a machine, that record gives it context.
140
00:06:58,120 --> 00:06:59,760
You can ask, has this happened before?
141
00:06:59,760 --> 00:07:01,400
Which component does it relate to?
142
00:07:01,400 --> 00:07:04,640
Does the technician need a known procedure before touching the equipment?
143
00:07:04,640 --> 00:07:08,040
But the maintenance system usually doesn't know which production order the equipment was
144
00:07:08,040 --> 00:07:09,720
running at the moment of failure.
145
00:07:09,720 --> 00:07:11,160
It knows its own part.
146
00:07:11,160 --> 00:07:12,720
Engineering holds another piece.
147
00:07:12,720 --> 00:07:15,800
Documents, product lifecycle systems, local files.
148
00:07:15,800 --> 00:07:18,440
Quality has its own application for inspection data.
149
00:07:18,440 --> 00:07:23,520
Shift handovers might live in a paper logbook, a team's message, or, quite often, a spreadsheet
150
00:07:23,520 --> 00:07:27,400
that nobody planned as a system of record, and that spreadsheet deserves some respect.
151
00:07:27,400 --> 00:07:31,240
When a planner keeps a manual list of alternate machines, two limits and operator skills, they're
152
00:07:31,240 --> 00:07:33,160
not refusing digital transformation.
153
00:07:33,160 --> 00:07:36,360
They're keeping production moving with the information they can actually trust.
154
00:07:36,360 --> 00:07:39,840
The spreadsheet exists because the formal systems haven't brought the needed facts together
155
00:07:39,840 --> 00:07:41,120
at the point of decision.
156
00:07:41,120 --> 00:07:45,520
So if you ask why teams still export reports and reconcile numbers by hand, the answer isn't
157
00:07:45,520 --> 00:07:46,520
that they love Excel.
158
00:07:46,520 --> 00:07:50,680
It's that Excel lets people assemble context across system boundaries, even if the process
159
00:07:50,680 --> 00:07:53,000
is slow, fragile, and hard to audit.
160
00:07:53,000 --> 00:07:56,560
This also explains why a cloud data platform can disappoint after a technically successful
161
00:07:56,560 --> 00:07:57,560
launch.
162
00:07:57,560 --> 00:08:02,560
The Linux machine data loads MS records, ingests ERP extracts, each source arrives, the tables
163
00:08:02,560 --> 00:08:05,720
look clean, then somebody asks a simple question.
164
00:08:05,720 --> 00:08:08,120
Which active order did this fault interrupt?
165
00:08:08,120 --> 00:08:12,600
The answer depends on stable identifiers, reliable event timing, and business rules that
166
00:08:12,600 --> 00:08:13,840
connect the sources.
167
00:08:13,840 --> 00:08:17,600
If those links don't exist, more data only gives you more places to search.
168
00:08:17,600 --> 00:08:21,320
So we need to begin at the point where the signal first becomes available before it
169
00:08:21,320 --> 00:08:24,880
gets renamed, filtered, routed, or turned into a report.
170
00:08:24,880 --> 00:08:31,480
It takes us to OPC UA on the shop floor, what OPC UA actually brings from the shop floor.
171
00:08:31,480 --> 00:08:36,000
OPC UA, open platform communications unified architecture, gives us a common way to access
172
00:08:36,000 --> 00:08:40,000
industrial data without every cloud project needing to understand every controller protocol
173
00:08:40,000 --> 00:08:41,000
underneath.
174
00:08:41,000 --> 00:08:43,400
That sounds simple, in practice it matters a lot.
175
00:08:43,400 --> 00:08:48,640
A machine might use a vendor specific controller, a drive system, and an HMI from another supplier.
176
00:08:48,640 --> 00:08:52,960
The internal data sits behind protocols that your data team shouldn't need to touch directly.
177
00:08:52,960 --> 00:08:57,400
An OPC UA server sits closer to that equipment and exposes selected information through a
178
00:08:57,400 --> 00:08:59,200
standard industrial interface.
179
00:08:59,200 --> 00:09:01,560
Think of it as a control door into machine information.
180
00:09:01,560 --> 00:09:03,000
It doesn't replace the PLC.
181
00:09:03,000 --> 00:09:04,480
It doesn't take control of the process.
182
00:09:04,480 --> 00:09:08,800
It gives approved clients a structured way to read data and where the equipment owner permits
183
00:09:08,800 --> 00:09:11,120
it interact with defined capabilities.
184
00:09:11,120 --> 00:09:15,160
At the basic level, an OPC UA server exposes variables.
185
00:09:15,160 --> 00:09:20,440
Those values people often call tags, a temperature reading, a machine state, a motor speed, a
186
00:09:20,440 --> 00:09:25,320
fault code, a production counter, a pressure value, but OPC UA can carry more than individual
187
00:09:25,320 --> 00:09:26,320
values.
188
00:09:26,320 --> 00:09:27,480
It can expose methods.
189
00:09:27,480 --> 00:09:29,960
Defined operations a client may call with the right permission.
190
00:09:29,960 --> 00:09:31,960
It can expose alarms and events.
191
00:09:31,960 --> 00:09:35,160
And it can expose information about assets and their data structure.
192
00:09:35,160 --> 00:09:39,200
That last part gets ignored far too often because a list of tags looks easier to work with
193
00:09:39,200 --> 00:09:40,920
than an industrial information model.
194
00:09:40,920 --> 00:09:41,920
The list gets you started.
195
00:09:41,920 --> 00:09:44,080
The model helps you understand what you collected.
196
00:09:44,080 --> 00:09:45,960
Imagine you connect to a packaging machine.
197
00:09:45,960 --> 00:09:50,400
You might find a variable for current speed, another for total count, another for reject
198
00:09:50,400 --> 00:09:53,120
it parts and another for machine mode.
199
00:09:53,120 --> 00:09:58,200
If the machine supplier built a decent OPC UA model, those values sit under meaningful objects
200
00:09:58,200 --> 00:10:01,160
rather than appearing as a flat list of random addresses.
201
00:10:01,160 --> 00:10:04,440
That doesn't mean every OPC UA server arrives perfectly modeled.
202
00:10:04,440 --> 00:10:05,680
Some are excellent.
203
00:10:05,680 --> 00:10:09,840
Some expose little more than controller variables with an OPC UA wrapper.
204
00:10:09,840 --> 00:10:14,120
You need to inspect what the machine actually exposes rather than assuming the protocol guarantees
205
00:10:14,120 --> 00:10:15,120
clean meaning.
206
00:10:15,120 --> 00:10:20,040
Still, OPC UA gives you a better starting point than raw access to a PLC memory address.
207
00:10:20,040 --> 00:10:23,920
It also supports subscriptions and that changes how you collect signals.
208
00:10:23,920 --> 00:10:28,800
Instead of repeatedly asking a server has this value changed yet, an OPC UA client can subscribe
209
00:10:28,800 --> 00:10:29,880
to selected nodes.
210
00:10:29,880 --> 00:10:33,400
The server reports changes based on agreed sampling and publishing settings.
211
00:10:33,400 --> 00:10:37,160
For machine state, a fault condition or a part count that reduces needless traffic and gives
212
00:10:37,160 --> 00:10:38,480
you a clearer eve end flow.
213
00:10:38,480 --> 00:10:39,480
There are limits though.
214
00:10:39,480 --> 00:10:43,200
The server may revise your requested rate because it can't support it.
215
00:10:43,200 --> 00:10:47,320
It may impose limits on the number of monitored items, sessions or subscriptions.
216
00:10:47,320 --> 00:10:52,080
Some older implementations behave differently from the standard in small but painful ways.
217
00:10:52,080 --> 00:10:56,080
Industrial interoperability often means discovering which part of standard a particular machine
218
00:10:56,080 --> 00:10:57,640
supports on a Tuesday afternoon.
219
00:10:57,640 --> 00:11:01,120
So configure subscriptions based on the decision you need to support, not because somebody
220
00:11:01,120 --> 00:11:02,920
picked a fast interval in a template.
221
00:11:02,920 --> 00:11:04,960
A part counter may need a regular update.
222
00:11:04,960 --> 00:11:06,880
A machine fault needs to travel quickly.
223
00:11:06,880 --> 00:11:10,640
A high frequency vibration stream may need local processing before anyone considers
224
00:11:10,640 --> 00:11:12,080
moving it outside the cell.
225
00:11:12,080 --> 00:11:15,360
The source system, the network and the use case all set the sensible rate.
226
00:11:15,360 --> 00:11:18,280
OPC UA also carries data quality and time information.
227
00:11:18,280 --> 00:11:19,640
A value isn't just a number.
228
00:11:19,640 --> 00:11:23,800
A good data record includes the source timestamp, the server timestamp and the status code that
229
00:11:23,800 --> 00:11:28,960
tells you whether the value is good, uncertain, bad or affected by something like queue overflow.
230
00:11:28,960 --> 00:11:29,960
Keep those details.
231
00:11:29,960 --> 00:11:34,240
If a sensor value arrives late or the server reports a bad quality status, hiding that
232
00:11:34,240 --> 00:11:37,640
fact creates a clean looking data set that may be wrong.
233
00:11:37,640 --> 00:11:41,880
For industrial analysis, an honest, uncertain value beats a false precise one.
234
00:11:41,880 --> 00:11:43,680
Access also involves trust.
235
00:11:43,680 --> 00:11:48,360
OPC UA commonly uses certificates for mutual authentication between the client and server.
236
00:11:48,360 --> 00:11:50,640
The machine needs to trust the client certificate.
237
00:11:50,640 --> 00:11:53,040
The client needs to trust the machine certificate.
238
00:11:53,040 --> 00:11:58,000
That trust belongs in a managed process, with clear ownership, expiry checks and renewal
239
00:11:58,000 --> 00:11:59,000
plans.
240
00:11:59,000 --> 00:12:01,960
This is where proof of concept and a plant deployment part ways.
241
00:12:01,960 --> 00:12:06,280
In a test environment, someone may accept any certificate just to prove data can flow.
242
00:12:06,280 --> 00:12:10,360
In production, that approach leaves an open door for the wrong server or client to impersonate
243
00:12:10,360 --> 00:12:11,360
a trusted system.
244
00:12:11,360 --> 00:12:15,440
You need approved trust lists, controlled certificate rotation and agreement from the
245
00:12:15,440 --> 00:12:17,440
equipment owner before connecting.
246
00:12:17,440 --> 00:12:18,760
Network zones matter too.
247
00:12:18,760 --> 00:12:22,080
The OPC UA client should connect from a place that OT has approved.
248
00:12:22,080 --> 00:12:25,360
It needs only the access required for the selected servers and signals.
249
00:12:25,360 --> 00:12:29,600
Nobody should treat access to a production controller as a casual IT integration task, because
250
00:12:29,600 --> 00:12:33,280
a bad connection or poorly tested query can affect equipment that must keep running.
251
00:12:33,280 --> 00:12:38,760
So OPC UA gives you structured access, event subscriptions, security mechanisms and sometimes
252
00:12:38,760 --> 00:12:40,440
a useful information model.
253
00:12:40,440 --> 00:12:44,120
It gives your architecture a disciplined way to collect facts from the floor, but a tag
254
00:12:44,120 --> 00:12:47,200
exposed through OPC UA is still not a business-ready event.
255
00:12:47,200 --> 00:12:51,040
It has a node ID, a value, a timestamp and a quality code.
256
00:12:51,040 --> 00:12:55,320
Before it can travel through the wider data flow, you need to decide what that signal means,
257
00:12:55,320 --> 00:12:58,560
where it came from and what information must stay attached to it.
258
00:12:58,560 --> 00:13:01,040
A tag name is not a data model.
259
00:13:01,040 --> 00:13:03,760
Here's the problem most manufacturers don't talk about.
260
00:13:03,760 --> 00:13:08,400
Once you actually start browsing a real OPC UA server, you see the issue immediately.
261
00:13:08,400 --> 00:13:13,280
A tag path often looks like a folder tree designed by an electrician working under a tight deadline,
262
00:13:13,280 --> 00:13:17,840
something like a controller name, then a program block, then an abbreviated variable that
263
00:13:17,840 --> 00:13:22,680
only makes sense if you already know the machine and the person who coded it.
264
00:13:22,680 --> 00:13:25,160
Now that tag might be perfectly valid technically.
265
00:13:25,160 --> 00:13:29,360
It gives you the current value from the controller and it's probably run reliably for years.
266
00:13:29,360 --> 00:13:30,880
But a path like DB42.
267
00:13:30,880 --> 00:13:35,360
LineState Automode tells a data engineer absolutely nothing about whether it describes a packaging
268
00:13:35,360 --> 00:13:39,440
machine, a feeder, a conveyor, or an entire cell.
269
00:13:39,440 --> 00:13:44,080
It also doesn't reveal whether a value of one means running, enabled, ready, or just that
270
00:13:44,080 --> 00:13:45,760
an automatic mode was selected.
271
00:13:45,760 --> 00:13:49,000
Names help, but on their own, they don't carry enough meaning.
272
00:13:49,000 --> 00:13:52,760
Even a tag with a label as friendly as temperature leaves a lot of open questions.
273
00:13:52,760 --> 00:13:56,560
Temperature of what, where was it measured, what unit is it the current process value,
274
00:13:56,560 --> 00:13:59,120
a set point, a calculated value, or a limit?
275
00:13:59,120 --> 00:14:02,920
Does it come from a calibrated sensor, a controller estimate, or a manual entry?
276
00:14:02,920 --> 00:14:05,160
You need the surrounding facts, the context.
277
00:14:05,160 --> 00:14:09,840
For every signal that matters beyond the machine layer, you should know its stable source identity.
278
00:14:09,840 --> 00:14:14,800
Its data type, its engineering unit, it's a loud range, and its quality status.
279
00:14:14,800 --> 00:14:18,720
You also need timestamps, one that tells you when the source created the value and another
280
00:14:18,720 --> 00:14:21,120
for when your collection layer received it.
281
00:14:21,120 --> 00:14:23,240
That might sound like boring data housekeeping.
282
00:14:23,240 --> 00:14:24,240
It's not.
283
00:14:24,240 --> 00:14:26,000
Imagine a pressure value arrives as 80.
284
00:14:26,000 --> 00:14:30,200
Without a unit, 80 could be a harmless process reading or a serious problem that demands
285
00:14:30,200 --> 00:14:31,520
immediate attention.
286
00:14:31,520 --> 00:14:36,120
If the value comes with a bad OPC UA quality code because the sensor connection failed,
287
00:14:36,120 --> 00:14:39,800
a dashboard shouldn't quietly plot it as if it came from a healthy instrument.
288
00:14:39,800 --> 00:14:41,640
The same logic applies to timestamps.
289
00:14:41,640 --> 00:14:46,720
A value can reach fabric after a network delay, an edge restart, or local buffering.
290
00:14:46,720 --> 00:14:50,360
If you only keep the time fabric received the message, you can easily mistake an old event
291
00:14:50,360 --> 00:14:51,600
for a live one.
292
00:14:51,600 --> 00:14:54,920
The source time and the arrival time answer different questions, so keep both.
293
00:14:54,920 --> 00:14:55,920
They're not the same.
294
00:14:55,920 --> 00:14:57,080
Now consider machine state.
295
00:14:57,080 --> 00:14:59,640
A state signal might report that the machine is stopped.
296
00:14:59,640 --> 00:15:02,040
That sounds clear until you ask why it stopped.
297
00:15:02,040 --> 00:15:04,520
During a planned product change, stopped is expected.
298
00:15:04,520 --> 00:15:07,360
While an operator clears a jam, it signals a loss.
299
00:15:07,360 --> 00:15:10,640
Before the shift begins, it may just mean the machine hasn't started yet.
300
00:15:10,640 --> 00:15:13,360
The same bit means different things depending on the operating context.
301
00:15:13,360 --> 00:15:17,160
This is why you can't calculate production meaning from a raw Boolean value and call the
302
00:15:17,160 --> 00:15:18,240
job done.
303
00:15:18,240 --> 00:15:22,120
You need a state model and that model needs rules that the people who run the equipment
304
00:15:22,120 --> 00:15:23,360
agree on.
305
00:15:23,360 --> 00:15:29,040
A machine can be powered, enabled in automatic mode, ready for production, starved of material,
306
00:15:29,040 --> 00:15:32,000
blocked downstream, changing over or faltered.
307
00:15:32,000 --> 00:15:35,480
Those states can look nearly identical in a tag list while meaning very different things
308
00:15:35,480 --> 00:15:36,480
to production.
309
00:15:36,480 --> 00:15:40,200
Don't let an unclear signal name travel through the architecture unchanged just because it
310
00:15:40,200 --> 00:15:41,600
technically works.
311
00:15:41,600 --> 00:15:45,160
Give the signal a controlled name that people can read and understand while preserving
312
00:15:45,160 --> 00:15:48,520
the original node ID and browse path as source evidence.
313
00:15:48,520 --> 00:15:52,440
That gives you a clean business facing label without losing the ability to trace a value
314
00:15:52,440 --> 00:15:56,040
back to the actual machine interface when someone needs to troubleshoot.
315
00:15:56,040 --> 00:15:58,040
Stable asset identity matters for the same reason.
316
00:15:58,040 --> 00:16:01,880
The machine name in your MIS might be different from the name maintenance users.
317
00:16:01,880 --> 00:16:03,760
The PLC project may use yet another name.
318
00:16:03,760 --> 00:16:07,800
If an asset gets renamed after a line rebuild, historical data still needs to refer to the
319
00:16:07,800 --> 00:16:11,600
same physical resource or at least show when the relationship changed.
320
00:16:11,600 --> 00:16:15,440
Use an identifier that doesn't depend on a dashboard title or a local nickname.
321
00:16:15,440 --> 00:16:18,600
Then map each source system's own identifier to that asset.
322
00:16:18,600 --> 00:16:22,160
You might call the asset packaging cell 2 in daily conversation but your architecture needs
323
00:16:22,160 --> 00:16:26,360
to know exactly which physical machine, controller endpoint and source mode produce the
324
00:16:26,360 --> 00:16:27,360
event.
325
00:16:27,360 --> 00:16:29,080
The source trail isn't bureaucracy.
326
00:16:29,080 --> 00:16:31,880
It lets you answer the question that always shows up eventually.
327
00:16:31,880 --> 00:16:33,440
Where did this number come from?
328
00:16:33,440 --> 00:16:36,920
And there's a more useful way to choose signals than exporting every tag that happens to be
329
00:16:36,920 --> 00:16:37,920
available.
330
00:16:37,920 --> 00:16:39,000
Start with the decision.
331
00:16:39,000 --> 00:16:43,360
If a shift supervisor needs to know that a line stopped unexpectedly, which state signals
332
00:16:43,360 --> 00:16:45,280
and conditions support that decision.
333
00:16:45,280 --> 00:16:49,040
If maintenance needs an early warning for a failure mode, which measurements give credible
334
00:16:49,040 --> 00:16:50,040
evidence?
335
00:16:50,040 --> 00:16:54,400
If quality needs to isolate suspect parts, which events identify the product, the process
336
00:16:54,400 --> 00:16:56,240
step and the time window?
337
00:16:56,240 --> 00:16:59,960
It's a good sign because they support a defined action, investigation or calculation.
338
00:16:59,960 --> 00:17:03,760
A broad tag dump can feel productive because data starts flowing fast.
339
00:17:03,760 --> 00:17:07,840
Later someone has to explain thousands of fields, store them, secure them, monitor them
340
00:17:07,840 --> 00:17:09,840
and decide whether anyone should trust them.
341
00:17:09,840 --> 00:17:14,760
That's how a data platform becomes a very expensive archive of names nobody understands.
342
00:17:14,760 --> 00:17:18,320
Once you know which signals matter and what each one means, you can decide where those
343
00:17:18,320 --> 00:17:21,280
OT facts should cross into an IT managed data flow.
344
00:17:21,280 --> 00:17:24,800
The OT boundary and the industrial DMZ.
345
00:17:24,800 --> 00:17:28,080
Once you've chosen the signals, another question comes up fast.
346
00:17:28,080 --> 00:17:30,360
Where should those signals leave the operational network?
347
00:17:30,360 --> 00:17:32,240
This isn't just a network design detail.
348
00:17:32,240 --> 00:17:36,000
It decides who can reach production equipment, what happens when the cloud link drops and
349
00:17:36,000 --> 00:17:40,320
whether the data path can run without turning the shop floor into an extension of the corporate
350
00:17:40,320 --> 00:17:41,520
network.
351
00:17:41,520 --> 00:17:46,360
Most factories use some form of separation between control systems and enterprise systems.
352
00:17:46,360 --> 00:17:49,280
People often describe it through the Purdue model.
353
00:17:49,280 --> 00:17:53,200
Controllers and field devices close to the process, supervisory systems above them and
354
00:17:53,200 --> 00:17:55,200
business applications higher up.
355
00:17:55,200 --> 00:17:57,800
The exact layout varies from plant to plant.
356
00:17:57,800 --> 00:18:01,680
But the principle holds, systems that control physical equipment need tighter boundaries than
357
00:18:01,680 --> 00:18:03,760
systems that analyze data later.
358
00:18:03,760 --> 00:18:07,240
Between those environments you'll often find an industrial demilitarized zone, usually
359
00:18:07,240 --> 00:18:08,920
called an industrial DMZ.
360
00:18:08,920 --> 00:18:11,280
Think of it as a controlled transfer area.
361
00:18:11,280 --> 00:18:15,000
Data can move through it under clear rules, but enterprise users and cloud services don't
362
00:18:15,000 --> 00:18:18,320
get a direct path into controllers, drives and machine networks.
363
00:18:18,320 --> 00:18:21,720
That boundary can feel slow when someone wants a quick proof of concept.
364
00:18:21,720 --> 00:18:26,280
A team sees an OPC UA endpoint, opens a route to the cloud and suddenly data appears in
365
00:18:26,280 --> 00:18:27,280
a dashboard.
366
00:18:27,280 --> 00:18:28,280
Technically, it works.
367
00:18:28,280 --> 00:18:32,720
Then, security, OT or the machine supplier asks who approved the connection which certificates
368
00:18:32,720 --> 00:18:36,280
it uses and what happens when the gateway behaves badly.
369
00:18:36,280 --> 00:18:38,760
Those questions should come before the first production connection.
370
00:18:38,760 --> 00:18:41,600
A sensible pattern keeps the connection direction under control.
371
00:18:41,600 --> 00:18:45,680
The edge system inside the approved industrial zone initiates an outbound connection to the
372
00:18:45,680 --> 00:18:46,680
services it needs.
373
00:18:46,680 --> 00:18:50,600
You avoid opening broad inbound parts from the cloud into the plant and you restrict
374
00:18:50,600 --> 00:18:54,360
traffic to named destinations, ports, protocols and identities.
375
00:18:54,360 --> 00:18:56,800
That gives the network team something concrete to review.
376
00:18:56,800 --> 00:18:59,160
It also gives OT a way to protect the equipment.
377
00:18:59,160 --> 00:19:02,680
An analytics platform should receive data, but it shouldn't inherit the right to browse
378
00:19:02,680 --> 00:19:07,920
every controller, change a set point or restart a service just because someone wants more convenience.
379
00:19:07,920 --> 00:19:09,360
Lease privilege matters here.
380
00:19:09,360 --> 00:19:14,040
The data collector needs red access only to the OPC UA nodes approved for the use case.
381
00:19:14,040 --> 00:19:17,880
If a command path exists at all, it needs separate identities, separate approval and
382
00:19:17,880 --> 00:19:19,440
local safeguards.
383
00:19:19,440 --> 00:19:23,720
Using a machine state and writing to a live machine are not variations of the same risk.
384
00:19:23,720 --> 00:19:25,320
Certificates deserve the same discipline.
385
00:19:25,320 --> 00:19:30,000
OPC UA clients and servers commonly use certificates to establish trust and those certificates
386
00:19:30,000 --> 00:19:31,000
expire.
387
00:19:31,000 --> 00:19:35,160
If nobody owns renewal, the data flow can fail at an inconvenient time.
388
00:19:35,160 --> 00:19:37,200
Often during a shift when the team needs it most.
389
00:19:37,200 --> 00:19:42,080
A certificate process needs named owners, a record of trust relationships, advanced expiry
390
00:19:42,080 --> 00:19:47,000
alerts and a safe way to replace certificates without improvising on the plant network.
391
00:19:47,000 --> 00:19:49,800
Airwall rules also need to be precise and documented.
392
00:19:49,800 --> 00:19:51,000
Allow Azure isn't a rule.
393
00:19:51,000 --> 00:19:53,360
It's a future incident report waiting for a date.
394
00:19:53,360 --> 00:19:57,400
To find the edge host, the approved machine endpoints, the cloud destinations, the protocols
395
00:19:57,400 --> 00:20:01,360
and the reason each flow exists when the architecture changes, update those rules through
396
00:20:01,360 --> 00:20:03,160
a controlled change process.
397
00:20:03,160 --> 00:20:05,240
Now consider the day when the internet connection drops.
398
00:20:05,240 --> 00:20:08,720
The machine doesn't stop producing just because fabric can't receive telemetry.
399
00:20:08,720 --> 00:20:13,360
It may keep running, stop for a local fault or move into a safe condition based on logic
400
00:20:13,360 --> 00:20:15,160
that stays inside the plant.
401
00:20:15,160 --> 00:20:18,800
Your cloud data path must not become part of that control dependency.
402
00:20:18,800 --> 00:20:22,120
The collector should handle a temporary loss of connection without losing its own state
403
00:20:22,120 --> 00:20:25,400
or overwhelming the source systems when connectivity returns.
404
00:20:25,400 --> 00:20:27,720
It needs a defined, store and forward policy.
405
00:20:27,720 --> 00:20:31,800
That means deciding what it buffers locally, how much it can retain, what happens when storage
406
00:20:31,800 --> 00:20:35,160
fills and how it resends data without creating confusion downstream.
407
00:20:35,160 --> 00:20:38,160
There isn't one right retention period for every plant.
408
00:20:38,160 --> 00:20:42,880
A high value traceability event may deserve more local protection than a rapidly changing
409
00:20:42,880 --> 00:20:44,920
value that you can safely summarize.
410
00:20:44,920 --> 00:20:49,440
A site with unreliable connectivity needs different buffer capacity from a site with a well-managed
411
00:20:49,440 --> 00:20:50,680
redundant connection.
412
00:20:50,680 --> 00:20:55,720
The point is to make those choices deliberately, test them and document the expected behavior.
413
00:20:55,720 --> 00:20:57,400
Recovery matters as much as buffering.
414
00:20:57,400 --> 00:21:00,720
After an outage, events may arrive late, they may arrive in batches.
415
00:21:00,720 --> 00:21:04,960
Some may appear twice because reliable delivery usually accepts duplicates rather than silently
416
00:21:04,960 --> 00:21:06,080
dropping a message.
417
00:21:06,080 --> 00:21:10,240
Your cloud pipeline needs to recognize this later, but the boundary design begins the work
418
00:21:10,240 --> 00:21:14,440
by preserving source time and supporting a controlled replay path.
419
00:21:14,440 --> 00:21:16,320
She stays local throughout all of this.
420
00:21:16,320 --> 00:21:21,240
A PLC, distributed control system or dedicated safety system handles decisions that protect
421
00:21:21,240 --> 00:21:24,360
people, equipment and process stability.
422
00:21:24,360 --> 00:21:28,600
Cloud analytics can inform a person that can support planning, investigation and maintenance
423
00:21:28,600 --> 00:21:29,600
work.
424
00:21:29,600 --> 00:21:34,080
It should not become the only line between a bad sensor reading and a physical consequence.
425
00:21:34,080 --> 00:21:37,160
That distinction removes a lot of bad architecture from the room.
426
00:21:37,160 --> 00:21:40,360
Once the crossing point is controlled, the next layer has a clear job.
427
00:21:40,360 --> 00:21:45,080
It connects to approved industrial sources, prepares data for onward use and keeps the production
428
00:21:45,080 --> 00:21:46,920
network from depending on the cloud.
429
00:21:46,920 --> 00:21:48,920
That working layer is the edge.
430
00:21:48,920 --> 00:21:52,400
Edge processing, what it should do.
431
00:21:52,400 --> 00:21:56,920
The edge sits close enough to the machines to work with industrial data properly, but far
432
00:21:56,920 --> 00:21:59,720
enough away that it doesn't interfere with control.
433
00:21:59,720 --> 00:22:01,080
Its first job is connection.
434
00:22:01,080 --> 00:22:06,680
An edge gateway or edge cluster connects to approved OPC UA servers and sometimes to other
435
00:22:06,680 --> 00:22:11,160
industrial sources that don't speak OPC UA directly, that can include a legacy controller
436
00:22:11,160 --> 00:22:15,800
behind a gateway, a machine vision system, an energy meter or a local MQTT source already
437
00:22:15,800 --> 00:22:17,000
running on the line.
438
00:22:17,000 --> 00:22:18,560
Here's the real benefit.
439
00:22:18,560 --> 00:22:22,360
The edge layer gives you one managed place to handle those connections.
440
00:22:22,360 --> 00:22:26,480
Instead of every cloud project dashboard and data scientist reaching into the OT network,
441
00:22:26,480 --> 00:22:30,400
the edge collects the selected data once and distributes it through controlled paths.
442
00:22:30,400 --> 00:22:31,400
That reduces risk.
443
00:22:31,400 --> 00:22:34,040
It also reduces chaos, but collection alone isn't enough.
444
00:22:34,040 --> 00:22:37,720
An edge layer should improve the data before it leaves the site, without inventing business
445
00:22:37,720 --> 00:22:39,720
meaning that it can't reliably know.
446
00:22:39,720 --> 00:22:40,720
Start with filtering.
447
00:22:40,720 --> 00:22:45,560
A machine may expose thousands of values, while only a small set supports the decision you're
448
00:22:45,560 --> 00:22:49,800
trying to improve, sending every signal at the highest rate creates network traffic,
449
00:22:49,800 --> 00:22:53,160
cloud cost, storage growth and a larger data quality problem.
450
00:22:53,160 --> 00:22:57,320
None of that makes a maintenance technician faster, so you filter locally based on purpose.
451
00:22:57,320 --> 00:23:01,480
A machine state change might always travel, a fault event might travel with its source time
452
00:23:01,480 --> 00:23:02,480
and code.
453
00:23:02,480 --> 00:23:07,640
A temperature that changes slowly may only need to travel when it crosses a defined deadband,
454
00:23:07,640 --> 00:23:09,840
meaning it has moved far enough to matter.
455
00:23:09,840 --> 00:23:14,520
A fast vibration signal may need a local calculation that sends a trend, a feature or an
456
00:23:14,520 --> 00:23:17,080
exception rather than every raw sample.
457
00:23:17,080 --> 00:23:19,200
That isn't throwing data away blindly.
458
00:23:19,200 --> 00:23:21,800
It's choosing the right resolution for the question.
459
00:23:21,800 --> 00:23:23,840
Unit conversion often belongs here too.
460
00:23:23,840 --> 00:23:28,440
If one machine reports temperature in Fahrenheit and another in Celsius, the edge can convert
461
00:23:28,440 --> 00:23:31,760
both into the agreed unit before they feed a shared data product.
462
00:23:31,760 --> 00:23:34,520
The same applies to pressure, speed, energy and flow.
463
00:23:34,520 --> 00:23:38,560
Keep the original unit where traceability requires it, but don't ask every downstream
464
00:23:38,560 --> 00:23:41,080
report to remember a different conversion rule.
465
00:23:41,080 --> 00:23:44,280
The edge can also add facts that are stable and known at the site.
466
00:23:44,280 --> 00:23:48,600
It can attach a site ID, a line ID and asset ID, the source endpoint and the approved signal
467
00:23:48,600 --> 00:23:49,600
name.
468
00:23:49,600 --> 00:23:52,920
That turns a bare value into an event that downstream systems can identify without trying
469
00:23:52,920 --> 00:23:55,040
to decode a controller address later.
470
00:23:55,040 --> 00:23:56,640
Be careful with enrichment though.
471
00:23:56,640 --> 00:23:59,080
The edge should add facts that can know with confidence.
472
00:23:59,080 --> 00:24:03,120
It should not guess which production order is active because a schedule was cached several
473
00:24:03,120 --> 00:24:04,120
hours ago.
474
00:24:04,120 --> 00:24:07,800
That kind of business context changes and it needs a govern source later in the flow.
475
00:24:07,800 --> 00:24:08,920
Sampling needs the same care.
476
00:24:08,920 --> 00:24:11,800
The default setting in the connector rarely understands your process.
477
00:24:11,800 --> 00:24:17,040
A fast publishing rate may sound safer, but it can overload an older OPC UA server, fill
478
00:24:17,040 --> 00:24:20,800
local cues and produce more data than any consumer can use.
479
00:24:20,800 --> 00:24:24,840
A slow rate can miss short stops, faults or process changes that matter.
480
00:24:24,840 --> 00:24:27,480
Pick the rate from the production need for a fault signal.
481
00:24:27,480 --> 00:24:29,480
You may need rapid change notification.
482
00:24:29,480 --> 00:24:32,360
For utility meter, a slower interval may be enough.
483
00:24:32,360 --> 00:24:36,640
For a counter, you may want a periodic value plus event based changes.
484
00:24:36,640 --> 00:24:40,840
The right choice comes from how quickly someone or something must respond, not from a generic
485
00:24:40,840 --> 00:24:41,840
template.
486
00:24:41,840 --> 00:24:44,600
The edge also needs to behave well when the world around it doesn't.
487
00:24:44,600 --> 00:24:49,440
It should buffer data locally during a cloud outage, retry delivery in a controlled way,
488
00:24:49,440 --> 00:24:50,560
and expose its own health.
489
00:24:50,560 --> 00:24:54,520
You need to know when it lost contact with the source, when its local storage is filling,
490
00:24:54,520 --> 00:24:58,600
when a queue is backing up and when it hasn't sent data for longer than expected, back pressure
491
00:24:58,600 --> 00:24:59,720
matters here.
492
00:24:59,720 --> 00:25:04,160
If the cloud path slows down, the edge must avoid pushing that pressure back into the OPC
493
00:25:04,160 --> 00:25:06,760
UA server or exhausting its own memory.
494
00:25:06,760 --> 00:25:11,560
It needs limits, priorities and a documented rule for what happens when the limit is reached.
495
00:25:11,560 --> 00:25:15,560
Some events cannot be lost, others can be sampled, summarized or dropped under controlled
496
00:25:15,560 --> 00:25:16,560
conditions.
497
00:25:16,560 --> 00:25:18,840
Decide that before the incident, not during it.
498
00:25:18,840 --> 00:25:22,760
You may also run AI inference at the edge, but only where it earns its place.
499
00:25:22,760 --> 00:25:26,840
If a local response needs low latency or if the site must continue operating during a disconnected
500
00:25:26,840 --> 00:25:29,520
period, a model may run beside the data source.
501
00:25:29,520 --> 00:25:34,040
For example, it could classify an image, detect an abnormal signal pattern, or raise a local
502
00:25:34,040 --> 00:25:35,360
warning for an operator.
503
00:25:35,360 --> 00:25:37,920
That doesn't mean every model belongs at the edge.
504
00:25:37,920 --> 00:25:40,800
Training usually needs border history and more compute.
505
00:25:40,800 --> 00:25:44,600
Many predictions can travel to the cloud because a human decision takes minutes or hours
506
00:25:44,600 --> 00:25:46,640
anyway.
507
00:25:46,640 --> 00:25:50,960
Put inference at the edge when local timing, data volume or connection loss requires it.
508
00:25:50,960 --> 00:25:54,120
Otherwise, you're just adding another system to patch it three in the morning.
509
00:25:54,120 --> 00:25:57,760
From here, there are two common Microsoft paths for running this edge work.
510
00:25:57,760 --> 00:26:00,760
They overlap in some areas, but they fit different operating models.
511
00:26:00,760 --> 00:26:04,320
Azure IoT Edge and Azure IoT Operations.
512
00:26:04,320 --> 00:26:09,040
Azure IoT Edge and Azure IoT Operations can both sit in this edge layer, but they start
513
00:26:09,040 --> 00:26:11,520
from different assumptions about what you're trying to run.
514
00:26:11,520 --> 00:26:15,720
Azure IoT Edge fits well when you need a lighter device-level runtime.
515
00:26:15,720 --> 00:26:19,440
You have an industrial gateway, a small server or a device near a machine, and you want
516
00:26:19,440 --> 00:26:21,680
to run containerized workloads there.
517
00:26:21,680 --> 00:26:25,680
Those workloads might collect data, filter it, run a local rule, or forward messages to
518
00:26:25,680 --> 00:26:27,280
Azure through IoT Hub.
519
00:26:27,280 --> 00:26:28,280
It's a flexible model.
520
00:26:28,280 --> 00:26:31,960
You define modules as containers, deploy them to the edge device, and use the edge runtime
521
00:26:31,960 --> 00:26:32,960
to manage them.
522
00:26:32,960 --> 00:26:37,600
If your team already has a working container for a protocol connector or a local calculation,
523
00:26:37,600 --> 00:26:42,480
IoT Edge gives you a practical way to place that workload close to the source.
524
00:26:42,480 --> 00:26:44,040
That freedom comes with responsibility.
525
00:26:44,040 --> 00:26:47,520
The platform can run your containers, but it doesn't decide how those containers should
526
00:26:47,520 --> 00:26:52,440
connect, share data, store configuration, recover after a fault, or expose their health.
527
00:26:52,440 --> 00:26:56,760
You still need to own those decisions, in a small use case that can be entirely reasonable.
528
00:26:56,760 --> 00:27:01,600
In a plant with many machine types and several network zones, those decisions add up quickly.
529
00:27:01,600 --> 00:27:04,640
Azure IoT Operations approaches the problem at a wider level.
530
00:27:04,640 --> 00:27:09,280
Rather than treating the edge as one device with a few modules, it treats a site as an industrial
531
00:27:09,280 --> 00:27:10,520
data environment.
532
00:27:10,520 --> 00:27:15,000
It runs on an Azure Arc-enabled Kubernetes cluster and includes industrial-focused
533
00:27:15,000 --> 00:27:21,000
services such as an MQTT broker, OPC-UA connectivity, data flows, and device and asset management
534
00:27:21,000 --> 00:27:22,240
capabilities.
535
00:27:22,240 --> 00:27:25,840
That makes it more suited to a plant or site where data must move between multiple assets,
536
00:27:25,840 --> 00:27:29,480
local applications, and cloud destinations under a shared operating model.
537
00:27:29,480 --> 00:27:34,320
In practical terms, Azure IoT Operations can provide a common edge data layer for a line,
538
00:27:34,320 --> 00:27:39,520
an area, or a whole plant, and OPC-UA connector can collect selected machine data.
539
00:27:39,520 --> 00:27:40,640
Data flows can shape and root it.
540
00:27:40,640 --> 00:27:43,920
The local MQTT broker can distribute it to approve consumers.
541
00:27:43,920 --> 00:27:48,880
When selected events can move to Azure or Microsoft Fabric, that sounds cleaner and it can be.
542
00:27:48,880 --> 00:27:51,000
But don't confuse a platform with an architecture.
543
00:27:51,000 --> 00:27:54,440
Azure IoT Operations doesn't remove the need to agree which signals matter.
544
00:27:54,440 --> 00:27:56,000
It doesn't fix poor asset naming.
545
00:27:56,000 --> 00:28:00,240
It doesn't know which machine state counts as a production loss until you define the rule.
546
00:28:00,240 --> 00:28:04,280
It also doesn't decide who owns a failed connection to an older machine controller at two o'clock
547
00:28:04,280 --> 00:28:05,280
in the morning.
548
00:28:05,280 --> 00:28:06,720
Those are still factory decisions.
549
00:28:06,720 --> 00:28:09,080
The larger difference is the operating commitment.
550
00:28:09,080 --> 00:28:13,880
Azure IoT Edge can run on modest hardware and works well when the Edge task remains focused.
551
00:28:13,880 --> 00:28:18,280
Azure IoT Operations brings Kubernetes and Azure Arc into the plant environment.
552
00:28:18,280 --> 00:28:22,920
That gives you a broader management model and it can support more structured site level deployments.
553
00:28:22,920 --> 00:28:27,480
But it also means you need people who can operate the cluster, manage updates, handle storage,
554
00:28:27,480 --> 00:28:29,920
monitor workload health, and support recovery.
555
00:28:29,920 --> 00:28:31,720
Kubernetes doesn't make operations disappear.
556
00:28:31,720 --> 00:28:32,840
It formalizes them.
557
00:28:32,840 --> 00:28:35,120
For some manufacturers, that's the right direction.
558
00:28:35,120 --> 00:28:40,480
They already run site infrastructure, have a cloud platform team and want repeatable deployments across plants.
559
00:28:40,480 --> 00:28:45,040
They need a local MQTT service, industrial connectors, and a controlled way to manage data
560
00:28:45,040 --> 00:28:47,240
flows across a larger OTS state.
561
00:28:47,240 --> 00:28:50,480
For others, it may be too much for the first problem they want to solve.
562
00:28:50,480 --> 00:28:55,480
Say you need to collect a defined set of OPC/UAS signals from one packaging cell, buffer them locally,
563
00:28:55,480 --> 00:28:56,720
and send them to the cloud.
564
00:28:56,720 --> 00:29:00,920
A focused gateway and IoT Edge deployment may be easier to support than introducing a Kubernetes
565
00:29:00,920 --> 00:29:03,320
operating model before the use case has proved itself.
566
00:29:03,320 --> 00:29:04,320
Now turn that around.
567
00:29:04,320 --> 00:29:08,120
Say you have several lines, different machine suppliers, local consumers that need the same
568
00:29:08,120 --> 00:29:11,080
events and a plan to repeat the pattern across sites.
569
00:29:11,080 --> 00:29:13,840
A site level Edge platform starts to make more sense.
570
00:29:13,840 --> 00:29:16,800
The question isn't which technology has the longer feature list.
571
00:29:16,800 --> 00:29:20,840
The question is whether your operational need justifies the operating model behind it.
572
00:29:20,840 --> 00:29:22,240
Hardware plays a part two.
573
00:29:22,240 --> 00:29:25,240
Before choosing either route, assess the actual environment.
574
00:29:25,240 --> 00:29:28,080
What compute and memory can you place in the industrial zone?
575
00:29:28,080 --> 00:29:30,080
Can the hardware survive the site conditions?
576
00:29:30,080 --> 00:29:31,640
Who replaces it after a failure?
577
00:29:31,640 --> 00:29:32,880
Is there redundant power?
578
00:29:32,880 --> 00:29:35,640
How will local storage behave during a long connection loss?
579
00:29:35,640 --> 00:29:38,960
Who has remote access and underwater approval process?
580
00:29:38,960 --> 00:29:40,720
Support needs to be designed, not assumed.
581
00:29:40,720 --> 00:29:42,720
You also need a clear division of responsibility.
582
00:29:42,720 --> 00:29:47,640
OT teams should approve machine access, signal selection, and any impact on production systems.
583
00:29:47,640 --> 00:29:52,240
IT teams may run the host cluster identity network policy and cloud connection.
584
00:29:52,240 --> 00:29:55,520
Data teams define event contracts and transformations.
585
00:29:55,520 --> 00:30:00,160
None of those groups can safely complete the job alone, so I wouldn't frame Azure IoT Edge
586
00:30:00,160 --> 00:30:04,280
and Azure IoT operations as old versus new or simple versus advanced.
587
00:30:04,280 --> 00:30:06,280
They are different ways to run Edge workloads.
588
00:30:06,280 --> 00:30:12,520
IoT Edge often suits focused device or gateway workloads where you want control and a lighter footprint.
589
00:30:12,520 --> 00:30:17,240
Azure IoT operations suits an industrial site data layer where Kubernetes, Arc, local
590
00:30:17,240 --> 00:30:21,520
MQTT and managed OT data flows fit the wider plan, whichever path you choose, the same
591
00:30:21,520 --> 00:30:22,840
work remains.
592
00:30:22,840 --> 00:30:28,480
Protocol behavior, data meaning, failover rules, security boundaries, and clear OT ownership.
593
00:30:28,480 --> 00:30:32,720
And once several sources and consumers need to share events locally, the conversation usually
594
00:30:32,720 --> 00:30:37,720
moves to MQTT and the broker pattern at the center of that data flow, MQTT as the factory
595
00:30:37,720 --> 00:30:39,960
event backbone.
596
00:30:39,960 --> 00:30:45,200
When local machine data needs more than one consumer, MQTT starts to make real sense.
597
00:30:45,200 --> 00:30:48,480
It's a lightweight messaging protocol built around publish and subscribe.
598
00:30:48,480 --> 00:30:52,800
A source publishes a message to a name topic and other systems subscribe to that topic,
599
00:30:52,800 --> 00:30:57,000
or are controlled part of the topic structure, with the broker handling the rooting.
600
00:30:57,000 --> 00:31:00,760
The source doesn't need to know who consumes the data, and that separation changes the
601
00:31:00,760 --> 00:31:02,480
shape of an industrial integration.
602
00:31:02,480 --> 00:31:03,640
Here's the practical value.
603
00:31:03,640 --> 00:31:07,840
A machine connector can publish a fault event once the local maintenance app gets it,
604
00:31:07,840 --> 00:31:12,320
the site historian gets it, the cloud data flow gets it, and later another approved consumer
605
00:31:12,320 --> 00:31:16,320
can subscribe without ever touching the connector talking to the machine.
606
00:31:16,320 --> 00:31:20,320
You avoid building a fresh point to point link every time a new team wants the same data.
607
00:31:20,320 --> 00:31:23,560
Those point to point links work for a while, but eventually the factory ends up with too
608
00:31:23,560 --> 00:31:26,880
many hidden dependencies and nobody knows which interface breaks when a machine signal
609
00:31:26,880 --> 00:31:27,880
changes.
610
00:31:27,880 --> 00:31:30,480
The broker becomes the local meeting point for events.
611
00:31:30,480 --> 00:31:33,200
Think of it like this, picture one packaging cell.
612
00:31:33,200 --> 00:31:37,280
The OPC UA connector turns approved machine data into messages, publishing a current
613
00:31:37,280 --> 00:31:42,640
machine state to a topic like site one, packaging, line two, cell for machine state and fault
614
00:31:42,640 --> 00:31:45,960
events to a separate topic under the same asset path.
615
00:31:45,960 --> 00:31:50,120
A local application can subscribe to the live state, a maintenance workflow can listen
616
00:31:50,120 --> 00:31:54,480
for fault events, and the data flow to fabric can subscribe to both, sending only the events
617
00:31:54,480 --> 00:31:56,160
needed outside the plant.
618
00:31:56,160 --> 00:31:59,400
Nobody needs a direct connection to the PLC for each of those uses.
619
00:31:59,400 --> 00:32:01,880
That's the practical attraction of MQTT.
620
00:32:01,880 --> 00:32:06,320
Produces publish, consumers subscribe, and the broker handles the handoff based on access
621
00:32:06,320 --> 00:32:08,320
rules and topic names.
622
00:32:08,320 --> 00:32:09,640
Topic design still needs thought.
623
00:32:09,640 --> 00:32:12,760
A topic hierarchy can carry useful location and function clues.
624
00:32:12,760 --> 00:32:17,600
You might begin with a site, then an area, a line, a cell, and an asset.
625
00:32:17,600 --> 00:32:22,360
And under the asset you can separate state events, condition data, or production counts.
626
00:32:22,360 --> 00:32:24,360
That makes subscriptions easier to control.
627
00:32:24,360 --> 00:32:28,640
Align supervisors app might receive events from one line, a central engineering team might
628
00:32:28,640 --> 00:32:33,320
receive approved condition data from several sites and a cloud pipeline could subscribe
629
00:32:33,320 --> 00:32:36,480
only to the topic selected for enterprise analysis.
630
00:32:36,480 --> 00:32:39,760
But don't let the topic name carry facts that belong in the message itself.
631
00:32:39,760 --> 00:32:44,600
A topic tells a consumer where a message belongs in the event structure, but the payload
632
00:32:44,600 --> 00:32:48,960
should still state what happened when the source observed it, which asset produced it,
633
00:32:48,960 --> 00:32:52,920
what the value means, and whether the source considered it good data.
634
00:32:52,920 --> 00:32:57,160
If a message gets stored, replayed, or routed elsewhere, it should remain understandable
635
00:32:57,160 --> 00:33:00,280
without asking somebody to decode a long topic string.
636
00:33:00,280 --> 00:33:02,280
Now here's where it gets interesting.
637
00:33:02,280 --> 00:33:04,200
Live state needs a different approach from events.
638
00:33:04,200 --> 00:33:06,400
A machine state is often a current fact.
639
00:33:06,400 --> 00:33:09,960
When a new consumer joins, it may need to know whether the machine is running or faulted
640
00:33:09,960 --> 00:33:12,720
right now, not wait until the next state change.
641
00:33:12,720 --> 00:33:16,640
MQTT brokers can retain a current message for a topic, so a new subscriber receives the
642
00:33:16,640 --> 00:33:18,240
latest published state.
643
00:33:18,240 --> 00:33:22,360
That works well as long as the team defines what the retained message actually represents.
644
00:33:22,360 --> 00:33:23,720
Is it the last reported state?
645
00:33:23,720 --> 00:33:25,880
Is it still trustworthy after a source outage?
646
00:33:25,880 --> 00:33:29,440
How does a consumer tell the difference between the machine is stopped?
647
00:33:29,440 --> 00:33:33,040
And the system hasn't heard from the machine for 20 minutes.
648
00:33:33,040 --> 00:33:37,680
A retained value needs a timestamp, a source quality indicator, and a freshness rule, or
649
00:33:37,680 --> 00:33:39,800
a stale state, can look live.
650
00:33:39,800 --> 00:33:41,320
That brings us to session behavior.
651
00:33:41,320 --> 00:33:44,400
Some consumers need messages only while they are connected, while others need the broker
652
00:33:44,400 --> 00:33:46,600
to hold messages until they reconnect.
653
00:33:46,600 --> 00:33:50,760
Those choices affect local storage, delivery behavior, and how much history the broker should
654
00:33:50,760 --> 00:33:51,760
carry.
655
00:33:51,760 --> 00:33:56,160
It also affects recovery after a network fault, which is why MQTT settings shouldn't be selected
656
00:33:56,160 --> 00:33:58,600
from a default template and forgotten.
657
00:33:58,600 --> 00:34:00,680
Message size is another quiet design choice.
658
00:34:00,680 --> 00:34:04,840
MQTT can transport large payloads, but that doesn't mean every message should carry a whole
659
00:34:04,840 --> 00:34:08,680
machine snapshot, recipe, alarm list, and batch record.
660
00:34:08,680 --> 00:34:11,800
Small focused events tend to travel and recover more predictably.
661
00:34:11,800 --> 00:34:15,920
If a use case needs a large file, an image, or a document, move the object through a suitable
662
00:34:15,920 --> 00:34:19,720
storage path, and publish an event that points to it.
663
00:34:19,720 --> 00:34:21,200
MQs also have limits.
664
00:34:21,200 --> 00:34:24,840
When consumers slow down or disconnect, the broker needs a clear policy.
665
00:34:24,840 --> 00:34:29,360
It may retain messages for selected clients, reject new traffic, or hit storage limits.
666
00:34:29,360 --> 00:34:34,040
You need to know which events are high priority, which can be aggregated, and which can safely
667
00:34:34,040 --> 00:34:35,040
expire.
668
00:34:35,040 --> 00:34:37,960
A queue that fills without an alert is just a delayed data loss mechanism.
669
00:34:37,960 --> 00:34:42,480
MQTT gives you a clean event backbone at the site, reducing coupling, and giving local
670
00:34:42,480 --> 00:34:45,360
and cloud consumers a common way to receive approved data.
671
00:34:45,360 --> 00:34:49,360
But a tidy hierarchy of MQTT topics doesn't create shared meaning by itself.
672
00:34:49,360 --> 00:34:53,200
A topic tree can tell you where a message came from, but it can't define who owns the data
673
00:34:53,200 --> 00:34:57,080
contract, how a fault relates to an active order, or whether two systems mean the same thing
674
00:34:57,080 --> 00:34:59,600
when both use the word running.
675
00:34:59,600 --> 00:35:04,520
That takes a unified namespace, used as a shared operational contract rather than a giant
676
00:35:04,520 --> 00:35:07,600
folder structure with better branding.
677
00:35:07,600 --> 00:35:08,600
Unified namespace.
678
00:35:08,600 --> 00:35:09,600
Useful pattern?
679
00:35:09,600 --> 00:35:11,000
Easy to misuse.
680
00:35:11,000 --> 00:35:16,760
A unified namespace, often shortened to UNS can help here, but the term gets used so loosely
681
00:35:16,760 --> 00:35:19,240
that it creates its own confusion.
682
00:35:19,240 --> 00:35:22,800
Some people describe it as one huge MQTT topic tree for the whole company.
683
00:35:22,800 --> 00:35:24,200
That's too narrow.
684
00:35:24,200 --> 00:35:28,000
Others treat it as a new central system that replaces every existing source, but that
685
00:35:28,000 --> 00:35:32,920
creates a different problem because ERP, MES, maintenance, and engineering systems still
686
00:35:32,920 --> 00:35:34,960
own facts they were built to manage.
687
00:35:34,960 --> 00:35:38,960
A useful unified namespace is a shared operational data contract.
688
00:35:38,960 --> 00:35:43,760
It gives producers and consumers a common way to identify assets, publish agreed events,
689
00:35:43,760 --> 00:35:47,520
understand payloads, and find information without building a private integration for every
690
00:35:47,520 --> 00:35:49,600
new use case.
691
00:35:49,600 --> 00:35:54,760
The contract covers names, identifies as message shape, ownership, security, and change rules.
692
00:35:54,760 --> 00:35:57,760
MQTT can carry that contract, but MQTT alone doesn't define it.
693
00:35:57,760 --> 00:36:01,240
Start with the hierarchy people already use to describe the factory.
694
00:36:01,240 --> 00:36:06,520
ISA-95 gives a useful structure, enterprise, site, area, line, cell, and asset.
695
00:36:06,520 --> 00:36:10,520
You don't need to force every building process or machine into a perfect textbook hierarchy,
696
00:36:10,520 --> 00:36:14,760
real plants rarely cooperate with textbook diagrams, but you do need a stable way to answer
697
00:36:14,760 --> 00:36:18,480
where an asset belongs and how it relates to the production structure around it.
698
00:36:18,480 --> 00:36:19,880
Take a filling machine as an example.
699
00:36:19,880 --> 00:36:24,240
It belongs to a named cell on a named line inside a defined production area at a specific
700
00:36:24,240 --> 00:36:27,920
site, and that relationship should mean the same thing, whether someone reaches it through
701
00:36:27,920 --> 00:36:33,160
an MQTT topic, a maintenance record, an MS work center, or a fabric table.
702
00:36:33,160 --> 00:36:37,200
Without that agreement, the same machine becomes line 3 filler in one system, filler
703
00:36:37,200 --> 00:36:40,120
0, 3 in another, and PLC 2 in a third.
704
00:36:40,120 --> 00:36:43,280
The data can still move, but nobody can reliably join it.
705
00:36:43,280 --> 00:36:46,280
A good UNIS also separates different kinds of information.
706
00:36:46,280 --> 00:36:47,360
Live state is one kind.
707
00:36:47,360 --> 00:36:51,440
It answers questions such as whether an asset currently reports running, stopped, blocked,
708
00:36:51,440 --> 00:36:57,000
faulted, or in changeover, and that data changes often and needs clear freshness rules.
709
00:36:57,000 --> 00:36:57,840
Definitions are different.
710
00:36:57,840 --> 00:37:02,720
An assets manufacturer, model, installed capability, engineering unit, or stable identifier might
711
00:37:02,720 --> 00:37:03,720
change rarely.
712
00:37:03,720 --> 00:37:07,120
You don't need to publish those details with every machine state event, although the
713
00:37:07,120 --> 00:37:11,520
event should carry enough identity to find the approved definition.
714
00:37:11,520 --> 00:37:13,520
All data needs its own space as well.
715
00:37:13,520 --> 00:37:19,000
OE data, energy data, quality measures, and maintenance condition indicators can describe
716
00:37:19,000 --> 00:37:22,880
a cell or line rather than one physical device.
717
00:37:22,880 --> 00:37:26,320
That distinction helps because a line level performance measure shouldn't pretend to be
718
00:37:26,320 --> 00:37:29,840
a raw control attack just because it travels through the same broker.
719
00:37:29,840 --> 00:37:31,320
Then there is ad hoc data.
720
00:37:31,320 --> 00:37:35,560
Every plant has it, a temporary diagnostic topic during commissioning, a short-lived feed
721
00:37:35,560 --> 00:37:39,440
for a new sensor, a local experiment that hasn't earned a place in the shared contract
722
00:37:39,440 --> 00:37:40,440
yet.
723
00:37:40,440 --> 00:37:44,960
So separate from governed operational data or temporary work slowly becomes the factory's
724
00:37:44,960 --> 00:37:46,280
permanent interface.
725
00:37:46,280 --> 00:37:50,560
That tends to happen more often than anyone admits this separation protects consumers.
726
00:37:50,560 --> 00:37:54,200
If a planning app subscribes to a governed production state contract, it should not break
727
00:37:54,200 --> 00:37:58,360
because an engineer adds a temporary test field to an unrelated message.
728
00:37:58,360 --> 00:38:02,480
If a quality team relies on an agreed reject event, it needs versioning and notice when
729
00:38:02,480 --> 00:38:03,720
the payload changes.
730
00:38:03,720 --> 00:38:07,080
A unified namespace works when it makes these expectations explicit.
731
00:38:07,080 --> 00:38:11,200
Spark plug can help in some environments. Spark plug is a specification built on MQTT that
732
00:38:11,200 --> 00:38:16,800
defines topic patterns, payload conventions, and session behavior for edge nodes and devices.
733
00:38:16,800 --> 00:38:20,840
It can give a team a disciplined way to report device birth, device death, current metrics
734
00:38:20,840 --> 00:38:24,640
and state reducing custom work when the ecosystem already supports it.
735
00:38:24,640 --> 00:38:28,000
But Spark plug isn't a requirement for a unified namespace.
736
00:38:28,000 --> 00:38:31,960
Forsing every device, app, and enterprise event into Spark plug can make a clean design
737
00:38:31,960 --> 00:38:36,160
harder, especially when you need business events that don't behave like device telemetry.
738
00:38:36,160 --> 00:38:40,160
Use Spark plug where its device lifecycle and metric model fit and use a clear governed
739
00:38:40,160 --> 00:38:42,080
event contract where they don't.
740
00:38:42,080 --> 00:38:46,600
Standards should reduce friction, not become another piece of machinery people work around.
741
00:38:46,600 --> 00:38:49,400
Governance is where the pattern either holds or falls apart.
742
00:38:49,400 --> 00:38:53,560
Someone needs authority over the asset naming rules, someone needs to approve a new topic
743
00:38:53,560 --> 00:38:58,600
or event type, and someone needs to own the message contract and communicate changes.
744
00:38:58,600 --> 00:39:01,920
That ownership should sit with the domain that understands the data not only with the
745
00:39:01,920 --> 00:39:03,440
team that operates the broker.
746
00:39:03,440 --> 00:39:08,240
OT may own the meaning of machine state, maintenance may own failure classifications, production
747
00:39:08,240 --> 00:39:13,240
may own OEE loss rules, IT can operate the platform and enforce access controls, and fabric
748
00:39:13,240 --> 00:39:14,840
can analyze the events.
749
00:39:14,840 --> 00:39:17,040
None of those responsibilities cancel the others.
750
00:39:17,040 --> 00:39:22,840
So, before you map an OPC UA source into MQTT, define the contract around the event.
751
00:39:22,840 --> 00:39:28,440
Its asset identity, its event type, its timestamps, its quality status, its owner, and its
752
00:39:28,440 --> 00:39:29,960
expected consumers.
753
00:39:29,960 --> 00:39:33,960
Then the protocol translation has a clear target rather than becoming another exercise in moving
754
00:39:33,960 --> 00:39:38,680
tags from one place to another, from OPC UA subscription to MQTT message.
755
00:39:38,680 --> 00:39:43,360
So, you've got your event contract in place and now the connector has a clear job.
756
00:39:43,360 --> 00:39:48,400
It subscribes to the approved OPC UA nodes, receives data changes from the server, and turns
757
00:39:48,400 --> 00:39:52,280
those into MQTT messages that other parts of the site can consume.
758
00:39:52,280 --> 00:39:56,200
You might think that's just protocol translation, but here's the thing, it's more than that.
759
00:39:56,200 --> 00:40:00,880
The connector needs to take an OPC UA notification and create a message that keeps the evidence
760
00:40:00,880 --> 00:40:03,400
from the source while fitting the shared contract.
761
00:40:03,400 --> 00:40:07,880
Drop too much detail and you lose the ability to investigate bad data later.
762
00:40:07,880 --> 00:40:13,600
Forward every technical field without structure and every consumer has to become an OPC UA specialist.
763
00:40:13,600 --> 00:40:15,400
Neither option works.
764
00:40:15,400 --> 00:40:16,880
Take a machine state change.
765
00:40:16,880 --> 00:40:21,280
The OPC UA server might report a source timestamp, a server timestamp, a status code, a node
766
00:40:21,280 --> 00:40:24,280
identifier and a value, say a number or an enumeration.
767
00:40:24,280 --> 00:40:28,360
What I recommend is normalizing that into an event with a stable asset ID, a govern signal
768
00:40:28,360 --> 00:40:32,960
name, the observed value, its unit where relevant and the quality status while also keeping
769
00:40:32,960 --> 00:40:35,000
the original node identity.
770
00:40:35,000 --> 00:40:38,360
That source reference may not appear in every business facing report, but it belongs
771
00:40:38,360 --> 00:40:42,320
in the record because when an engineer asks why an event from a packaging machine suddenly
772
00:40:42,320 --> 00:40:46,840
changed meaning after a controller update, you need a route back to the exact source node
773
00:40:46,840 --> 00:40:49,280
and connection that produced it.
774
00:40:49,280 --> 00:40:51,320
Time needs similar care.
775
00:40:51,320 --> 00:40:55,640
An OPC UA source timestamp tells you when the source observed the value, the edge received
776
00:40:55,640 --> 00:40:59,960
time tells you when the connector saw it, and the MQTT published time tells you when the
777
00:40:59,960 --> 00:41:01,760
event entered the local broker.
778
00:41:01,760 --> 00:41:06,120
These are different points in the journey and they can diverge during an outage, reconnect
779
00:41:06,120 --> 00:41:07,360
or queue backlog.
780
00:41:07,360 --> 00:41:08,840
Don't replace one with another.
781
00:41:08,840 --> 00:41:12,720
Use the source timestamp as the event time when the source provides it and the quality
782
00:41:12,720 --> 00:41:17,080
is acceptable and keep the receive and publish times as operational evidence.
783
00:41:17,080 --> 00:41:21,080
Later when fabric receives a late batch of messages, your team can separate an old machine
784
00:41:21,080 --> 00:41:24,400
event from a new message delivery, the same applies to quality.
785
00:41:24,400 --> 00:41:29,800
If OPC UA reports a bad or uncertain value, publish that status with the message.
786
00:41:29,800 --> 00:41:34,360
You may root it differently, exclude it from a production calculation or raise a data
787
00:41:34,360 --> 00:41:35,960
quality issue.
788
00:41:35,960 --> 00:41:39,400
What you should not do is strip the quality code at the edge and let a downstream calculation
789
00:41:39,400 --> 00:41:41,680
treat every value as equally trustworthy.
790
00:41:41,680 --> 00:41:43,120
Now consider the message itself.
791
00:41:43,120 --> 00:41:47,880
For a machine state event, a focus payload may include the asset ID, signal name, value,
792
00:41:47,880 --> 00:41:52,080
source time, quality and a reference to the original OPC UA node.
793
00:41:52,080 --> 00:41:54,280
For a temperature measurement, add the agreed unit.
794
00:41:54,280 --> 00:41:58,040
For an alarm or fault event, include the event identifier, fault code, severity of the
795
00:41:58,040 --> 00:42:01,960
source provides it and the text only if that text is fit for wider use.
796
00:42:01,960 --> 00:42:03,440
Keep the message type clear.
797
00:42:03,440 --> 00:42:07,200
A current state message is not the same as a fault event and account update is not the
798
00:42:07,200 --> 00:42:08,840
same as a quality reject.
799
00:42:08,840 --> 00:42:12,920
When you force all of them into one vague telemetry shape, consumers need hidden rules
800
00:42:12,920 --> 00:42:14,920
to figure out what they received.
801
00:42:14,920 --> 00:42:17,040
Clear event types, reduce that guesswork.
802
00:42:17,040 --> 00:42:20,920
You also need to decide whether the connector publishes each update as soon as it arrives
803
00:42:20,920 --> 00:42:24,880
or batches several updates into a message, publish on change works well when the decision
804
00:42:24,880 --> 00:42:29,360
depends on a fast change, a machine fault or a transition into a blocked state.
805
00:42:29,360 --> 00:42:33,480
But it can also create heavy traffic if a value change is constantly or several nodes report
806
00:42:33,480 --> 00:42:34,480
at once.
807
00:42:34,480 --> 00:42:38,320
Batching reduces message overhead and can make cloud transport more efficient, but it adds
808
00:42:38,320 --> 00:42:41,800
delay and can blur the order of events if the payload doesn't preserve individual
809
00:42:41,800 --> 00:42:42,800
timestamps.
810
00:42:42,800 --> 00:42:47,320
A batch may suit routine condition data, but it may be the wrong choice for alarms that
811
00:42:47,320 --> 00:42:49,120
need a quick local response.
812
00:42:49,120 --> 00:42:52,240
Choose based on decision speed, not transport convenience.
813
00:42:52,240 --> 00:42:54,880
Deadband settings help with noisy analog signals.
814
00:42:54,880 --> 00:42:57,960
Instead of sending every small movement in a temperature or pressure value, the connector
815
00:42:57,960 --> 00:43:01,840
publishes only when the value changes by a meaningful amount and the threshold should
816
00:43:01,840 --> 00:43:07,080
come from process knowledge, not from somebody guessing how much traffic the broker can tolerate.
817
00:43:07,080 --> 00:43:11,000
Rate limit solver related problem, a source can produce more events than a downstream consumer
818
00:43:11,000 --> 00:43:12,000
needs.
819
00:43:12,000 --> 00:43:15,800
It's decided to publish no more than one routine value per interval while still sending any
820
00:43:15,800 --> 00:43:18,840
threshold, breach or quality change immediately.
821
00:43:18,840 --> 00:43:22,360
That rule needs to be visible and documented because a rate limited signal is no longer
822
00:43:22,360 --> 00:43:24,840
a full record of every source change.
823
00:43:24,840 --> 00:43:29,040
There is no universal setting, fault codes may require every change, utility values may
824
00:43:29,040 --> 00:43:33,680
work well as periodic readings, and high frequency waveforms may need a local calculation
825
00:43:33,680 --> 00:43:35,720
before any message leaves the edge.
826
00:43:35,720 --> 00:43:38,760
The signal contract should state which behavior applies and why.
827
00:43:38,760 --> 00:43:42,880
At this point the connector has done its work and approved OPC UA notification has become
828
00:43:42,880 --> 00:43:48,000
a structured MQTT event with its origin, time, quality and meaning intact enough for other
829
00:43:48,000 --> 00:43:49,000
systems to use.
830
00:43:49,000 --> 00:43:53,880
Now let's test that design against the packaging cell because this is where clean message contracts
831
00:43:53,880 --> 00:43:57,200
meet the messier behavior of a real production process.
832
00:43:57,200 --> 00:43:59,560
A packaging cell walk through.
833
00:43:59,560 --> 00:44:03,040
Let's put this into one packaging cell and see where the design holds up.
834
00:44:03,040 --> 00:44:07,160
Picture a machine that receives filled products, applies the final packaging, checks the label,
835
00:44:07,160 --> 00:44:09,600
and sends the finished unit toward palatizing.
836
00:44:09,600 --> 00:44:14,000
It reports a machine state, a good part count, a reject count, current speed and fault conditions
837
00:44:14,000 --> 00:44:16,120
through its OPC UA server.
838
00:44:16,120 --> 00:44:20,800
On paper that looks like five simple signals, but on a real line each one needs context before
839
00:44:20,800 --> 00:44:23,040
anyone uses it to judge production.
840
00:44:23,040 --> 00:44:24,560
Start with the machine state.
841
00:44:24,560 --> 00:44:28,960
The controller might expose a numeric state or a few separate bits for running, faulted
842
00:44:28,960 --> 00:44:31,000
automatic mode and ready.
843
00:44:31,000 --> 00:44:34,480
The edge contract should translate that into an agreed state model, but it must preserve
844
00:44:34,480 --> 00:44:35,800
the source values too.
845
00:44:35,800 --> 00:44:40,120
If the machine enters change over, that state needs to travel as change over, not as a generic
846
00:44:40,120 --> 00:44:41,120
stop.
847
00:44:41,120 --> 00:44:43,080
That changes the downstream interpretation.
848
00:44:43,080 --> 00:44:46,600
During a change over, the good part count may stop, the machine speed may fall to zero,
849
00:44:46,600 --> 00:44:50,920
and an operator may open guards, load new film, change label stock, or just guides for a
850
00:44:50,920 --> 00:44:52,360
new product format.
851
00:44:52,360 --> 00:44:55,320
None of that automatically means loss production time.
852
00:44:55,320 --> 00:45:00,640
If your event stream sees only speed equals zero, it will often create false downtime,
853
00:45:00,640 --> 00:45:04,200
and that is how a dashboard can look very precise and still be wrong.
854
00:45:04,200 --> 00:45:08,080
So the packaging cell needs an explicit change over state, either from the machine, the
855
00:45:08,080 --> 00:45:10,600
MES, or a controlled operator event.
856
00:45:10,600 --> 00:45:14,400
The source depends on the plant, but what matters is that the production calculation can
857
00:45:14,400 --> 00:45:18,480
tell the difference between a planned format change and an unexpected fault.
858
00:45:18,480 --> 00:45:20,400
Now look at short interruptions.
859
00:45:20,400 --> 00:45:24,840
Packaging equipment can stop for very brief periods, a carton misfeeds, a sensor misses a
860
00:45:24,840 --> 00:45:27,920
product, or a downstream conveyor blocks for a moment.
861
00:45:27,920 --> 00:45:31,680
The machine stops, recovers, and runs again before anyone has time to open a maintenance
862
00:45:31,680 --> 00:45:36,120
ticket, and those microstops can matter because repeated short stops can reduce output
863
00:45:36,120 --> 00:45:38,520
long before a major fault appears.
864
00:45:38,520 --> 00:45:43,240
But sending every pulse, state, flicker, and sensor edge to the cloud may create a noisy
865
00:45:43,240 --> 00:45:45,560
stream that nobody can interpret.
866
00:45:45,560 --> 00:45:49,000
The edge can help by keeping the detailed signal evidence locally while creating useful
867
00:45:49,000 --> 00:45:50,000
events upstream.
868
00:45:50,000 --> 00:45:54,520
For example, it can detect repeated stop and run cycles within a defined time window and
869
00:45:54,520 --> 00:45:59,160
publish a microstop summary that carries the asset ID, the time window, the number of
870
00:45:59,160 --> 00:46:00,160
interruptions.
871
00:46:00,160 --> 00:46:04,160
The total stopped time and the dominant reason if the machine provides one.
872
00:46:04,160 --> 00:46:06,480
The rule needs agreement from production and maintenance.
873
00:46:06,480 --> 00:46:10,040
A five second interruption may count as a microstop on one process and mean nothing on
874
00:46:10,040 --> 00:46:11,040
another.
875
00:46:11,040 --> 00:46:13,760
There is no universal threshold hiding in a vendor manual.
876
00:46:13,760 --> 00:46:16,480
Fault events need more detail than routine state changes.
877
00:46:16,480 --> 00:46:21,160
When the packaging machine enters a fault state, the event should include the fault code,
878
00:46:21,160 --> 00:46:24,160
source time, machine identity, and source quantity.
879
00:46:24,160 --> 00:46:28,480
If the machine provides an alarm class or severity included and if the machine can expose
880
00:46:28,480 --> 00:46:33,920
a current job reference that can travel to, but label it as machine reported context rather
881
00:46:33,920 --> 00:46:37,560
than assuming it is the final authority for the active order.
882
00:46:37,560 --> 00:46:39,280
That distinction saves travel later.
883
00:46:39,280 --> 00:46:43,280
A fault event might report that the label detected missing labels.
884
00:46:43,280 --> 00:46:46,800
Maintenance can use the code to begin diagnosis and production can see that the cell cannot
885
00:46:46,800 --> 00:46:48,440
produce finished packs.
886
00:46:48,440 --> 00:46:52,520
Yet the full order impact still depends on the M.S. record of the active operation and
887
00:46:52,520 --> 00:46:54,400
the latest execution state.
888
00:46:54,400 --> 00:46:59,000
The machine tells us it stopped, but the wider production model tells us what it interrupted.
889
00:46:59,000 --> 00:47:00,320
Reject data follows the same pattern.
890
00:47:00,320 --> 00:47:04,120
A reject counter can show that units left the normal flow, but it may not tell you which
891
00:47:04,120 --> 00:47:08,200
product variant they belong to, which batch produced them or which inspection point caused
892
00:47:08,200 --> 00:47:09,800
the rejection.
893
00:47:09,800 --> 00:47:13,480
A reject from an in-line vision check may have a different meaning from a reject caused
894
00:47:13,480 --> 00:47:16,160
by a packaging seal check.
895
00:47:16,160 --> 00:47:19,520
The event needs a clear source reference and time and later in the data flow, it can
896
00:47:19,520 --> 00:47:24,000
link to the product variant, batch and process step that applied during that period.
897
00:47:24,000 --> 00:47:27,480
But later link matters because packaging cells may switch products, materials and label
898
00:47:27,480 --> 00:47:29,440
formats during the same shift.
899
00:47:29,440 --> 00:47:30,680
Speed brings another trap.
900
00:47:30,680 --> 00:47:34,520
A speed value can help show whether the machine runs below its expected rate, but expected
901
00:47:34,520 --> 00:47:39,240
rate changes with the product, pack size, setup and sometimes the material.
902
00:47:39,240 --> 00:47:43,120
Comparing every run against one nominal maximum speed produces a neat performance metric
903
00:47:43,120 --> 00:47:45,080
and a fairly poor production conversation.
904
00:47:45,080 --> 00:47:49,400
The cell needs a product aware target from the process definition, not just a fast number
905
00:47:49,400 --> 00:47:50,560
from the controller.
906
00:47:50,560 --> 00:47:54,400
So this small packaging cell produces a useful pattern, state events tell us whether the
907
00:47:54,400 --> 00:47:59,120
machine can run, counts show output, rejects show losses, speed shows behavior against an
908
00:47:59,120 --> 00:48:03,320
agreed process expectation and faults provide evidence for maintenance.
909
00:48:03,320 --> 00:48:07,400
Each event needs a source, a timestamp and a meaning that can survive beyond the machine.
910
00:48:07,400 --> 00:48:10,720
Once the cell publishes those events locally, the next question is how they leave the site
911
00:48:10,720 --> 00:48:14,880
and reach Microsoft fabric without losing that meaning on the way, getting events from
912
00:48:14,880 --> 00:48:17,720
the site to Azure and fabric.
913
00:48:17,720 --> 00:48:21,640
So the packaging cell is already publishing approved events locally that handles distribution
914
00:48:21,640 --> 00:48:25,000
within the plant, but it does not put anything into Microsoft fabric yet.
915
00:48:25,000 --> 00:48:26,720
Now here's the cloud bridge.
916
00:48:26,720 --> 00:48:29,000
Its job sounds simple in theory.
917
00:48:29,000 --> 00:48:32,760
Grab selected events from the site, push them through an authenticated outbound connection
918
00:48:32,760 --> 00:48:36,480
and land them in the cloud without losing the evidence you need to make sense of them
919
00:48:36,480 --> 00:48:37,800
later.
920
00:48:37,800 --> 00:48:40,520
There are a couple of common Microsoft patterns to pick from.
921
00:48:40,520 --> 00:48:44,760
With Azure IoT operations, a data flow at the edge can subscribe to local MQTT topics
922
00:48:44,760 --> 00:48:49,280
and forward selected events to a cloud destination that keeps the local broker as the source for
923
00:48:49,280 --> 00:48:53,440
site events while the data flow decides which events leave the plant and what shape they
924
00:48:53,440 --> 00:48:54,440
take.
925
00:48:54,440 --> 00:48:57,720
With Azure IoT Edge, the usual path goes through IoT Hub.
926
00:48:57,720 --> 00:49:02,240
Edge modules send telemetry upstream, IoT Hub receives it and downstream consumers read
927
00:49:02,240 --> 00:49:06,640
the event stream through the compatible event hubs endpoint or a configured route.
928
00:49:06,640 --> 00:49:08,040
Both patterns can reach fabric.
929
00:49:08,040 --> 00:49:10,120
Neither one gives you production context by itself.
930
00:49:10,120 --> 00:49:12,920
The choice should follow the edge design you already made.
931
00:49:12,920 --> 00:49:16,880
If the plant uses Azure IoT operations as a site data layer, then use its data flows and
932
00:49:16,880 --> 00:49:19,360
broker integration as part of that operating model.
933
00:49:19,360 --> 00:49:24,480
If you have a focused IoT Edge gateway connected through IoT Hub that can still work fine for
934
00:49:24,480 --> 00:49:28,480
a defined workload, don't create two cloud paths for the same event unless you have a clear
935
00:49:28,480 --> 00:49:29,480
reason.
936
00:49:29,480 --> 00:49:31,920
Duplicate paths look harmless in a proof of concept.
937
00:49:31,920 --> 00:49:35,960
Then one path gets a schema update, the other gets a different retry rule and two dash
938
00:49:35,960 --> 00:49:38,680
boards start disagreeing about the same machine stop.
939
00:49:38,680 --> 00:49:41,880
The factory does not need another argument about which number is correct.
940
00:49:41,880 --> 00:49:45,720
Once events arrive in Azure, fabric event stream works as a streaming intake and routing
941
00:49:45,720 --> 00:49:46,720
layer.
942
00:49:46,720 --> 00:49:50,920
It can consume data from supported streaming sources, apply light shaping where that makes sense
943
00:49:50,920 --> 00:49:53,520
and send the stream onward to fabric destinations.
944
00:49:53,520 --> 00:49:57,800
Think of event stream as the hand off point into fabrics real time data services.
945
00:49:57,800 --> 00:50:01,640
It receives events in motion and directs them to places where they can be stored, queried
946
00:50:01,640 --> 00:50:04,000
or used by downstream processes.
947
00:50:04,000 --> 00:50:07,120
Before connecting it though, you have to deal with the unglamorous work.
948
00:50:07,120 --> 00:50:10,040
Identity, network access and delivery monitoring.
949
00:50:10,040 --> 00:50:15,080
The edge host or edge cluster needs a narrowly scoped identity for the cloud destination.
950
00:50:15,080 --> 00:50:19,800
Avoid shared connection strings that get copied between sites, environments and applications.
951
00:50:19,800 --> 00:50:24,000
When one of those ends up in a config file or a support ticket, you have no clean way to
952
00:50:24,000 --> 00:50:26,560
know who used it or what else it can reach.
953
00:50:26,560 --> 00:50:30,520
Use separate credentials or managed identities where the services support them and restrict
954
00:50:30,520 --> 00:50:33,600
each one to the smallest set of permissions needed.
955
00:50:33,600 --> 00:50:37,920
A site that can send telemetry does not need broad rights to read other sites data, administer
956
00:50:37,920 --> 00:50:40,840
fabric workspaces or change cloud resources.
957
00:50:40,840 --> 00:50:42,560
Network egress needs the same discipline.
958
00:50:42,560 --> 00:50:47,040
The plant network team should know exactly which outbound destinations the edge layer requires.
959
00:50:47,040 --> 00:50:52,000
The cloud endpoint, the protocol, the ports and any proxy or name resolution dependency.
960
00:50:52,000 --> 00:50:55,960
If the path crosses a DMZ, tested under the actual rules rather than assuming a successful
961
00:50:55,960 --> 00:50:58,440
laptop test proves the production route works.
962
00:50:58,440 --> 00:51:01,920
Consumer isolation also matters after the messages reach the cloud.
963
00:51:01,920 --> 00:51:03,880
Several consumers may need the same source stream.
964
00:51:03,880 --> 00:51:05,280
One may feed fabric.
965
00:51:05,280 --> 00:51:09,400
Other may support a historian, a quality application or an operational archive.
966
00:51:09,400 --> 00:51:13,160
Give those consumers independent positions where the transport supports it so one slow or
967
00:51:13,160 --> 00:51:16,160
broken consumer does not interfere with another team's data path.
968
00:51:16,160 --> 00:51:18,600
That separation gives you cleaner incident handling.
969
00:51:18,600 --> 00:51:22,840
If the fabric consumer stops reading for a while, you should be able to see its lag, reconnected
970
00:51:22,840 --> 00:51:26,960
and assess the affected time range without changing the source connector or interrupting
971
00:51:26,960 --> 00:51:28,680
local users.
972
00:51:28,680 --> 00:51:33,120
A data pipeline needs the same operational visibility as any other production service.
973
00:51:33,120 --> 00:51:36,960
Watch delivery, not just connection status, a green connector status can hide a growing
974
00:51:36,960 --> 00:51:41,720
queue, delay events, rejected messages or a consumer that has silently stopped moving
975
00:51:41,720 --> 00:51:42,720
data.
976
00:51:42,720 --> 00:51:47,000
Measure the age of the newest received event, the gap between source time and cloud arrival
977
00:51:47,000 --> 00:51:51,080
time, error counts, retry activity and backlog size were available.
978
00:51:51,080 --> 00:51:54,360
Those checks tell you whether the data is still useful for the decision it was meant to
979
00:51:54,360 --> 00:51:55,680
support.
980
00:51:55,680 --> 00:51:57,720
Design for duplicates from day one.
981
00:51:57,720 --> 00:52:01,280
Reliable message delivery often means an event can arrive more than once after a reconnect
982
00:52:01,280 --> 00:52:03,840
or retry that is not automatically a fault.
983
00:52:03,840 --> 00:52:08,720
It becomes a problem when a downstream calculation treats every arrival as a new machine stop, a new
984
00:52:08,720 --> 00:52:13,400
reject or a new production count, give events stable identifiers where the source can provide
985
00:52:13,400 --> 00:52:14,400
them.
986
00:52:14,400 --> 00:52:16,080
Preserve sequence numbers when they exist.
987
00:52:16,080 --> 00:52:20,240
Combine acid identity, event type, source time and source sequence carefully when you need
988
00:52:20,240 --> 00:52:21,760
a deduplication rule.
989
00:52:21,760 --> 00:52:25,880
Then test that rule with real replay scenarios, not just a happy path stream, delayed events
990
00:52:25,880 --> 00:52:26,880
need equal care.
991
00:52:26,880 --> 00:52:30,680
A fault that occurred during a site outage may arrive after production has already moved
992
00:52:30,680 --> 00:52:31,680
on.
993
00:52:31,680 --> 00:52:35,240
Fabric should still store it as a historical event but the alerting or operational logic must
994
00:52:35,240 --> 00:52:36,240
know it is late.
995
00:52:36,240 --> 00:52:40,640
Otherwise a technician gets a new alarm for a problem that someone fixed an hour ago.
996
00:52:40,640 --> 00:52:43,560
Arrival time and event time both belong in the message path.
997
00:52:43,560 --> 00:52:47,320
With that in place the data has crossed from the factory into fabric without pretending
998
00:52:47,320 --> 00:52:49,040
that delivery equals meaning.
999
00:52:49,040 --> 00:52:52,720
Next we can follow the stream inside fabric and look at what event stream should handle
1000
00:52:52,720 --> 00:52:54,760
and what it should leave alone.
1001
00:52:54,760 --> 00:52:59,200
Fabric event stream, routing, not manufacturing context.
1002
00:52:59,200 --> 00:53:03,440
Once the event reaches fabric, event stream gives you a place to receive it, apply basic
1003
00:53:03,440 --> 00:53:06,640
stream processing and send it to one or more destinations.
1004
00:53:06,640 --> 00:53:07,640
That is useful.
1005
00:53:07,640 --> 00:53:10,840
It is also where teams can give event stream too much responsibility.
1006
00:53:10,840 --> 00:53:13,320
Event stream works well for actions close to the moving data.
1007
00:53:13,320 --> 00:53:17,760
You can filter out messages no consumer needs, select or rename fields, split streams based
1008
00:53:17,760 --> 00:53:22,640
on content, apply straight forward transformations and send different event types to different fabric
1009
00:53:22,640 --> 00:53:23,640
destinations.
1010
00:53:23,640 --> 00:53:28,120
For example, a site may send state changes, fault events, counters and condition readings
1011
00:53:28,120 --> 00:53:30,400
through one controlled intake path.
1012
00:53:30,400 --> 00:53:33,960
Event stream can root fault and state events toward a low latency operational path, while
1013
00:53:33,960 --> 00:53:36,760
also sending selected data to a longer term history path.
1014
00:53:36,760 --> 00:53:38,240
That fan out is a sensible design.
1015
00:53:38,240 --> 00:53:40,600
The maintenance team may need recent fault events quickly.
1016
00:53:40,600 --> 00:53:44,000
A reliability engineer may need months of condition history later.
1017
00:53:44,000 --> 00:53:47,080
Finance may only need a daily measure of energy per finished unit.
1018
00:53:47,080 --> 00:53:50,720
Those are different uses of the same source data and they do not need the same refresh rate
1019
00:53:50,720 --> 00:53:52,040
or storage pattern.
1020
00:53:52,040 --> 00:53:54,320
Keep the routing decision close to the event purpose.
1021
00:53:54,320 --> 00:53:57,880
A fault event might go to a live analysis destination with little delay.
1022
00:53:57,880 --> 00:54:02,280
A high volume routine measurement might go through a filter or aggregation first.
1023
00:54:02,280 --> 00:54:06,040
Raw source events may also need a protected landing route, especially while the team is
1024
00:54:06,040 --> 00:54:08,200
still learning how the machine behaves.
1025
00:54:08,200 --> 00:54:10,080
That last point matters more than it sounds.
1026
00:54:10,080 --> 00:54:14,400
If you transform an event aggressively at the first step, you can lose the evidence needed
1027
00:54:14,400 --> 00:54:16,840
to challenge your own assumptions later.
1028
00:54:16,840 --> 00:54:20,800
Someone may decide a state transition is irrelevant, filter it out, and then discover
1029
00:54:20,800 --> 00:54:24,960
months later that the missing transition explained a recurring production loss.
1030
00:54:24,960 --> 00:54:27,880
Preserve recoverable source data before you start simplifying it.
1031
00:54:27,880 --> 00:54:30,080
This does not mean you must keep every bite forever.
1032
00:54:30,080 --> 00:54:33,280
It means retention, filtering and aggregation need an explicit reason.
1033
00:54:33,280 --> 00:54:37,840
You should know what remains available for investigation, how long it remains available,
1034
00:54:37,840 --> 00:54:41,400
and which transformation created a derived event or measure.
1035
00:54:41,400 --> 00:54:45,120
Event stream can also handle light cleanup that prevents obvious friction downstream.
1036
00:54:45,120 --> 00:54:49,600
You may discard a field that no approved consumer can use, standardize a field name, filter
1037
00:54:49,600 --> 00:54:54,000
out known test messages, or separate a machine event stream from a stream of connector
1038
00:54:54,000 --> 00:54:55,160
health messages.
1039
00:54:55,160 --> 00:54:58,840
Those are contained jobs they are easy to test, complex production logic belong somewhere
1040
00:54:58,840 --> 00:54:59,840
else.
1041
00:54:59,840 --> 00:55:04,320
Suppose you need to decide whether a machine stop counts as planned downtime, an equipment
1042
00:55:04,320 --> 00:55:08,160
failure, material starvation, or a change over delay.
1043
00:55:08,160 --> 00:55:13,800
That decision may depend on machine state, shift plan, MES execution events, operator input,
1044
00:55:13,800 --> 00:55:15,200
and an agreed loss model.
1045
00:55:15,200 --> 00:55:18,840
Trying to bury that rule in a streaming canvas usually creates logic that becomes hard
1046
00:55:18,840 --> 00:55:20,720
to inspect, change and govern.
1047
00:55:20,720 --> 00:55:25,760
It may work right up until the next product launch, line rebuild, or shift pattern change.
1048
00:55:25,760 --> 00:55:28,120
Keep event stream focused on stream handling.
1049
00:55:28,120 --> 00:55:32,200
Put business rules where the domain team can test version explain and own them.
1050
00:55:32,200 --> 00:55:35,760
Schema variation is another issue that appears quickly in industrial data.
1051
00:55:35,760 --> 00:55:40,520
A connector may send one shape for a simple state change, another for an OPC UAL arm, and
1052
00:55:40,520 --> 00:55:42,080
another for a batch of measurements.
1053
00:55:42,080 --> 00:55:45,280
A machine supplier may add a field after a firmware update.
1054
00:55:45,280 --> 00:55:49,640
One older asset may represent a value as text, while a newer asset sends a number.
1055
00:55:49,640 --> 00:55:54,280
Jason makes this look flexible at first, then a downstream table, query or transformation,
1056
00:55:54,280 --> 00:55:56,200
expects one shape and meets another.
1057
00:55:56,200 --> 00:55:57,520
You need a deliberate approach here.
1058
00:55:57,520 --> 00:56:01,800
For mixed event types, keep a clear event type field and a stable envelope around the payload.
1059
00:56:01,800 --> 00:56:06,600
The envelope can carry common facts such as event ID, asset ID, source time, arrival time,
1060
00:56:06,600 --> 00:56:07,920
quality, and contract version.
1061
00:56:07,920 --> 00:56:12,200
The payload can retain source specific detail without forcing every signal into a giant
1062
00:56:12,200 --> 00:56:14,240
flat record full of empty fields.
1063
00:56:14,240 --> 00:56:16,960
When a schema changes, treat it as a control to change.
1064
00:56:16,960 --> 00:56:19,400
Ask whether existing consumers can handle it.
1065
00:56:19,400 --> 00:56:21,440
Decide whether a new version is needed.
1066
00:56:21,440 --> 00:56:23,920
Test the change with representative production messages.
1067
00:56:23,920 --> 00:56:27,800
Do not wait for an overnight failure to discover that a fault code arrived as a nested object
1068
00:56:27,800 --> 00:56:28,800
instead of a string.
1069
00:56:28,800 --> 00:56:31,520
There is also a practical limit to no code transforms.
1070
00:56:31,520 --> 00:56:33,560
They are helpful for simple rooting and shaping.
1071
00:56:33,560 --> 00:56:37,960
But once you need state for logic, difficult joints, historical correction or complex quality
1072
00:56:37,960 --> 00:56:40,840
rules, move the work to a place built for that job.
1073
00:56:40,840 --> 00:56:45,040
Otherwise the stream turns into a not a visual rules that only one person understands,
1074
00:56:45,040 --> 00:56:47,200
and that person is always on holiday when it breaks.
1075
00:56:47,200 --> 00:56:51,640
So treat fabric event stream as a controlled front door and routing layer for events in motion.
1076
00:56:51,640 --> 00:56:56,280
It can receive, filter, shape, and direct industrial data with very little delay.
1077
00:56:56,280 --> 00:56:59,960
It cannot decide what a machine fault means for production, simply because the fault
1078
00:56:59,960 --> 00:57:01,320
reached fabric quickly.
1079
00:57:01,320 --> 00:57:05,400
For live investigation of those events, event house and its KQL database usually fit the
1080
00:57:05,400 --> 00:57:08,600
next part of the path better than a lake house alone.
1081
00:57:08,600 --> 00:57:12,280
Event house and KQL for live industrial events.
1082
00:57:12,280 --> 00:57:16,160
If you are working with live industrial events, event house is usually the next place to look.
1083
00:57:16,160 --> 00:57:18,840
Event house is fabric's container for real time event analysis.
1084
00:57:18,840 --> 00:57:23,800
Inside it, a KQL database stores the events and lets you query them with custochury language.
1085
00:57:23,800 --> 00:57:25,480
KQL for short.
1086
00:57:25,480 --> 00:57:27,320
The question it answers is straightforward.
1087
00:57:27,320 --> 00:57:30,720
What happened on this asset during this time window and what changed around it?
1088
00:57:30,720 --> 00:57:35,240
That fits factory telemetry really well because machine data shows up as a stream of time-stamped
1089
00:57:35,240 --> 00:57:36,240
events.
1090
00:57:36,240 --> 00:57:39,960
Event flips from running to blocked, a fault code fires, a temperature drifts outside an
1091
00:57:39,960 --> 00:57:44,200
expected band, a counter stops climbing when the schedule says it should be producing.
1092
00:57:44,200 --> 00:57:47,360
You can dig into those patterns without waiting for a scheduled data load.
1093
00:57:47,360 --> 00:57:50,480
KQL is built for asking questions over events and time.
1094
00:57:50,480 --> 00:57:54,200
You filter for one asset, look at the last hour group events into time intervals, compare
1095
00:57:54,200 --> 00:57:57,960
recent behavior with earlier periods, and trace a sequence of state changes.
1096
00:57:57,960 --> 00:57:59,840
For example, say the packaging cell stops.
1097
00:57:59,840 --> 00:58:03,640
A production engineer wants to know whether the stop started with a fault, whether the machine
1098
00:58:03,640 --> 00:58:07,840
moved through a blocked state first, and whether similar stops happened during the same shift.
1099
00:58:07,840 --> 00:58:09,240
That is a time series question.
1100
00:58:09,240 --> 00:58:13,320
The engineer doesn't need to extract a file, wait for a batch job, and hope the latest
1101
00:58:13,320 --> 00:58:14,560
refresh finished.
1102
00:58:14,560 --> 00:58:18,440
They need to query the recent event history, isolate the cell and inspect the sequence by
1103
00:58:18,440 --> 00:58:19,640
event time.
1104
00:58:19,640 --> 00:58:21,920
Event house can support that kind of investigation.
1105
00:58:21,920 --> 00:58:25,880
It's well suited to recent machine states, alarms, condition readings, connector health
1106
00:58:25,880 --> 00:58:30,000
events, any data that arrives continuously and needs fast analysis.
1107
00:58:30,000 --> 00:58:33,160
But fast queries only help if the event design supports them.
1108
00:58:33,160 --> 00:58:38,440
If every incoming message lands as an unstructured block of JSON with no consistent asset identifier,
1109
00:58:38,440 --> 00:58:43,320
event type, timestamp, or quality field, the data may be present but awkward to use.
1110
00:58:43,320 --> 00:58:47,040
You end up spending your time unpacking payloads instead of answering production questions.
1111
00:58:47,040 --> 00:58:50,920
A useful event house table keeps the common event facts easy to query.
1112
00:58:50,920 --> 00:58:55,800
That usually includes the stable asset ID, event type, source time, fabric arrival time,
1113
00:58:55,800 --> 00:58:58,960
source quality, contract version, and a source reference.
1114
00:58:58,960 --> 00:59:02,920
The raw payload can stay available as evidence, while the fields that operations repeatedly
1115
00:59:02,920 --> 00:59:04,720
need sit in a consistent form.
1116
00:59:04,720 --> 00:59:07,080
That gives you both speed and traceability.
1117
00:59:07,080 --> 00:59:11,440
Say a supervisor asks, which machines entered a fault state during the last shift and how
1118
00:59:11,440 --> 00:59:13,160
long did each one stay there?
1119
00:59:13,160 --> 00:59:17,440
With a clear state event structure, KQL can retrieve the relevant transitions quickly.
1120
00:59:17,440 --> 00:59:21,600
If the answer looks wrong, the team can still inspect the original source payload and trace
1121
00:59:21,600 --> 00:59:22,920
it back through the edge path.
1122
00:59:22,920 --> 00:59:27,240
That's a much better position than arguing over a chart with no source evidence.
1123
00:59:27,240 --> 00:59:28,440
Retention needs a decision too.
1124
00:59:28,440 --> 00:59:31,680
Event house works best when you treat it as a live and recent event store for questions
1125
00:59:31,680 --> 00:59:33,120
people genuinely ask.
1126
00:59:33,120 --> 00:59:37,160
How much recent history should stay immediately available depends on the operation?
1127
00:59:37,160 --> 00:59:39,680
Maintenance may need weeks or months of recent fault history.
1128
00:59:39,680 --> 00:59:42,800
A shift team may focus on the current shift and recent days.
1129
00:59:42,800 --> 00:59:45,680
Engineering may need longer windows for some condition signals.
1130
00:59:45,680 --> 00:59:48,680
There isn't a standard number that fits every event type.
1131
00:59:48,680 --> 00:59:53,360
A high rate measurement retained at full detail for a long period can consume capacity without
1132
00:59:53,360 --> 00:59:54,360
helping anyone.
1133
00:59:54,360 --> 00:59:58,720
A fault event or state transition carries far more operational meaning per record and may
1134
00:59:58,720 --> 01:00:01,080
deserve longer immediate retention.
1135
01:00:01,080 --> 01:00:05,080
That retention based on investigation needs legal or quality obligations, event volume and
1136
01:00:05,080 --> 01:00:08,680
cost, then review it after people start using the data.
1137
01:00:08,680 --> 01:00:11,960
Anomaly detection can also run against time based data in event house.
1138
01:00:11,960 --> 01:00:14,320
This is useful when you have a defined signal problem.
1139
01:00:14,320 --> 01:00:18,760
A temperature drifting from its normal pattern and unusual vibration trend or a machine cycling
1140
01:00:18,760 --> 01:00:21,160
between states more often than expected.
1141
01:00:21,160 --> 01:00:22,480
But the wording matters.
1142
01:00:22,480 --> 01:00:25,360
And anomaly means the data differs from an expected pattern.
1143
01:00:25,360 --> 01:00:27,040
It does not diagnose a root cause.
1144
01:00:27,040 --> 01:00:28,720
It does not prove a bearing will fail.
1145
01:00:28,720 --> 01:00:30,520
It does not create a maintenance plan.
1146
01:00:30,520 --> 01:00:32,840
A detection result should begin in investigation.
1147
01:00:32,840 --> 01:00:37,720
If a vibration trend looks unusual, the maintenance team still needs asset history, process conditions,
1148
01:00:37,720 --> 01:00:40,600
inspection evidence and their own knowledge of the equipment.
1149
01:00:40,600 --> 01:00:43,240
An anomaly tool can point attention toward a problem.
1150
01:00:43,240 --> 01:00:46,520
It can't replace the work of determining whether the problem is real and what action is
1151
01:00:46,520 --> 01:00:47,520
safe.
1152
01:00:47,520 --> 01:00:50,240
Use it whether signal, baseline and response are clear.
1153
01:00:50,240 --> 01:00:54,560
For example, a known process temperature may have a normal range that changes by product
1154
01:00:54,560 --> 01:00:55,560
and operating state.
1155
01:00:55,560 --> 01:00:59,760
If the data model captures those conditions, a detected deviation can become a useful event
1156
01:00:59,760 --> 01:01:01,240
for engineering review.
1157
01:01:01,240 --> 01:01:05,320
Without that context, the system may simply alert whenever the plant runs a different product.
1158
01:01:05,320 --> 01:01:06,320
That is not intelligence.
1159
01:01:06,320 --> 01:01:08,880
That is a calendar problem wearing an AI label.
1160
01:01:08,880 --> 01:01:13,200
So event house and KQL give fabric a strong place to store and investigate live industrial
1161
01:01:13,200 --> 01:01:14,200
events.
1162
01:01:14,200 --> 01:01:18,200
They support rapid questions over false states, thresholds and time windows while retention
1163
01:01:18,200 --> 01:01:21,000
keeps the live store tied to real operating needs.
1164
01:01:21,000 --> 01:01:24,440
Still, live event analysis is only one part of the data path.
1165
01:01:24,440 --> 01:01:28,240
Some questions need longer history, broader joins and slower engineering work.
1166
01:01:28,240 --> 01:01:30,120
That brings us to the lake house path next.
1167
01:01:30,120 --> 01:01:34,000
The two speed data path, event house and lake house.
1168
01:01:34,000 --> 01:01:38,040
Most factory data platforms need two different paths after ingestion because live operations
1169
01:01:38,040 --> 01:01:40,600
and long term analysis ask different questions.
1170
01:01:40,600 --> 01:01:42,040
Event house supports the live path.
1171
01:01:42,040 --> 01:01:46,440
It keeps recent events ready for fast investigation, operational queries and responses that need
1172
01:01:46,440 --> 01:01:48,280
to happen while a shift is still running.
1173
01:01:48,280 --> 01:01:52,720
A fault, a state change or a missing count can enter the event store and become available
1174
01:01:52,720 --> 01:01:54,880
for a new live operational view.
1175
01:01:54,880 --> 01:01:56,560
Lake house supports the longer path.
1176
01:01:56,560 --> 01:02:02,400
It keeps durable history in a form that engineering, data teams, quality teams and planning teams
1177
01:02:02,400 --> 01:02:04,040
can work with over time.
1178
01:02:04,040 --> 01:02:08,320
That includes historical telemetry, production records, maintenance history, material data and
1179
01:02:08,320 --> 01:02:12,240
derived measures that need more involved processing than a live event query.
1180
01:02:12,240 --> 01:02:14,440
The same machine event can belong in both places.
1181
01:02:14,440 --> 01:02:16,280
That isn't wasteful duplication for its own sake.
1182
01:02:16,280 --> 01:02:18,160
It gives each destination a job.
1183
01:02:18,160 --> 01:02:21,240
The event house copy supports the person asking about the last few hours.
1184
01:02:21,240 --> 01:02:25,080
The lake house copy supports someone asking whether a fault pattern changed across several
1185
01:02:25,080 --> 01:02:29,480
product variants after a maintenance action over a season or across sites.
1186
01:02:29,480 --> 01:02:31,440
Those questions don't need the same speed.
1187
01:02:31,440 --> 01:02:34,840
A shift supervisor may need to know that a packaging cell stopped and hasn't returned
1188
01:02:34,840 --> 01:02:35,840
to running.
1189
01:02:35,840 --> 01:02:40,560
A reliability engineer may need to analyze months of vibration trends alongside work orders,
1190
01:02:40,560 --> 01:02:42,880
spare part changes and operating conditions.
1191
01:02:42,880 --> 01:02:46,200
Trying to force both questions through one storage and query pattern usually creates a
1192
01:02:46,200 --> 01:02:48,360
compromise that does neither job well.
1193
01:02:48,360 --> 01:02:49,760
So think of it as a two-speed path.
1194
01:02:49,760 --> 01:02:53,440
The fast path receives event data that supports live operational awareness.
1195
01:02:53,440 --> 01:02:57,760
It stays focused on state changes, alarms, recent condition signals and the data needed for
1196
01:02:57,760 --> 01:02:59,000
quick queries.
1197
01:02:59,000 --> 01:03:03,120
Retention and table design should support the time window people use during operations.
1198
01:03:03,120 --> 01:03:07,320
The slower path receives data for durable history, broader analysis, engineering work, machine
1199
01:03:07,320 --> 01:03:10,200
learning preparation and cross-domain reporting.
1200
01:03:10,200 --> 01:03:14,200
It can absorb transformations that take more time, historical corrections and joins across
1201
01:03:14,200 --> 01:03:16,560
data sets that don't arrive at the same moment.
1202
01:03:16,560 --> 01:03:20,280
That separation also keeps us honest about the word real time.
1203
01:03:20,280 --> 01:03:22,840
Not every production question needs an answer within seconds.
1204
01:03:22,840 --> 01:03:27,640
A daily production review, a capacity analysis or a model training pipeline can run later
1205
01:03:27,640 --> 01:03:29,400
without reducing its usefulness.
1206
01:03:29,400 --> 01:03:33,720
If you push every one of those jobs into a low latency path, you spend more effort and capacity
1207
01:03:33,720 --> 01:03:35,640
without helping the decision.
1208
01:03:35,640 --> 01:03:38,640
Real time should follow the decision, not the technology demo.
1209
01:03:38,640 --> 01:03:41,160
The data design must stay consistent across both paths.
1210
01:03:41,160 --> 01:03:44,800
If an event appears in event house and lake house, both copies need the same stable
1211
01:03:44,800 --> 01:03:48,520
identifiers for the asset, event, source system and source time.
1212
01:03:48,520 --> 01:03:52,760
Without that consistency, the live fault record and the historical fault record become two
1213
01:03:52,760 --> 01:03:55,560
versions of the same event that don't join cleanly later.
1214
01:03:55,560 --> 01:03:57,720
That becomes painful during an investigation.
1215
01:03:57,720 --> 01:04:01,680
A team may identify a stop in the live path, then move to longer term data to see whether
1216
01:04:01,680 --> 01:04:02,680
it repeats.
1217
01:04:02,680 --> 01:04:06,440
If the asset ID changed between destinations or if the timestamps use different rules,
1218
01:04:06,440 --> 01:04:09,880
the team spends time reconciling the pipeline instead of studying the machine.
1219
01:04:09,880 --> 01:04:12,240
Carry the event identity through the whole journey.
1220
01:04:12,240 --> 01:04:14,120
The source timestamp should remain intact.
1221
01:04:14,120 --> 01:04:18,320
The arrival time at the edge, cloud and fabric can remain available where it helps diagnose
1222
01:04:18,320 --> 01:04:19,320
delay.
1223
01:04:19,320 --> 01:04:21,880
The contract version should travel with the record.
1224
01:04:21,880 --> 01:04:25,760
And if the connector generated a sequence number or stable event ID, preserve it.
1225
01:04:25,760 --> 01:04:30,120
These are the details that let you trace one event through both paths without guesswork.
1226
01:04:30,120 --> 01:04:32,280
Storage lifecycle needs an explicit plan too.
1227
01:04:32,280 --> 01:04:35,280
Raw data rarely needs to remain at full resolution forever.
1228
01:04:35,280 --> 01:04:39,280
Some sources produce a high rate of readings that become less useful as they age.
1229
01:04:39,280 --> 01:04:43,640
After a defined period, you may retain daily or hourly summaries while moving the raw records
1230
01:04:43,640 --> 01:04:46,760
to lower cost storage or removing them when policy allows.
1231
01:04:46,760 --> 01:04:48,440
But don't downsample blindly.
1232
01:04:48,440 --> 01:04:52,800
You may safely summarize a routine temperature trend for some use cases.
1233
01:04:52,800 --> 01:04:56,680
You may not safely summarize traceability events, quality records or fault transitions
1234
01:04:56,680 --> 01:04:58,840
where the exact sequence matters.
1235
01:04:58,840 --> 01:05:03,040
Retention depends on operational questions, quality obligations, investigation needs and
1236
01:05:03,040 --> 01:05:05,000
the cost of keeping data available.
1237
01:05:05,000 --> 01:05:09,240
Write those decisions down per event type, which data stays hot for live investigation,
1238
01:05:09,240 --> 01:05:13,240
which data moves into durable historical storage, which events remain at full detail, which
1239
01:05:13,240 --> 01:05:17,480
values can become a 5 minute, hourly or daily aggregate after a set period.
1240
01:05:17,480 --> 01:05:21,000
And when someone challenges a production number, can you still find the source evidence
1241
01:05:21,000 --> 01:05:22,000
behind it?
1242
01:05:22,000 --> 01:05:24,000
That is the purpose of the two speed path.
1243
01:05:24,000 --> 01:05:27,920
Even Tows gives you a place to ask live questions without waiting for a batch process.
1244
01:05:27,920 --> 01:05:31,880
Lake House gives you the history needed to learn, compare and improve over time.
1245
01:05:31,880 --> 01:05:35,520
Yet neither destination knows which order a machine was running, which product variant
1246
01:05:35,520 --> 01:05:38,320
applied, or what a stoppage means for the plan.
1247
01:05:38,320 --> 01:05:42,440
The events have arrived, the production context still sits elsewhere, the context gap inside
1248
01:05:42,440 --> 01:05:44,240
fabric.
1249
01:05:44,240 --> 01:05:47,360
So here's the problem, most manufacturers don't talk about.
1250
01:05:47,360 --> 01:05:51,480
Once telemetry reaches fabric, it knows a few things with confidence, a value when the
1251
01:05:51,480 --> 01:05:55,800
source reported it which asset or connector sent it, and for fault events, maybe the code
1252
01:05:55,800 --> 01:05:57,400
and machine state around the stop.
1253
01:05:57,400 --> 01:06:01,120
That's useful, but it still leaves the production team with unanswered questions.
1254
01:06:01,120 --> 01:06:06,440
Picture this, a fault event from the packaging cell lands in Event House at 10 past 11,
1255
01:06:06,440 --> 01:06:10,480
the machines in a faulted state, the good part count stopped, and the source reports a label
1256
01:06:10,480 --> 01:06:11,480
feed alarm.
1257
01:06:11,480 --> 01:06:15,240
Fabric stores all of that cleanly, but none of those facts tell you which operation the machine
1258
01:06:15,240 --> 01:06:19,400
was performing, which work order it interrupted, or whether the delay puts a customer delivery
1259
01:06:19,400 --> 01:06:20,400
at risk.
1260
01:06:20,400 --> 01:06:22,920
The machine event describes an asset condition.
1261
01:06:22,920 --> 01:06:25,280
Production meets to understand a production consequence.
1262
01:06:25,280 --> 01:06:30,440
Now that event context usually lives in the manufacturing execution system, the MES.
1263
01:06:30,440 --> 01:06:35,560
The MES knows what work is executing on the shop floor, the active operation, work order,
1264
01:06:35,560 --> 01:06:41,280
production status, operator activity, quantities reported, and the timing of production events.
1265
01:06:41,280 --> 01:06:44,640
It gives the machine event a place in the execution story.
1266
01:06:44,640 --> 01:06:50,040
If the MES records that packaging cell for began operation 30, on work order 4827 at
1267
01:06:50,040 --> 01:06:54,280
10 o'clock, a fault at 10 past 11 becomes more than an isolated machine problem.
1268
01:06:54,280 --> 01:06:59,200
It may now link to a specific operation, product, quantity, target, and execution state.
1269
01:06:59,200 --> 01:07:01,160
Even then you need to handle time carefully.
1270
01:07:01,160 --> 01:07:05,680
The MES might receive confirmation events after the physical machine event, an operator reports
1271
01:07:05,680 --> 01:07:09,800
a change over late, or a work order appears active while the machine is actually being cleaned
1272
01:07:09,800 --> 01:07:10,800
or waiting for material.
1273
01:07:10,800 --> 01:07:12,880
That's not a reason to ignore mess data.
1274
01:07:12,880 --> 01:07:15,760
It's a reason to treat the timing and authority of each fact with care.
1275
01:07:15,760 --> 01:07:19,760
The MES tells you what production intended and recorded at the execution layer.
1276
01:07:19,760 --> 01:07:21,840
The machine tells you what the asset reported.
1277
01:07:21,840 --> 01:07:26,040
A good model keeps both pieces of evidence rather than forcing one to overwrite the other.
1278
01:07:26,040 --> 01:07:27,960
Then there's the ERP system.
1279
01:07:27,960 --> 01:07:30,920
Enterprise resource planning holds the planning and commercial side.
1280
01:07:30,920 --> 01:07:35,440
Command, planned orders, rootings, due dates, material commitments, and often the broader
1281
01:07:35,440 --> 01:07:38,240
supply picture around the work order.
1282
01:07:38,240 --> 01:07:40,160
That context changes the question entirely.
1283
01:07:40,160 --> 01:07:45,680
A machine stop, during a low priority internal replenishment order, is one kind of problem.
1284
01:07:45,680 --> 01:07:50,400
The same stop during a late customer order, where the next operation depends on that output,
1285
01:07:50,400 --> 01:07:54,240
and a material substitution needs approval, creates something completely different.
1286
01:07:54,240 --> 01:07:58,160
Fabric can bring the ERP data close to the event data, but it doesn't become the owner
1287
01:07:58,160 --> 01:08:00,960
of the ERP facts just because it copied them into one lake.
1288
01:08:00,960 --> 01:08:05,680
The ERP stays the authority for the plan, demand, and formal order commitments.
1289
01:08:05,680 --> 01:08:10,040
Fabric provides a place to combine those facts with telemetry for analysis and decision support.
1290
01:08:10,040 --> 01:08:15,280
Maintenance adds another layer, a computerized maintenance management system, CMS, or an enterprise
1291
01:08:15,280 --> 01:08:20,600
asset management system carries information neither the MES nor ERP normally own.
1292
01:08:20,600 --> 01:08:25,680
Asset structure, maintenance plans, known failure modes, prior work orders, service history,
1293
01:08:25,680 --> 01:08:28,600
and the approved response procedure for an alarm class.
1294
01:08:28,600 --> 01:08:32,600
So when the label feed fault arrives, maintenance needs more than a chart of fault codes.
1295
01:08:32,600 --> 01:08:36,760
They need to know whether the feeder has shown the same pattern recently, whether a preventive
1296
01:08:36,760 --> 01:08:41,600
task is overdue, whether the alarm relates to a known component, and whether a technician
1297
01:08:41,600 --> 01:08:47,360
needs a permit, spare part, or machine safe isolation procedure before touching it.
1298
01:08:47,360 --> 01:08:49,080
The event starts the conversation.
1299
01:08:49,080 --> 01:08:52,320
The maintenance system provides the maintenance context.
1300
01:08:52,320 --> 01:08:55,040
Now this is where many fabric designs run into trouble.
1301
01:08:55,040 --> 01:08:58,280
The data team can often connect the sources and join them by time.
1302
01:08:58,280 --> 01:09:03,280
The fault at 10 past 11, the MES operation record overlapping that time, the ERP work order
1303
01:09:03,280 --> 01:09:04,680
linked to that operation.
1304
01:09:04,680 --> 01:09:06,320
So the model creates a connection.
1305
01:09:06,320 --> 01:09:07,720
It may even look convincing.
1306
01:09:07,720 --> 01:09:10,560
But time overlap is not proof of a business relationship.
1307
01:09:10,560 --> 01:09:13,320
A machine might report a delayed event after reconnecting.
1308
01:09:13,320 --> 01:09:16,360
The MES might close one order and open another around the same time.
1309
01:09:16,360 --> 01:09:20,360
A cell could process rework, samples, or test units that don't follow the normal order
1310
01:09:20,360 --> 01:09:21,360
flow.
1311
01:09:21,360 --> 01:09:24,960
A clean looking join can still connect the wrong fault to the wrong order.
1312
01:09:24,960 --> 01:09:28,600
That's why the event needs stable identifiers wherever the source can provide them.
1313
01:09:28,600 --> 01:09:33,080
And why the context model needs explicit rules for how machine events relate to execution
1314
01:09:33,080 --> 01:09:34,080
records.
1315
01:09:34,080 --> 01:09:36,080
Sometimes the right answer is a direct identifier.
1316
01:09:36,080 --> 01:09:39,160
Sometimes it's a controlled time window rule with a confidence level.
1317
01:09:39,160 --> 01:09:41,480
And sometimes the data isn't sufficient.
1318
01:09:41,480 --> 01:09:43,040
And the system should say so.
1319
01:09:43,040 --> 01:09:45,520
That's better than quietly inventing certainty.
1320
01:09:45,520 --> 01:09:49,840
The next step is to define the context that turns this event from a machine record into
1321
01:09:49,840 --> 01:09:52,080
an input for a production decision.
1322
01:09:52,080 --> 01:09:55,560
Production context, product process resource.
1323
01:09:55,560 --> 01:09:58,600
Production context starts with four connected things.
1324
01:09:58,600 --> 01:10:03,240
The product, the process, the resource, and the order currently moving through that process.
1325
01:10:03,240 --> 01:10:05,840
The product is more than a material number in ERP.
1326
01:10:05,840 --> 01:10:10,360
It can mean a specific variant batch pack format revision recipe, quality rule, and customer
1327
01:10:10,360 --> 01:10:11,360
requirement.
1328
01:10:11,360 --> 01:10:15,320
A packaging machine may run the same basic product family all day, but one variant needs
1329
01:10:15,320 --> 01:10:18,400
a different label, carton, ceiling temperature, or inspection rule.
1330
01:10:18,400 --> 01:10:20,280
That changes how you read the machine, Deuter.
1331
01:10:20,280 --> 01:10:24,520
A reject count of 10 units means one thing for a low volume regulated batch and something
1332
01:10:24,520 --> 01:10:26,560
else for a high volume standard run.
1333
01:10:26,560 --> 01:10:31,000
A speed of 60 units per minute may be normal for a large pack and poor for a smaller format.
1334
01:10:31,000 --> 01:10:32,280
The number doesn't explain itself.
1335
01:10:32,280 --> 01:10:35,480
The product context tells you what the number should mean at that moment.
1336
01:10:35,480 --> 01:10:36,560
Then you have the process.
1337
01:10:36,560 --> 01:10:40,360
It describes the work required to turn the product into the next valid state.
1338
01:10:40,360 --> 01:10:43,640
In discrete manufacturing, that may be a rooting with defined operations.
1339
01:10:43,640 --> 01:10:48,000
In a batch process, it may be a recipe phase, a process step, or an inspection stage.
1340
01:10:48,000 --> 01:10:51,880
Either way, it tells you what should happen in what sequence and under what conditions.
1341
01:10:51,880 --> 01:10:55,920
For the packaging cell, the process might include feeding the product, applying the label,
1342
01:10:55,920 --> 01:10:59,400
sealing the pack, checking the label, and releasing the finished unit.
1343
01:10:59,400 --> 01:11:04,400
Each step carries its own cycle expectation, setup requirement, quality check, and completion
1344
01:11:04,400 --> 01:11:05,400
rule.
1345
01:11:05,400 --> 01:11:07,320
That detail matters when the machine stops.
1346
01:11:07,320 --> 01:11:10,320
If the fault happens during label application, you may have a packaging issue.
1347
01:11:10,320 --> 01:11:14,280
If it occurs after a sealing step, but before final inspection, you need to understand the
1348
01:11:14,280 --> 01:11:19,400
status of units already in the cell, were they completed, rejected, held for review, or
1349
01:11:19,400 --> 01:11:21,720
still physically inside the machine.
1350
01:11:21,720 --> 01:11:23,920
A simple machine stop does not answer that.
1351
01:11:23,920 --> 01:11:26,480
The process gives the stoppage a place in the work sequence.
1352
01:11:26,480 --> 01:11:28,960
Now at the resource, a resource is not just the machine.
1353
01:11:28,960 --> 01:11:33,720
It includes the tool, fixture, mold, test station, material interface, and sometimes the
1354
01:11:33,720 --> 01:11:35,720
worker skill needed to run or change it.
1355
01:11:35,720 --> 01:11:38,720
A resource can also include a shared constraint.
1356
01:11:38,720 --> 01:11:42,960
One label printer that supports two lines, or one specialist who can approve a product
1357
01:11:42,960 --> 01:11:43,960
change.
1358
01:11:43,960 --> 01:11:47,640
This is where planning becomes more difficult than moving a work order from one machine name
1359
01:11:47,640 --> 01:11:48,640
to another.
1360
01:11:48,640 --> 01:11:50,080
Imagine the packaging machine fails.
1361
01:11:50,080 --> 01:11:53,360
Another machine may appear capable of handling the same product, but does it have the right
1362
01:11:53,360 --> 01:11:54,360
tooling installed?
1363
01:11:54,360 --> 01:11:56,480
Is the correct film available at that cell?
1364
01:11:56,480 --> 01:11:58,120
Can it meet the required inspection rule?
1365
01:11:58,120 --> 01:11:59,720
Is a qualified operator on shift?
1366
01:11:59,720 --> 01:12:03,320
Does moving the work create a conflict with an order already running there?
1367
01:12:03,320 --> 01:12:04,400
Capacity is always conditional.
1368
01:12:04,400 --> 01:12:08,800
A resource may have physical capacity, but not qualified capacity for this product and
1369
01:12:08,800 --> 01:12:10,280
operation at this time.
1370
01:12:10,280 --> 01:12:13,720
That is why a resource model needs to describe capability and constraint.
1371
01:12:13,720 --> 01:12:15,760
It's just an asset ID and a nominal rate.
1372
01:12:15,760 --> 01:12:17,360
The fourth part is the order.
1373
01:12:17,360 --> 01:12:20,360
The order connects the planned work to actual execution.
1374
01:12:20,360 --> 01:12:24,800
It tells you which demand the factory intends to satisfy, how much needs to be produced,
1375
01:12:24,800 --> 01:12:28,280
what has already been reported, what remains, and where the work sits in the production
1376
01:12:28,280 --> 01:12:29,280
flow.
1377
01:12:29,280 --> 01:12:30,520
But orders have two different lives.
1378
01:12:30,520 --> 01:12:33,520
The planned state comes from the scheduling and planning side.
1379
01:12:33,520 --> 01:12:37,240
It may show that an order should run on a given machine during a given period.
1380
01:12:37,240 --> 01:12:39,200
The actual state comes from execution.
1381
01:12:39,200 --> 01:12:43,480
It tells you whether the order really started, whether the operation paused, whether quantities
1382
01:12:43,480 --> 01:12:46,960
were confirmed, and whether someone changed the sequence on the floor.
1383
01:12:46,960 --> 01:12:48,520
Those two views often differ.
1384
01:12:48,520 --> 01:12:49,520
That is normal.
1385
01:12:49,520 --> 01:12:51,720
A plan is an intention under constraints.
1386
01:12:51,720 --> 01:12:56,560
Execution is what happened in the presence of real machines, real materials, and real people.
1387
01:12:56,560 --> 01:12:59,720
The architecture needs both because neither one replaces the other.
1388
01:12:59,720 --> 01:13:01,240
There's another complication.
1389
01:13:01,240 --> 01:13:03,120
These relationships change over time.
1390
01:13:03,120 --> 01:13:06,600
During a change over the same machine may switch from one product variant to another.
1391
01:13:06,600 --> 01:13:07,760
A tool may be removed.
1392
01:13:07,760 --> 01:13:09,600
A worker might move to a different cell.
1393
01:13:09,600 --> 01:13:12,600
A planner could reschedule an order after a fault.
1394
01:13:12,600 --> 01:13:17,000
If your model assumes a machine belongs to one product or one order for an entire shift,
1395
01:13:17,000 --> 01:13:21,200
it will create wrong links at exactly the moments when people need trustworthy answers.
1396
01:13:21,200 --> 01:13:22,960
So the context model needs effective time.
1397
01:13:22,960 --> 01:13:26,840
It needs to capture not just that a resource can run a product, but when that capability
1398
01:13:26,840 --> 01:13:27,840
applied.
1399
01:13:27,840 --> 01:13:31,800
Not just that an order belongs to an operation, but when that operation became active on a
1400
01:13:31,800 --> 01:13:33,200
specific resource.
1401
01:13:33,200 --> 01:13:37,720
Not just that a quality rule exists, but which version applied to the batch being produced.
1402
01:13:37,720 --> 01:13:40,000
This sounds detailed because it is detailed.
1403
01:13:40,000 --> 01:13:41,000
Production changes over time.
1404
01:13:41,000 --> 01:13:45,520
Once you can connect product, process, resource, and order around an event, the fault code becomes
1405
01:13:45,520 --> 01:13:46,520
useful.
1406
01:13:46,520 --> 01:13:50,400
It can point to a stopped machine during a defined operation on a known product variant
1407
01:13:50,400 --> 01:13:55,160
against an active order with a specific set of feasible constraints around recovery.
1408
01:13:55,160 --> 01:13:59,160
That context shouldn't live as a clever calculation hidden inside one dashboard.
1409
01:13:59,160 --> 01:14:04,520
It needs to be placed deliberately in the architecture where contextualization should happen.
1410
01:14:04,520 --> 01:14:08,480
So once you accept that production context changes over time, the real question becomes
1411
01:14:08,480 --> 01:14:11,320
where each part of that context belongs.
1412
01:14:11,320 --> 01:14:13,000
Teams usually try to solve it in one spot.
1413
01:14:13,000 --> 01:14:16,680
They either put everything at the edge or push every join into fabric.
1414
01:14:16,680 --> 01:14:20,800
And both approaches cause problems because context moves at different speeds, has different
1415
01:14:20,800 --> 01:14:23,200
owners, and exists for different reasons.
1416
01:14:23,200 --> 01:14:24,600
Let's start with the edge.
1417
01:14:24,600 --> 01:14:29,400
The edge should enrich an event with facts it already knows locally and needs right away.
1418
01:14:29,400 --> 01:14:33,960
That could be the site ID, the local asset ID, a connector ID, the OPC UA node reference,
1419
01:14:33,960 --> 01:14:37,680
an engineering unit or a machine state mapping the OT team has approved.
1420
01:14:37,680 --> 01:14:40,880
Those facts travel with the event from the very beginning.
1421
01:14:40,880 --> 01:14:43,840
Say a connector picks up a fault state from a packaging machine.
1422
01:14:43,840 --> 01:14:48,200
It can attach the agreed asset ID and tag the signal as a fault state event while keeping
1423
01:14:48,200 --> 01:14:51,360
the original fault code timestamp and quality status.
1424
01:14:51,360 --> 01:14:55,440
That way every downstream consumer gets a consistent minimum record, even if the cloud
1425
01:14:55,440 --> 01:14:56,760
path gets delayed.
1426
01:14:56,760 --> 01:14:59,720
But the edge shouldn't become a shadow ERP or MES.
1427
01:14:59,720 --> 01:15:04,120
It should not carry a copied set of work orders, routing, shift plans and maintenance history
1428
01:15:04,120 --> 01:15:08,360
just because someone wants every event fully decorated before it leaves the site.
1429
01:15:08,360 --> 01:15:12,560
That leads to stay a local reference data, difficult updates and a second source nobody
1430
01:15:12,560 --> 01:15:13,880
formally owns.
1431
01:15:13,880 --> 01:15:17,440
Keep local enrichment close to what the local system can know with confidence.
1432
01:15:17,440 --> 01:15:20,280
The streaming layer can add another level of context.
1433
01:15:20,280 --> 01:15:24,440
This works when you need a current operational lookup and the reference data is small enough,
1434
01:15:24,440 --> 01:15:27,840
stable enough and refreshed well enough for the purpose.
1435
01:15:27,840 --> 01:15:32,800
A practical example might link a machine event to a currently active cell, line or approved
1436
01:15:32,800 --> 01:15:33,800
asset class.
1437
01:15:33,800 --> 01:15:37,920
And attach the current shift based on a govern shift calendar, it may also apply a known
1438
01:15:37,920 --> 01:15:42,520
mapping from a fault code to a common failure category, if maintenance owns that mapping and
1439
01:15:42,520 --> 01:15:43,880
the rule is controlled.
1440
01:15:43,880 --> 01:15:47,560
That can support a live operational question without waiting for a large batch process.
1441
01:15:47,560 --> 01:15:51,080
Still, be careful with live joins that look more certain than they are.
1442
01:15:51,080 --> 01:15:55,080
If a streaming process links an event to an active work order, it needs clear rules for
1443
01:15:55,080 --> 01:15:59,280
late messages, overlapping execution records and order changes during a shift.
1444
01:15:59,280 --> 01:16:03,760
The system should record how it linked the data, not quietly turn a best guess into effect.
1445
01:16:03,760 --> 01:16:07,920
Then you have the lake house or warehouse layer, this is where slower domain joins and historical
1446
01:16:07,920 --> 01:16:08,920
correction belong.
1447
01:16:08,920 --> 01:16:14,040
A machine event can join with MES execution history, ERP order and routing data, maintenance
1448
01:16:14,040 --> 01:16:16,920
records, quality results and material information.
1449
01:16:16,920 --> 01:16:20,640
These joins can take time because they need checks, effective dates and sometimes correction
1450
01:16:20,640 --> 01:16:22,920
when a source system posts a late transaction.
1451
01:16:22,920 --> 01:16:23,920
That's fine.
1452
01:16:23,920 --> 01:16:25,800
Not every answer needs to arrive within seconds.
1453
01:16:25,800 --> 01:16:29,760
Suppose a quality engineer investigates a rise in rejects over several weeks.
1454
01:16:29,760 --> 01:16:33,960
They need the product variant material batch operating state inspection result and maybe
1455
01:16:33,960 --> 01:16:36,920
a maintenance action that happened before the rate changed.
1456
01:16:36,920 --> 01:16:40,320
This is not a job for a thin event payload or a fast stream rule.
1457
01:16:40,320 --> 01:16:44,120
It needs governed historical data and a transparent transformation process.
1458
01:16:44,120 --> 01:16:46,040
The source systems must retain ownership.
1459
01:16:46,040 --> 01:16:51,000
ERP owns the formal order, material and routing facts, MES owns execution facts, engineering
1460
01:16:51,000 --> 01:16:54,040
owns equipment capability and process definitions.
1461
01:16:54,040 --> 01:16:56,600
Maintenance owns asset records and service history.
1462
01:16:56,600 --> 01:17:01,500
It can hold copies for analysis and connect the dots between IT and OT but copying a record
1463
01:17:01,500 --> 01:17:04,680
into fabric does not transfer authority over its meaning.
1464
01:17:04,680 --> 01:17:07,440
That distinction prevents a lot of quiet conflict.
1465
01:17:07,440 --> 01:17:11,680
When an order status differs between a report and the MES, the team needs to know which system
1466
01:17:11,680 --> 01:17:12,680
can correct it.
1467
01:17:12,680 --> 01:17:16,640
When a machine capability changes, engineering needs a controlled way to update it.
1468
01:17:16,640 --> 01:17:21,200
When a failure category changes, maintenance needs to approve the new definition.
1469
01:17:21,200 --> 01:17:23,840
Fabric should carry identifiers in the event payload.
1470
01:17:23,840 --> 01:17:27,680
These identifiers let the platform retrieve or join the governed meaning from the right
1471
01:17:27,680 --> 01:17:28,680
source.
1472
01:17:28,680 --> 01:17:33,480
The payload might include an asset ID, operation ID, work order reference when available, product
1473
01:17:33,480 --> 01:17:35,360
reference and contract version.
1474
01:17:35,360 --> 01:17:38,160
But an identifier is not the full definition.
1475
01:17:38,160 --> 01:17:42,240
It points to the definition, the current or historical version of it and the domain owner
1476
01:17:42,240 --> 01:17:44,280
who can explain or correct it.
1477
01:17:44,280 --> 01:17:48,600
That approach keeps messages compact while avoiding a pile of copied reference data that
1478
01:17:48,600 --> 01:17:49,840
drifts apart over time.
1479
01:17:49,840 --> 01:17:54,520
So place context based on when it is needed, who owns it and how often it changes, put immediate
1480
01:17:54,520 --> 01:17:56,240
local facts at the edge.
1481
01:17:56,240 --> 01:18:00,120
Use streaming enrichment for controlled live lookups, use the lake house or warehouse for
1482
01:18:00,120 --> 01:18:02,240
broader history and domain joins.
1483
01:18:02,240 --> 01:18:04,920
Keep authority with the systems that run the business process.
1484
01:18:04,920 --> 01:18:09,120
Then when relationships become more complex than a few joins can express clearly, you need
1485
01:18:09,120 --> 01:18:13,200
a model that holds those relationships directly.
1486
01:18:13,200 --> 01:18:17,000
Digital Twin and Knowledge Graph, different jobs.
1487
01:18:17,000 --> 01:18:22,120
Once you need to hold changing relationships across assets, orders, processes and rules,
1488
01:18:22,120 --> 01:18:24,440
normal table joins can start to feel fragile.
1489
01:18:24,440 --> 01:18:28,480
They still work for many cases, but A join only answers the relationship you designed for
1490
01:18:28,480 --> 01:18:29,560
at that moment.
1491
01:18:29,560 --> 01:18:33,320
A factory often needs to ask new questions later and those questions cross the boundaries
1492
01:18:33,320 --> 01:18:36,240
between maintenance, production, quality, engineering and planning.
1493
01:18:36,240 --> 01:18:40,200
That's where digital twins and knowledge graphs become useful, but they solve different
1494
01:18:40,200 --> 01:18:41,200
problems.
1495
01:18:41,200 --> 01:18:43,000
A digital twin models a physical environment.
1496
01:18:43,000 --> 01:18:47,440
In manufacturing, that may mean a site contains an area, the area contains a line, the line
1497
01:18:47,440 --> 01:18:50,120
contains cells and each cell contains assets.
1498
01:18:50,120 --> 01:18:53,600
The model can also describe properties and states such as whether a machine supports
1499
01:18:53,600 --> 01:18:57,560
a product family, whether a tool is installed or whether a cell currently reports a blocked
1500
01:18:57,560 --> 01:18:58,560
condition.
1501
01:18:58,560 --> 01:19:02,120
It creates a digital representation of the physical world and its structure.
1502
01:19:02,120 --> 01:19:03,120
Think about a packaging cell.
1503
01:19:03,120 --> 01:19:07,320
A digital twin can describe the packaging machine, the labeler, the inspection unit, the
1504
01:19:07,320 --> 01:19:09,400
conveyor and their place in the line.
1505
01:19:09,400 --> 01:19:13,200
It can record that the labeler connects to the packaging machine that both belong to
1506
01:19:13,200 --> 01:19:16,800
the same cell and that the cell supports a defined set of formats.
1507
01:19:16,800 --> 01:19:19,560
That gives machine events a physical home.
1508
01:19:19,560 --> 01:19:23,540
A fault does not arrive as an isolated record with an asset ID that only means something
1509
01:19:23,540 --> 01:19:24,540
to a few people.
1510
01:19:24,540 --> 01:19:27,520
It connects to a machine inside a cell on a line at a site.
1511
01:19:27,520 --> 01:19:30,560
You can then ask questions at the right level, is this one machine faulted?
1512
01:19:30,560 --> 01:19:31,560
Is the cell constrained?
1513
01:19:31,560 --> 01:19:34,600
Are several assets on the same line reporting a related condition?
1514
01:19:34,600 --> 01:19:37,240
A knowledge graph goes further across the operational domain.
1515
01:19:37,240 --> 01:19:41,160
It holds facts and links between many types of things, not only physical assets.
1516
01:19:41,160 --> 01:19:45,560
A graph can connect a packaging machine to an operation, the operation to a work order,
1517
01:19:45,560 --> 01:19:49,600
the work order to a product variant, the product variant to a quality rule and the quality
1518
01:19:49,600 --> 01:19:51,440
rule to an inspection event.
1519
01:19:51,440 --> 01:19:54,720
The graph focuses on relationships and the meaning of those relationships.
1520
01:19:54,720 --> 01:19:59,240
For example, a machine may be capable of running a product but only with a specific tool.
1521
01:19:59,240 --> 01:20:01,880
That tool may be installed only during certain periods.
1522
01:20:01,880 --> 01:20:04,440
The product may require an inspection step before release.
1523
01:20:04,440 --> 01:20:09,160
A work order may use that product but the order may move to a different cell after a reschedule.
1524
01:20:09,160 --> 01:20:12,960
A graph can represent those links directly with their types and effective dates.
1525
01:20:12,960 --> 01:20:17,200
That matters because production questions rarely stay inside one source system.
1526
01:20:17,200 --> 01:20:21,400
A planner might ask which current orders are exposed if a machine remains unavailable.
1527
01:20:21,400 --> 01:20:25,760
A maintenance engineer might ask which product families depend on an asset with a repeating
1528
01:20:25,760 --> 01:20:26,760
fault.
1529
01:20:26,760 --> 01:20:30,640
A quality lead might ask which released batches passed through a cell during a period of
1530
01:20:30,640 --> 01:20:32,280
unstable process conditions.
1531
01:20:32,280 --> 01:20:33,840
These are relationship questions.
1532
01:20:33,840 --> 01:20:37,760
Neither model appears automatically because you collected a lot of tags.
1533
01:20:37,760 --> 01:20:41,200
Telemetry can tell you a machine name, a node ID, a timestamp and a value.
1534
01:20:41,200 --> 01:20:45,360
It can't reliably infer that a machine supports a certain product that a fixture is required
1535
01:20:45,360 --> 01:20:49,080
for a root step or that a quality rule changed last month.
1536
01:20:49,080 --> 01:20:54,160
Those facts come from engineering, MES, ERP, maintenance and people who understand the process.
1537
01:20:54,160 --> 01:20:55,160
Someone has to model them.
1538
01:20:55,160 --> 01:20:56,520
Someone has to own them.
1539
01:20:56,520 --> 01:21:00,520
Microsoft Fabric includes digital twin builder in preview as one root for modeling and
1540
01:21:00,520 --> 01:21:05,440
ontology, which is a formal model of the things in a physical domain and how they relate.
1541
01:21:05,440 --> 01:21:09,400
It can help teams map source data into a shared model and use those links alongside fabric
1542
01:21:09,400 --> 01:21:11,800
data that does not give you a finished factory model.
1543
01:21:11,800 --> 01:21:14,960
A tool can help store query and work with an ontology.
1544
01:21:14,960 --> 01:21:18,840
It cannot decide what available capacity means in your plant whether a change over counts
1545
01:21:18,840 --> 01:21:23,160
is planned downtime or which machine and tool combination is qualified for a regulated
1546
01:21:23,160 --> 01:21:24,320
product.
1547
01:21:24,320 --> 01:21:25,920
Those decisions remain domain work.
1548
01:21:25,920 --> 01:21:29,040
I'd start much smaller than most architecture diagrams suggest.
1549
01:21:29,040 --> 01:21:30,480
Make one decision path.
1550
01:21:30,480 --> 01:21:34,440
Maybe it is the question of how a machine fault affects the active production operation.
1551
01:21:34,440 --> 01:21:36,480
Then model only what that question needs.
1552
01:21:36,480 --> 01:21:40,040
The asset, the sell, the operation, the order, the product and the rules that determine
1553
01:21:40,040 --> 01:21:42,200
whether another resource can perform the work.
1554
01:21:42,200 --> 01:21:44,280
Make those relationships trustworthy first.
1555
01:21:44,280 --> 01:21:48,640
Once the model supports one real decision and people can correct it when the plant changes,
1556
01:21:48,640 --> 01:21:50,240
you have a foundation worth extending.
1557
01:21:50,240 --> 01:21:54,320
If you start by trying to create a complete digital copy of the enterprise, you'll spend
1558
01:21:54,320 --> 01:21:58,440
a long time naming things while the production team still has no answer when a machine
1559
01:21:58,440 --> 01:21:59,440
stops.
1560
01:21:59,440 --> 01:22:01,920
The model should earn its detail through use.
1561
01:22:01,920 --> 01:22:04,160
That brings us back to the original stoppage.
1562
01:22:04,160 --> 01:22:08,000
We now have the event path and a way to model the relationships around it.
1563
01:22:08,000 --> 01:22:11,280
Next we can reconstruct the stoppage as a production problem rather than just a machine
1564
01:22:11,280 --> 01:22:14,960
alarm, reconstructing the stoppage with context.
1565
01:22:14,960 --> 01:22:17,720
Think back to that packaging machine fault at 10 past 11.
1566
01:22:17,720 --> 01:22:21,080
The event arrives in Event House with a stable asset ID, the label feed fault code, the
1567
01:22:21,080 --> 01:22:24,920
source timestamp, source quality and the original OPC UA reference.
1568
01:22:24,920 --> 01:22:27,680
So now you have a trustworthy statement from the machine.
1569
01:22:27,680 --> 01:22:31,520
This asset entered a faulted condition at that moment and with that you can ask better
1570
01:22:31,520 --> 01:22:32,520
questions.
1571
01:22:32,520 --> 01:22:35,760
The context service or governed data model checks which production operation was active
1572
01:22:35,760 --> 01:22:40,560
on that asset when the event fired, finds the current execution record from the MES
1573
01:22:40,560 --> 01:22:44,360
and links the fault to the work order and product variant the cell was processing.
1574
01:22:44,360 --> 01:22:45,840
That link needs rules.
1575
01:22:45,840 --> 01:22:49,800
If the MES record covers the event time and the execution status supports it, the system
1576
01:22:49,800 --> 01:22:52,520
connects the fault to that operation with confidence.
1577
01:22:52,520 --> 01:22:56,320
But if the machine event arrived late after a network outage or two execution records
1578
01:22:56,320 --> 01:23:00,480
overlap during changeover, the model should keep the link uncertain until someone or another
1579
01:23:00,480 --> 01:23:02,000
source resolves it.
1580
01:23:02,000 --> 01:23:05,800
A system that admits uncertainty is more useful than one that invents precision.
1581
01:23:05,800 --> 01:23:09,560
Assume the active operation is confirmed, the fault now connects to a work order for
1582
01:23:09,560 --> 01:23:14,080
a product that needs a specific label stock, inspection setting and packaging format.
1583
01:23:14,080 --> 01:23:16,200
The machine never reported any of that.
1584
01:23:16,200 --> 01:23:18,080
The wider production model supplied it.
1585
01:23:18,080 --> 01:23:22,720
That changes the conversation from "machine 4 has a label alarm" to "the active packaging
1586
01:23:22,720 --> 01:23:26,760
operation for this order has stopped" and the next process cannot receive finished packs
1587
01:23:26,760 --> 01:23:28,640
from this cell.
1588
01:23:28,640 --> 01:23:30,600
Maintenance needs its own branch of context.
1589
01:23:30,600 --> 01:23:35,240
The fault code can link to the asset record in the CMS or EAM system which may show prior
1590
01:23:35,240 --> 01:23:40,120
incidents, the last service activity, known fault causes, spare parts and the approved procedure
1591
01:23:40,120 --> 01:23:42,760
for working safely on that part of the machine.
1592
01:23:42,760 --> 01:23:44,320
Notice what the system is doing here.
1593
01:23:44,320 --> 01:23:46,440
It isn't diagnosing the machine from a dashboard.
1594
01:23:46,440 --> 01:23:50,360
It's bringing the technician the evidence that belongs with the fault, including the source
1595
01:23:50,360 --> 01:23:54,640
event, the asset history and the response procedure that maintenance owns.
1596
01:23:54,640 --> 01:23:59,280
A repeated label feed code after a recent component replacement might point to a setup issue,
1597
01:23:59,280 --> 01:24:04,080
a material issue or a faulty replacement part, the data can narrow the search, but a qualified
1598
01:24:04,080 --> 01:24:07,640
technician still decides what to inspect and what work is safe.
1599
01:24:07,640 --> 01:24:08,920
Planning follows a different path.
1600
01:24:08,920 --> 01:24:13,400
The production event can now expose the affected operation, remaining quantity, due date
1601
01:24:13,400 --> 01:24:17,680
and downstream dependency, so a plan I can ask whether the order can move to another
1602
01:24:17,680 --> 01:24:20,920
resource without creating a larger problem somewhere else.
1603
01:24:20,920 --> 01:24:24,280
At first, that sounds like a simple machine substitution, but it rarely is.
1604
01:24:24,280 --> 01:24:27,640
The alternate machine may support the product family but not the exact packaging format,
1605
01:24:27,640 --> 01:24:29,760
or it may need a tool already in use.
1606
01:24:29,760 --> 01:24:34,240
The right label stock may still sit at the original cell, a skilled operator may not be available,
1607
01:24:34,240 --> 01:24:37,840
and moving the order could delay another order with an earlier customer commitment.
1608
01:24:37,840 --> 01:24:41,320
This is a feasibility problem and fabric can bring together the facts needed to frame
1609
01:24:41,320 --> 01:24:42,320
it.
1610
01:24:42,320 --> 01:24:46,920
Current asset status, order state, resource capability, tooling, material and time.
1611
01:24:46,920 --> 01:24:51,440
A specialized advanced planning and scheduling system, often called APS or an optimization
1612
01:24:51,440 --> 01:24:56,160
engine, can then evaluate feasible reschedule options against the full set of constraints.
1613
01:24:56,160 --> 01:24:57,320
Keep that split clear.
1614
01:24:57,320 --> 01:25:00,840
A data platform can tell the planner which work is exposed and what constraints appear
1615
01:25:00,840 --> 01:25:04,760
relevant, support scenario inputs and record the outcome.
1616
01:25:04,760 --> 01:25:08,800
But it doesn't automatically become a scheduling engine just because it can query the data
1617
01:25:08,800 --> 01:25:10,120
quickly.
1618
01:25:10,120 --> 01:25:12,720
For some plans, the next action may be simple.
1619
01:25:12,720 --> 01:25:17,400
Control the operation, call maintenance and notify the supervisor because no alternate resource
1620
01:25:17,400 --> 01:25:18,400
exists.
1621
01:25:18,400 --> 01:25:21,240
For others, the system may identify two candidate cells.
1622
01:25:21,240 --> 01:25:25,720
One can run the product after a short change over and the other has immediate physical capacity
1623
01:25:25,720 --> 01:25:28,000
but lacks the required inspection setup.
1624
01:25:28,000 --> 01:25:31,960
The planner can compare those options with the actual production rules in view rather
1625
01:25:31,960 --> 01:25:34,400
than calling around the plant with partial information.
1626
01:25:34,400 --> 01:25:35,920
That is decision support.
1627
01:25:35,920 --> 01:25:40,280
It doesn't mean an automated reschedule should release work to the shop floor without approval.
1628
01:25:40,280 --> 01:25:45,160
The cost of a wrong recommendation can include material loss, missed quality controls, overloaded
1629
01:25:45,160 --> 01:25:49,400
resources and a plan that looks clever and software but fails when it meets the physical
1630
01:25:49,400 --> 01:25:50,400
line.
1631
01:25:50,400 --> 01:25:53,000
The event also creates a shared timeline.
1632
01:25:53,000 --> 01:25:56,720
Production sees the interrupted operation, maintenance sees the fault in approved response
1633
01:25:56,720 --> 01:26:00,160
and planning sees the order exposure and resource constraints.
1634
01:26:00,160 --> 01:26:03,680
Each team still owns its part but they now work from linked evidence instead of separate
1635
01:26:03,680 --> 01:26:05,200
timestamps and phone calls.
1636
01:26:05,200 --> 01:26:07,440
That is the practical value of production context.
1637
01:26:07,440 --> 01:26:11,360
A fault code alone tells you that a machine needs attention but a fault code connected to
1638
01:26:11,360 --> 01:26:16,240
the operation, order, product, resource constraints and maintenance history tells each person what
1639
01:26:16,240 --> 01:26:18,360
they need to consider next.
1640
01:26:18,360 --> 01:26:22,640
And that same discipline matters when teams calculate OEE because counters and machine
1641
01:26:22,640 --> 01:26:26,040
states can look objective while hiding a lot of unagreed business rules.
1642
01:26:26,040 --> 01:26:29,560
OEE needs rules not just counters.
1643
01:26:29,560 --> 01:26:35,640
Overall equipment, effectiveness or OEE looks simple when you write the formula down.
1644
01:26:35,640 --> 01:26:39,000
The probability times performance times quality.
1645
01:26:39,000 --> 01:26:42,760
The trouble starts when a team assumes the machine can calculate all three on its own
1646
01:26:42,760 --> 01:26:48,120
because a counter, a state tag and a speed signal only provide evidence, not the agreed production
1647
01:26:48,120 --> 01:26:51,720
rules that turn that evidence into an OEE result.
1648
01:26:51,720 --> 01:26:55,440
Take availability first, a machine can report that it stopped at a given time but that doesn't
1649
01:26:55,440 --> 01:26:59,840
tell you whether the stop counted as planned downtime, an unplanned equipment loss, a scheduled
1650
01:26:59,840 --> 01:27:04,160
cleaning activity, a material shortage, a quality hold or a deliberate production pause
1651
01:27:04,160 --> 01:27:06,560
because the next order wasn't ready.
1652
01:27:06,560 --> 01:27:08,480
Those categories change the calculation.
1653
01:27:08,480 --> 01:27:12,400
Imagine the packaging cell stops while an operator performs an approved format change.
1654
01:27:12,400 --> 01:27:16,680
The machine sees zero speed and no good parts so if the OEE logic treats every zero speed
1655
01:27:16,680 --> 01:27:20,960
period as unplanned downtime, the availability number drops even though the plant expected
1656
01:27:20,960 --> 01:27:22,640
and planned the work.
1657
01:27:22,640 --> 01:27:26,640
On the other hand, if someone labels every stop as change over after the fact, the number
1658
01:27:26,640 --> 01:27:30,720
can look better without production getting better, which is why downtime categories need
1659
01:27:30,720 --> 01:27:34,960
ownership, definitions and a controlled way to correct them.
1660
01:27:34,960 --> 01:27:38,160
The machine state helps establish when the asset could not run.
1661
01:27:38,160 --> 01:27:42,840
The MES can add execution state and plant activity, operator input may explain a material
1662
01:27:42,840 --> 01:27:48,040
issue, a safety intervention or an unusual condition that neither system can infer reliably
1663
01:27:48,040 --> 01:27:53,400
and maintenance records can confirm whether a stop became a failure event and what work followed.
1664
01:27:53,400 --> 01:27:56,840
Each source brings different evidence and none owns the whole answer.
1665
01:27:56,840 --> 01:28:01,160
Performance has a similar problem, a controller may report a current speed or a part count,
1666
01:28:01,160 --> 01:28:03,680
so you can calculate and observe rate from that data.
1667
01:28:03,680 --> 01:28:08,160
But OEE performance compares actual output with an expected rate and that expected rate
1668
01:28:08,160 --> 01:28:11,360
must relate to the product and operation running at that time.
1669
01:28:11,360 --> 01:28:15,440
There isn't one correct rate for a machine across every job, a small pack may move through
1670
01:28:15,440 --> 01:28:17,800
the packaging cell faster than a large format.
1671
01:28:17,800 --> 01:28:22,200
A regulated product may require extra inspection, a start-up period after change over may have
1672
01:28:22,200 --> 01:28:26,120
a different approved expectation from steady production and even the same product can
1673
01:28:26,120 --> 01:28:30,640
require a different target after an engineering change or a new packaging material.
1674
01:28:30,640 --> 01:28:35,120
So the ideal cycle time needs a govern source, whether from the MES master data, an engineering
1675
01:28:35,120 --> 01:28:38,720
standard or a process specification, the source matters less than the discipline.
1676
01:28:38,720 --> 01:28:42,680
The rule must identify which cycle expectation applied to this product on this operation
1677
01:28:42,680 --> 01:28:47,000
during this period, otherwise you aren't measuring performance, you're comparing the factory
1678
01:28:47,000 --> 01:28:50,520
to a number someone chose because it looked plausible in a report.
1679
01:28:50,520 --> 01:28:51,760
Quality needs the same care.
1680
01:28:51,760 --> 01:28:55,440
A reject count tells you that the machine diverted units, but it may not tell you whether
1681
01:28:55,440 --> 01:28:57,960
those units count against finished goods quality.




