

The Shadow Data Blindspot: Mapping What You Can’t See with Purview


In this episode of the M365 FM Podcast, we explore one of the biggest hidden risks in modern data governance: shadow data. While Microsoft Purview provides powerful visibility into governed data sources, many organizations assume that what Purview cannot see does not exist. That assumption creates a dangerous blind spot.
The discussion explains how shadow data emerges across disconnected systems, unmanaged repositories, legacy platforms, third-party applications, personal storage locations, and forgotten workloads that sit outside normal governance processes. These hidden data stores often contain sensitive business information, intellectual property, customer records, and compliance-relevant content that never appears in standard Purview reporting.
The episode breaks down why organizations frequently mistake data discovery for complete data visibility. Even with strong classification, labeling, and compliance controls in Microsoft 365, governance can only protect what it can actually find. When data exists outside mapped and monitored environments, security teams lose visibility, compliance teams lose assurance, and AI systems such as Copilot operate with incomplete context.
Listeners learn practical strategies for identifying hidden data estates, understanding the limitations of automated discovery, and building a more comprehensive data inventory. The conversation highlights the importance of continuous data mapping, governance ownership, lifecycle management, and cross-platform visibility rather than relying solely on technology to solve governance challenges.


You face a shadow data blindspot when hidden information escapes formal oversight. This blindspot threatens privacy, security, and compliance. Many organizations struggle with it. For example, 56% use AI without formal approval, which causes data exposure, lack of accountability, and higher breach costs. Only 32% have policies to manage AI use. Microsoft Purview stands out because it uses continuous discovery and real-time data mapping. You gain visibility across structured and unstructured data, hybrid, and multi-cloud environments. Microsoft Purview integrates seamlessly with Azure and Office 365 to protect privacy. The table below shows how Microsoft Purview compares to other solutions:
| Feature | Microsoft Purview | Other Solutions |
|---|---|---|
| Continuous Discovery | Yes | Varies |
| Real-Time Data Mapping | Yes | Varies |
| Support for Structured/Unstructured Data | Yes | Limited |
| Hybrid and Multi-Cloud Support | Yes | Limited |
| Integration with Microsoft Ecosystem | Seamless integration with Azure, Office 365, etc. | Varies |
Microsoft Purview helps you uncover shadow data blindspot and improve privacy. You get actionable steps and practical examples to address shadow data blindspot with Microsoft Purview.
Key Takeaways
- Shadow data blindspots pose serious risks to privacy, security, and compliance. Organizations must recognize and address these hidden data issues.
- Microsoft Purview offers continuous discovery and real-time data mapping, giving organizations visibility into both structured and unstructured data.
- Understanding common sources of shadow data, such as unsanctioned apps and personal devices, is crucial for reducing risks.
- Implementing real-time monitoring with Microsoft Purview helps detect policy violations and unauthorized access as they happen.
- A living inventory approach ensures organizations always know where their data resides and how it changes, supporting effective governance.
- Engaging stakeholders across various roles is essential for successful shadow data management and compliance.
- Regularly reviewing and updating data governance policies helps organizations stay ahead of new risks and maintain compliance.
- Using Microsoft Purview's sensitive data classification tools allows organizations to identify and protect sensitive information effectively.
Shadow Data Blindspot Explained
What Is Shadow Data?
You may hear the term "shadow data" in conversations about data security. Shadow data refers to unmanaged and unmonitored information that sits outside your organization’s IT governance and security protocols. This data often hides on personal devices, unauthorized cloud storage, or in unsanctioned applications. Because IT does not control or monitor this information, it creates a significant risk for your organization. Shadow data can include anything from sensitive customer details to confidential business plans. When you do not know where your data lives, you cannot protect it.
Note: Shadow data is not just a technical issue. It is a business risk that can lead to data leaks, compliance failures, and lost trust.
Why Blindspots Occur
You may wonder why shadow data blindspots happen so often. Several common reasons exist:
- Employees want faster solutions. When you face tight deadlines, you might bypass IT and use tools that help you work quicker. This behavior creates shadow IT.
- Sometimes, IT-provided solutions do not meet your needs. You may look for alternative tools, which can open up security gaps.
- Cloud-based services are easy to access. You can deploy new apps without IT involvement. If these tools do not meet security standards, they introduce vulnerabilities.
These factors make it easy for shadow data to grow unnoticed. You may not realize how much information escapes formal oversight until a problem occurs.
Common Sources
Shadow data can come from many places in your daily work. Here are some of the most frequent sources:
- Unsanctioned SaaS and shadow AI tools: You might use apps or AI services without IT approval. These tools store data in unauthorized cloud services.
- Test or development databases: When you create test environments, you often generate extra copies of data. If you do not secure these, they become shadow data.
- Personal devices and mobile or cloud sync leaks: Syncing work data to your phone or laptop creates untracked copies. These devices may lack proper security controls.
- Forgotten artifacts, archives, and legacy apps: Old logs, abandoned cloud storage, and unused applications can hold sensitive information. If you forget about them, they become hidden risks.
You need to stay aware of these sources to reduce your shadow data blindspot. By understanding where shadow data hides, you take the first step toward better data security and compliance.
Data Security Risks of Shadow Data
Vulnerabilities and Exposure
You face serious threats when shadow data escapes your control. Shadow data often hides in places where your IT team cannot see or manage it. This lack of visibility creates a weak data security posture. You may not know who has access to sensitive files or where confidential information lives. This situation increases the risk of unauthorized access and data loss prevention failures.
Here is a table that shows the most common threats linked to shadow data:
| Risk Type | Description |
|---|---|
| Unauthorized Access | Employees accessing and managing data outside approved systems, leading to potential breaches. |
| Compliance Violations | Use of unapproved tools may lead to violations of data protection regulations. |
| Lack of Visibility | Difficulty in tracking and managing data stored outside official channels. |
| Potential Data Breaches | Increased risk of data theft or loss due to unregulated data storage practices. |
Shadow data increases your exposure to threats in several ways:
- Companies often fail to protect their AI tools, which can lead to more extensive data breaches.
- Shadow IT makes it easy for teams to use applications that IT cannot monitor, causing unauthorized data accumulation.
- The presence of shadow data expands the scope and impact of a breach, making data loss prevention much harder.
You also face insider threats when employees use personal devices or unsanctioned apps. These actions bypass your official security controls. Insider threats can lead to accidental or intentional data leaks. You need strong data security measures to reduce these risks and protect your organization from threats.
Impact on AI and Operations
Shadow data does not only threaten your data security. It also affects your AI projects and daily operations. When you use shadow AI tools or feed unapproved data into your models, you introduce new threats. Shadow AI can cause undetected errors and biased outputs. These mistakes can harm your decision-making and lower your operational efficiency.
In regulated industries, the risk grows even higher. Inaccurate AI outputs can lead to compliance violations and operational setbacks. You need effective data loss prevention strategies to ensure that only approved data enters your AI systems. This approach helps you avoid threats that come from poor data quality and lack of oversight.
You must also consider insider threats in your AI workflows. Employees may use shadow data without realizing the risk. This behavior can introduce threats that compromise your data security posture. By focusing on data risk management and data loss prevention, you strengthen your defenses against threats from both inside and outside your organization.
Tip: Regularly review your data security policies and monitor for shadow data. This practice helps you spot threats early and maintain a strong data security posture.
Compliance and Governance Challenges
Regulatory Risks
You face strict compliance requirements in many industries. Regulatory bodies demand that you protect sensitive information and follow clear governance rules. When you let shadow data grow, you risk breaking these rules. Unmanaged data often escapes your compliance checks. This situation can lead to fines, legal actions, and operational disruptions.
You must understand that regulatory compliance is not just about following rules. It is about building trust with customers and partners.
The table below shows how unmanaged shadow data can create regulatory risks:
| Evidence Description | Regulatory Frameworks | Consequences |
|---|---|---|
| Unmanaged shadow data can lead to fines and legal consequences due to non-compliance. | GDPR, CCPA | Fines, legal actions |
| Shadow data often contains sensitive information, risking non-compliance during audits. | GDPR, CCPA | Fines, legal actions, operational disruptions |
You need to keep your compliance posture strong. If you miss hidden data during audits, you may face penalties. Regulatory agencies expect you to know where your data lives and how you protect it. You must meet compliance requirements to avoid costly mistakes.
Gaps in Traditional Governance
Traditional governance frameworks often fail to address shadow data blindspots. You may rely on static inventories and periodic audits, but these methods cannot keep up with the rapid pace of data creation. Employees use AI tools and unsanctioned apps every week. Many share sensitive information without approval.
The chart below shows how employees use AI tools and share data outside formal governance:
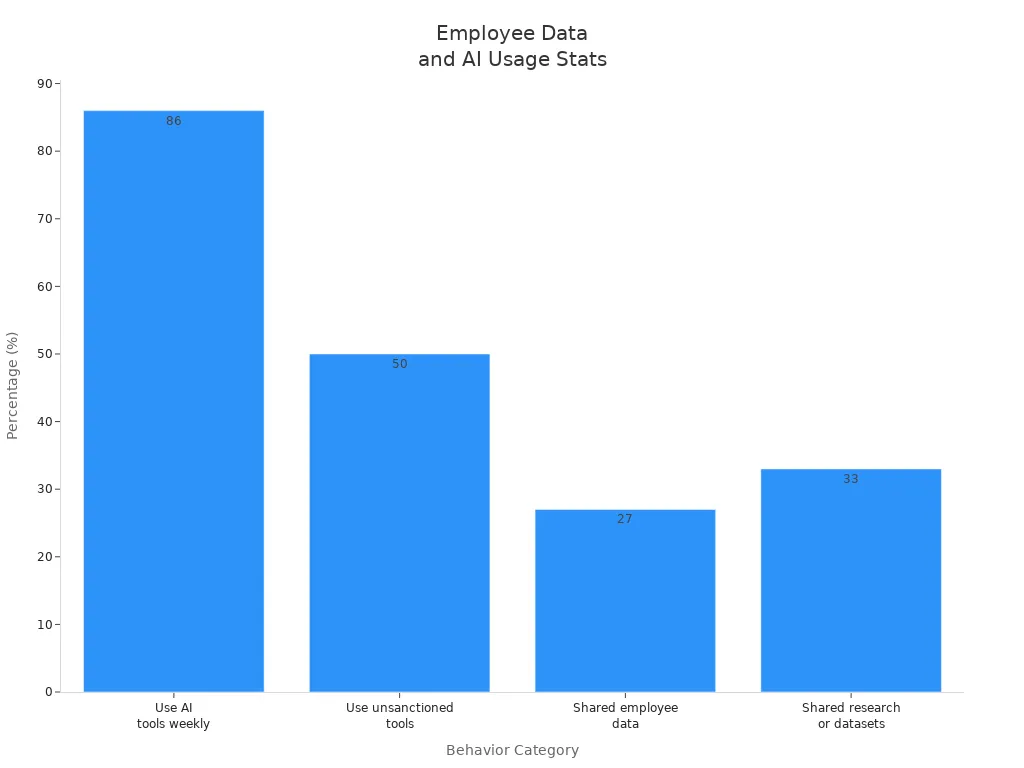
You see that 86% of employees use AI tools weekly. Nearly half use unsanctioned tools. Many share employee data and research datasets. These actions create blind spots in your governance and compliance efforts.
| Statistic | Description |
|---|---|
| 86% | Percentage of employees using AI tools weekly |
| 50% | Nearly half of employees use unsanctioned tools |
| 27% | Employees who have shared employee data |
| 33% | Employees who have shared research or datasets |
You must recognize that traditional governance cannot track every new tool or platform. Employees often use personal devices and external services. These platforms operate outside your compliance controls. You need a modern governance approach that adapts to new risks and keeps your compliance posture strong.
Tip: You should review your governance strategy often. Look for gaps where shadow data may hide. Update your compliance processes to match the changing regulatory landscape.
You build a better security posture when you close these gaps. You protect sensitive information and meet compliance requirements. You also prepare your organization for future regulatory changes.
Microsoft Purview for Shadow Data
Continuous Discovery
You need continuous discovery to protect your organization from shadow data risks. Microsoft Purview uses Unified Data Security Posture Management to deliver automated and ongoing discovery of sensitive information. This approach helps you keep up with the rapid growth of data across cloud platforms. You do not have to rely on outdated inventories or manual checks. Instead, you gain real-time visibility into your data landscape.
With continuous discovery, you can:
- Uncover hidden sensitive data in cloud, on-premises, and SaaS environments.
- Map data flows and track where sensitive business data moves.
- Identify sensitive information saved outside authorized systems.
Microsoft Purview enables you to maintain control over sensitive data, even as your environment becomes more complex. You can spot shadow data before it becomes a threat. This proactive stance supports your data protection strategy and strengthens your overall protection posture.
Tip: Continuous discovery helps you stay ahead of threats. You can address risks before they impact your sensitive data handling processes.
| Feature | Description |
|---|---|
| Data Map | Covers multi-cloud data discovery and lineage, including various platforms like AWS and Google Cloud. |
| Catalog | Provides data-asset discovery and metadata enrichment, enhancing visibility of data assets. |
You can see that Microsoft Purview’s continuous discovery tools give you the foundation for strong data protection. You do not miss sensitive data, even when it hides in unexpected places.
Data Map and Data Explorer
You need a clear view of your data to manage protection and compliance. Microsoft Purview’s Data Map and Data Explorer give you this visibility. The Data Map scans your entire data estate, including structured and unstructured sources. It covers multi-cloud environments, such as AWS and Google Cloud, not just Microsoft platforms. You can track data lineage, which means you know where sensitive data comes from and where it goes.
The Data Explorer lets you search, filter, and analyze your data assets. You can find sensitive business data quickly. You can also see how sensitive information moves across your organization. This helps you enforce data protection measures and stop unauthorized sharing.
- You can limit access to sensitive datasets to approved business roles.
- You can block external sharing for confidential files.
- You can apply retention rules to records that must be kept for legal reasons.
- You can flag prohibited movement of regulated data to unmanaged locations.
Microsoft Purview’s Data Map and Data Explorer help you bring shadow data under control. You can manage sensitive data handling with confidence. You also support compliance with regulations like GDPR and CCPA. Built-in templates and automated reporting make it easier to prove your data protection standards during audits.
Note: Data Map and Data Explorer promote data accuracy, consistency, and trustworthiness. You build a strong foundation for protection and compliance.
Sensitive Data Classification
You must classify sensitive data to protect it. Microsoft Purview uses advanced methods to identify and label sensitive information. You can use pattern-based detectors for structured data, such as credit card numbers and tax identifiers. Trainable classifiers help you recognize documents that fit a category, even if they do not follow a fixed pattern. Exact Data Match lets you match information against an approved dataset, which reduces false positives. Document fingerprinting finds copies or near-copies of known documents, which is important for protecting intellectual property.
- Sensitive Information Types: Detects patterns in structured and semi-structured data.
- Trainable Classifiers: Learns from examples to spot sensitive documents.
- Exact Data Match: Matches data to approved lists for accurate protection.
- Document Fingerprinting: Identifies duplicates to protect sensitive business data.
You can use these tools to identify sensitive data across your organization. You can then apply the right protection policies. This approach helps you meet data protection requirements and avoid data breaches. You also support sensitive data handling best practices.
Microsoft Purview’s sensitive data classification supports compliance with major regulations. You can track data location, respond to data subject requests, and show proof of protection during audits. You reduce the risk of unauthorized access and improve your overall protection strategy.
Callout: Accurate classification is the first step in strong data protection. You cannot protect what you cannot identify.
You can see that Microsoft Purview gives you the tools to discover, map, and classify sensitive data. You gain control over shadow data and strengthen your protection efforts. You also build trust with customers and partners by following high data protection standards.
Monitoring and Managing Shadow Data
Real-Time Monitoring
You need real-time monitoring to keep your data secure and compliant. Microsoft Purview gives you the tools to set up continuous monitoring across your entire data estate. Start by enabling real-time monitoring to detect policy violations, such as oversharing or unauthorized access. This approach allows you to spot risks as they happen, not after the fact. You can use data security posture management (DSPM) to focus on detection of shadow AI tools that may introduce new risks. DSPM supports monitoring by scanning for unapproved or unmanaged AI applications.
Follow these steps to set up real-time monitoring with Microsoft Purview:
- Enable continuous monitoring for all data sources, including cloud and on-premises environments.
- Configure detection rules to identify risky behaviors, such as attempts to move confidential data to unsanctioned locations.
- Set up automated alerts for monitoring so you receive notifications when a policy violation or suspicious activity occurs.
- Review recommendations provided by Purview to respond quickly and remediate issues before they escalate.
- Test your monitoring setup by simulating common shadow data scenarios, such as pasting sensitive information into an unapproved AI chatbot.
For example, if a user tries to share confidential files with an external party, Purview’s monitoring and detection features can block the action and alert your security team in real-time. This level of monitoring helps you maintain control and supports compliance efforts.
Information Barriers
You can use information barriers in Microsoft Purview to strengthen your monitoring strategy. These barriers restrict communication between users or groups, which is essential for organizations that need to protect sensitive information. By establishing internal boundaries, you prevent unauthorized interactions before they occur. This proactive monitoring approach helps you comply with regulations and avoid accidental data leaks.
Information barriers play a key role in monitoring by ensuring that teams with conflicting interests cannot share sensitive data. For example, you can separate research and sales teams to prevent insider trading or unintentional exposure of confidential information. Monitoring these boundaries helps you maintain confidentiality and trust within your organization.
Policy Enforcement
Policy enforcement is critical for effective monitoring and detection of shadow data. Microsoft Purview offers granular data loss prevention (DLP) policies for emails, files, and databases. You can set adaptive controls that adjust based on user context and threat signals. DLP connects to classification labels, so monitoring and detection of sensitive data automatically trigger the right policies.
You benefit from incident response automation, which integrates with Microsoft Defender or Sentinel. This integration allows for quick triage of DLP incidents detected during monitoring. Regular monitoring and testing of DLP policies ensure they remain effective and audit-ready. For example, if monitoring detects a user trying to export sensitive data, Purview can block the action and log the incident for review.
Tip: Consistent monitoring, detection, and enforcement help you stay ahead of threats and keep your data secure.
Building a Proactive Data Governance Strategy
Living Inventory Approach
You need a living inventory to manage your data effectively. A living inventory means you always know where your data lives and how it changes. Microsoft Purview helps you build this approach by scanning your data sources all the time. You do not have to guess where sensitive information hides. You see updates in real time. This method supports strong data governance and risk management.
You start by setting clear goals for your data governance program. Define what success looks like for your organization. Register your most important data sources in Microsoft Purview. Set up scans to keep your inventory fresh. Enrich your data with glossary terms and metadata. Work with business teams to check data ownership and lineage. This process helps you close gaps in risk management and keeps your data map up to date.
Tip: A living inventory gives you the power to spot risks early and respond quickly.
Integrating Purview with Workflows
You can make data governance part of your daily work by connecting Microsoft Purview to your existing tools. Purview works with Microsoft 365 apps like Teams, SharePoint, and OneDrive. You get better search and discovery across these platforms. This helps you find and manage shadow data before it becomes a problem for risk management.
- Microsoft Purview gives you a single place to manage data governance and security.
- You see how data moves between apps, which helps you understand data flows and dependencies.
- Purview extends protection to unmanaged apps, so you can address shadow AI risks without slowing down your teams.
- The platform automates fixes, such as removing public sharing links or applying data loss prevention policies.
You do not need to change how you work. Purview fits into your current workflows and makes risk management easier. You can focus on your main tasks while keeping your data safe.
Continuous Improvement
You should treat data governance as an ongoing journey. Start by reviewing how your catalog and policies work. Check if your controls catch all risks. Update your retention and compliance rules often. Run audits to make sure your risk management strategies stay strong.
- Use Microsoft Purview to monitor data quality and spot issues.
- Set up rules and schedule scans to check for problems.
- Create custom or AI-powered rules for better quality checks.
- Ask for feedback from different teams to improve adoption and close gaps.
You build trust when you show that you care about risk management. Regular updates and reviews help you stay ahead of new threats. You keep your data governance program strong and ready for the future.
Note: Continuous improvement means you never stop learning and adapting. Your data stays protected, and your organization stays ready for change.
Actionable Steps for Organizations
Getting Started with Purview
You can begin your journey to uncover shadow data by following a clear roadmap. Start with a thorough audit of your environment. Inventory all active shadow IT by checking browser extensions and reviewing firewall and proxy logs. This step helps you find unauthorized applications that may store or process sensitive data.
Next, assess the risks and usage patterns. Rank each shadow IT tool based on how often it is used and the level of risk it brings. This ranking helps you decide where to focus your efforts. Identify which tools are useful and compliant, and which ones are harmful. Integrate approved tools into your governance framework and block those that pose threats. Suggest safe alternatives to your teams.
You should generate regular reports on shadow IT usage. These reports help you track progress and spot new risks. Enforce policies for sanctioned applications. Review these policies often to keep them effective. Use specialized tools in Microsoft Purview for shadow IT discovery and monitoring. Always verify the security settings of approved tools. Address AI adoption early to manage unique data exposure risks. Define a clear approval pathway for tool access requests.
Checklist to Address Shadow Data Blindspots:
- Inventory active shadow IT.
- Assess risks and usage patterns.
- Identify useful and malicious shadow IT.
- Generate shadow IT reports.
- Enforce policies for sanctioned applications.
- Use specialized tools for discovery and monitoring.
- Verify security settings of approved tools.
- Address AI adoption proactively.
- Define an approval pathway for tool requests.
Stakeholder Engagement
You need strong stakeholder engagement for successful shadow data management. Different roles play key parts in this process. The table below shows typical stakeholders and their responsibilities:
| Role | Typical Stakeholders | Key Responsibilities |
|---|---|---|
| Executive Sponsorship | Legal, Compliance, Privacy, GRC, Risk Leaders | Provide requirements, enforce policies, allocate resources, and define success metrics. |
| Data Governance Program Owner | CISO, Data Privacy Officer, CIO, GRC Lead | Develop governance policies, define protection needs, ensure integration, and address regulatory compliance. |
| Data Literacy and Training | Training, Employee Development, Communications | Build data literacy programs, deliver role-based training, and support adoption. |
You should involve these groups early. Clear communication and training help everyone understand their role in protecting data.
Sustaining Data Security and Compliance
You must keep your data security and compliance efforts strong over time. Use identity and access management to control who can access different data levels. Conditional access lets you grant permissions based on user roles or other conditions. Authentication and authorization work together in Microsoft Purview to verify user identity and permissions.
Tip: Ongoing monitoring and regular policy reviews help you stay ahead of new risks. Make data governance a continuous process, not a one-time project.
You build a safer, more compliant organization when you follow these steps and keep improving your approach.
You face urgent risks from shadow data blindspots. Over 80% of organizations show signs of unapproved AI activity, and the average enterprise sees 223 data policy violations each month.
| Framework | Key Requirement | Shadow AI Risk |
|---|---|---|
| EU AI Act | Inventory, risk classification | High-risk deployments create liability, fines |
| GDPR | Lawful processing | Uncontrolled data triggers major penalties |
| HIPAA | PHI protection | Unauthorized AI use risks patient confidentiality |
Microsoft Purview empowers you with continuous discovery, advanced classification, and shared data views. Start by reviewing your policies, creating custom information types, and monitoring sensitive data. Build a culture of proactive governance by aligning strategy, embedding data stewards, and refining practices for future readiness.
FAQ
What is shadow data?
Shadow data is information that exists outside your organization’s official data management systems. You may find it in unsanctioned apps, personal devices, or forgotten storage. This data often escapes your security and compliance controls.
How does Microsoft Purview help you find shadow data?
Microsoft Purview uses continuous discovery to scan all your data sources. You get real-time mapping of structured and unstructured data across cloud and on-premises environments. This helps you uncover hidden or unmanaged data quickly.
Why should you care about shadow data?
Shadow data increases your risk of data breaches, compliance violations, and operational problems. You cannot protect or govern what you cannot see. Managing shadow data helps you keep your organization secure and compliant.
Can Microsoft Purview classify sensitive data automatically?
Yes. Microsoft Purview uses built-in and custom classifiers to identify sensitive information. You can detect patterns like credit card numbers or personal details. This automatic classification helps you apply the right protection policies.
What types of environments does Microsoft Purview support?
You can use Microsoft Purview with cloud, on-premises, and SaaS platforms. It works with Microsoft 365, Azure, AWS, Google Cloud, and many other data sources.
How do you start using Microsoft Purview for shadow data?
Start by connecting your data sources in Purview. Set up scans to discover and classify data. Review the data map and use built-in reports to monitor risks. You can then enforce policies to protect sensitive information.
Does Microsoft Purview help with regulatory compliance?
Yes. Microsoft Purview supports compliance with frameworks like GDPR, HIPAA, and the EU AI Act. You can track data location, respond to audits, and show proof of protection using built-in tools.
Who should be involved in managing shadow data?
You need a team approach. Involve IT, security, compliance, and business leaders. Everyone plays a role in identifying, monitoring, and protecting data. Training and clear communication help your team succeed.
🚀 Want to be part of m365.fm?
Then stop just listening… and start showing up.
👉 Connect with me on LinkedIn and let’s make something happen:
- 🎙️ Be a podcast guest and share your story
- 🎧 Host your own episode (yes, seriously)
- 💡 Pitch topics the community actually wants to hear
- 🌍 Build your personal brand in the Microsoft 365 space
This isn’t just a podcast — it’s a platform for people who take action.
🔥 Most people wait. The best ones don’t.
👉 Connect with me on LinkedIn and send me a message:
"I want in"
Let’s build something awesome 👊
1
00:00:00,000 --> 00:00:02,000
Your data map is supposed to show everything,
2
00:00:02,000 --> 00:00:05,200
but in most organizations it shows the data someone already registered.
3
00:00:05,200 --> 00:00:09,000
It doesn't show the rogue S3 bucket a marketing team created 14 months ago.
4
00:00:09,000 --> 00:00:11,800
It doesn't show the one drive copies of your customer database.
5
00:00:11,800 --> 00:00:15,600
And it doesn't show why your AI training pipeline keeps pulling from unverified sources.
6
00:00:15,600 --> 00:00:16,800
That's not a failure of policy.
7
00:00:16,800 --> 00:00:18,800
It's a failure of architecture.
8
00:00:18,800 --> 00:00:20,000
The invisible problem.
9
00:00:20,000 --> 00:00:22,800
Shadow data isn't hidden because someone is malicious.
10
00:00:22,800 --> 00:00:26,800
It's hidden because your governance model was never designed for visibility first.
11
00:00:26,800 --> 00:00:30,600
Most enterprises only see 60 to 70% of their sensitive assets.
12
00:00:30,600 --> 00:00:35,400
The other 30 to 40% lives outside formal governance frameworks and it grows every day.
13
00:00:35,400 --> 00:00:36,800
The definition is simple.
14
00:00:36,800 --> 00:00:41,000
Shadow data is any unknown, hidden or overlooked copy of sensitive information
15
00:00:41,000 --> 00:00:44,400
that exists outside your IT security and governance frameworks.
16
00:00:44,400 --> 00:00:45,600
It's not the same as shadow IT.
17
00:00:45,600 --> 00:00:48,800
Shadow IT is the unauthorized applications employees use.
18
00:00:48,800 --> 00:00:52,600
Shadow data is the information itself, the actual files and records that slip through the cracks.
19
00:00:52,600 --> 00:00:57,200
You can block every unauthorized app on your network and still have massive shadow data exposure
20
00:00:57,200 --> 00:01:00,400
because the data lives in authorized tools that nobody is monitoring.
21
00:01:00,400 --> 00:01:02,400
Data sprawl is the broader phenomenon.
22
00:01:02,400 --> 00:01:07,200
It describes the uncontrolled proliferation of data across multiple locations, systems and devices.
23
00:01:07,200 --> 00:01:11,800
Shadow data is the subset of that sprawl which remains invisible to your governance teams.
24
00:01:11,800 --> 00:01:13,600
You can have data sprawl that you know about.
25
00:01:13,600 --> 00:01:15,000
Shadow data is the part you don't.
26
00:01:15,000 --> 00:01:18,800
The distinction matters because many organizations celebrate reducing data sprawl
27
00:01:18,800 --> 00:01:22,000
while their shadow data footprint continues expanding unnoticed.
28
00:01:22,000 --> 00:01:24,000
Data silos are another related problem.
29
00:01:24,000 --> 00:01:27,200
Different teams collect, manage and store their information separately,
30
00:01:27,200 --> 00:01:29,400
often with limited cross-departmental access.
31
00:01:29,400 --> 00:01:32,400
Silo's create visibility gaps that frequently have a shadow data.
32
00:01:32,400 --> 00:01:37,800
But silos are usually the result of organizational structure and historical system implementations.
33
00:01:37,800 --> 00:01:41,800
Shadow data often emerges when employees deliberately circumvent official systems
34
00:01:41,800 --> 00:01:43,200
to get their work done faster.
35
00:01:43,200 --> 00:01:48,000
A silo is the finance team keeping customer data in a separate database that IT knows about.
36
00:01:48,000 --> 00:01:53,200
Shadow data is the finance analyst exporting that data to a spreadsheet and emailing it to a vendor.
37
00:01:53,200 --> 00:01:55,400
Understanding where shadow data hides is essential
38
00:01:55,400 --> 00:01:57,800
because you can't scan for what you don't know to look for.
39
00:01:57,800 --> 00:01:59,800
Personal devices are an obvious vector.
40
00:01:59,800 --> 00:02:03,600
Employees store corporate files on laptops, tablets and smartphones
41
00:02:03,600 --> 00:02:06,400
that never connect to your mobile device management platform.
42
00:02:06,400 --> 00:02:09,400
They use consumer cloud storage accounts like Dropbox or Google Drive
43
00:02:09,400 --> 00:02:12,800
because the official corporate file share is too slow or too restrictive.
44
00:02:12,800 --> 00:02:15,800
They copy databases to local drives for offline analysis.
45
00:02:15,800 --> 00:02:18,400
Then forget the copies exist when they move to another project.
46
00:02:18,400 --> 00:02:21,200
Departmental servers represent another common hiding place.
47
00:02:21,200 --> 00:02:24,600
Business units maintain their own infrastructure for specific applications
48
00:02:24,600 --> 00:02:29,400
and these servers often escape central backup, patching and monitoring regimes.
49
00:02:29,400 --> 00:02:33,000
A marketing department might run a web server for campaign landing pages
50
00:02:33,000 --> 00:02:34,600
that stores prospect data.
51
00:02:34,600 --> 00:02:37,600
A research team might maintain a file server for experimental results
52
00:02:37,600 --> 00:02:39,600
that contains proprietary formulations.
53
00:02:39,600 --> 00:02:42,200
These servers aren't malicious, they're business critical.
54
00:02:42,200 --> 00:02:46,000
But if they aren't in your governance framework, they're shadow data repositories.
55
00:02:46,000 --> 00:02:50,000
Road cloud storage accounts proliferate faster than most organizations realize.
56
00:02:50,000 --> 00:02:53,600
Departmental procurement of SaaS solutions creates numerous data stores
57
00:02:53,600 --> 00:02:55,200
that central IT never sees.
58
00:02:55,200 --> 00:03:00,200
A sales team adopts a new CRM add-on that syncs customer data to an external database.
59
00:03:00,200 --> 00:03:03,200
A support team starts using a cloud-based ticket system
60
00:03:03,200 --> 00:03:06,600
that stores attachments containing screenshots of sensitive systems.
61
00:03:06,600 --> 00:03:10,400
Each new service creates a new potential shadow data location
62
00:03:10,400 --> 00:03:14,200
and the cumulative effect across dozens of business units is staggering.
63
00:03:14,200 --> 00:03:17,200
Forgotten repositories are perhaps the most insidious category.
64
00:03:17,200 --> 00:03:21,600
Develop a spin-up test databases for a project, use production data for realistic testing
65
00:03:21,600 --> 00:03:24,600
and leave the databases running after the project ships.
66
00:03:24,600 --> 00:03:28,200
Marketing teams create temporary storage buckets for campaign assets
67
00:03:28,200 --> 00:03:30,400
and forget to delete them when the campaign ends.
68
00:03:30,400 --> 00:03:33,200
Contractors upload project files to collaboration platforms
69
00:03:33,200 --> 00:03:35,800
that remain accessible long after the contract expires.
70
00:03:35,800 --> 00:03:38,800
These repositories aren't actively used, which makes them invisible
71
00:03:38,800 --> 00:03:43,400
to user activity monitoring, but they remain accessible and they remain full of sensitive data.
72
00:03:43,400 --> 00:03:47,000
AI training pipelines have created an entirely new category of shadow data.
73
00:03:47,000 --> 00:03:50,600
Data science teams routinely extract production data sets for model training,
74
00:03:50,600 --> 00:03:53,400
store them in personal workspaces or blob containers,
75
00:03:53,400 --> 00:03:57,200
and iterate on them without documenting the lineage or access controls.
76
00:03:57,200 --> 00:04:01,400
These training data sets often contain the most sensitive information in the organization
77
00:04:01,400 --> 00:04:04,600
because models require realistic data to produce useful results.
78
00:04:04,600 --> 00:04:08,400
The copies multiply as different teams train different models on overlapping data sets
79
00:04:08,400 --> 00:04:10,800
and each copy becomes another shadow repository.
80
00:04:10,800 --> 00:04:14,200
When a model is deployed to production, the organization often can't verify
81
00:04:14,200 --> 00:04:16,400
that its training data was properly governed,
82
00:04:16,400 --> 00:04:21,200
which creates compliance exposure that persists for the entire lifetime of the model.
83
00:04:21,200 --> 00:04:23,000
The historical arc matters here.
84
00:04:23,000 --> 00:04:26,800
In the early days of personal computing, employees started creating local copies
85
00:04:26,800 --> 00:04:30,000
of databases and spreadsheets to work around mainframe limitations.
86
00:04:30,000 --> 00:04:31,400
That habit never went away.
87
00:04:31,400 --> 00:04:34,200
It accelerated with cloud computing and SaaS solutions,
88
00:04:34,200 --> 00:04:39,000
which led business units, deploy applications and store data without involving central IT.
89
00:04:39,000 --> 00:04:41,800
The proliferation of mobile devices added another layer.
90
00:04:41,800 --> 00:04:44,800
Employees began storing and sharing sensitive corporate information
91
00:04:44,800 --> 00:04:46,600
on personal smartphones and tablets,
92
00:04:46,600 --> 00:04:51,000
often through consumer grade applications that lacked enterprise security controls.
93
00:04:51,000 --> 00:04:54,600
Then the global shift to remote and hybrid work created an inflection point.
94
00:04:54,600 --> 00:04:58,400
Organizations rapidly deployed new collaboration tools and storage solutions
95
00:04:58,400 --> 00:05:01,000
without implementing corresponding governance measures.
96
00:05:01,000 --> 00:05:04,200
And the result was an exponential increase in unmanaged data repositories
97
00:05:04,200 --> 00:05:06,400
across distributed environments.
98
00:05:06,400 --> 00:05:11,200
When employees work from home, the boundary between corporate data and personal data blurs,
99
00:05:11,200 --> 00:05:15,200
files moved to home directories, family shared drives and personal cloud accounts
100
00:05:15,200 --> 00:05:18,800
because that's the easiest way to access them from multiple devices.
101
00:05:18,800 --> 00:05:21,200
Cloud adoption added even more complexity.
102
00:05:21,200 --> 00:05:24,400
Business units often procure cloud services through departmental budgets
103
00:05:24,400 --> 00:05:26,400
rather than centralized IT governance,
104
00:05:26,400 --> 00:05:28,400
which creates a fragmented data landscape
105
00:05:28,400 --> 00:05:32,400
where information flows freely across boundaries without proper visibility or control.
106
00:05:32,400 --> 00:05:34,400
The lift and shift approach to cloud migration
107
00:05:34,400 --> 00:05:37,400
replicates on premises shadow data challenges in cloud environments
108
00:05:37,400 --> 00:05:41,200
while introducing new complexities related to multi-cloud architectures
109
00:05:41,200 --> 00:05:42,800
and hybrid deployments.
110
00:05:42,800 --> 00:05:46,400
A database that was shadow data on a physical server in a branch office
111
00:05:46,400 --> 00:05:48,800
becomes shadow data in an Azure subscription
112
00:05:48,800 --> 00:05:51,200
that the central cloud team doesn't monitor.
113
00:05:51,200 --> 00:05:53,600
Artificial intelligence and machine learning initiatives
114
00:05:53,600 --> 00:05:57,000
have introduced the most recent driver of shadow data proliferation.
115
00:05:57,000 --> 00:06:00,000
Data science teams frequently create local copies of data sets
116
00:06:00,000 --> 00:06:02,000
for model training and experimentation,
117
00:06:02,000 --> 00:06:07,000
often storing these copies in unsecured locations without proper governance oversight.
118
00:06:07,000 --> 00:06:09,600
The pressure to deliver AI capabilities quickly
119
00:06:09,600 --> 00:06:13,000
leads many organizations to prioritize speed over governance,
120
00:06:13,000 --> 00:06:17,000
resulting in numerous shadow data repositories containing sensitive information
121
00:06:17,000 --> 00:06:18,600
used for AI development.
122
00:06:18,600 --> 00:06:22,400
The irony is that these AI initiatives are often sponsored at the executive level
123
00:06:22,400 --> 00:06:25,800
while their data practices remain invisible to the same governance programs
124
00:06:25,800 --> 00:06:27,600
that protect production systems.
125
00:06:27,600 --> 00:06:29,800
The convergence of remote work, cloud adoption,
126
00:06:29,800 --> 00:06:33,200
and AI acceleration has created a perfect storm.
127
00:06:33,200 --> 00:06:36,400
Each factor reinforces the others to produce an increasingly complex
128
00:06:36,400 --> 00:06:40,200
and opaque data landscape that challenges traditional governance approaches.
129
00:06:40,200 --> 00:06:41,800
These aren't temporary phenomena.
130
00:06:41,800 --> 00:06:44,600
They represent fundamental shifts in how businesses operate
131
00:06:44,600 --> 00:06:48,200
and they require equally fundamental changes to data governance strategies
132
00:06:48,200 --> 00:06:51,400
rather than incremental adjustments to existing frameworks.
133
00:06:51,400 --> 00:06:53,400
The question isn't whether you have shadow data.
134
00:06:53,400 --> 00:06:57,200
The question is how much it's costing you and whether you're prepared to find out.
135
00:06:57,200 --> 00:06:58,400
The business impact.
136
00:06:58,400 --> 00:07:03,000
The financial impact of unmanaged shadow data extends far beyond immediate breach costs.
137
00:07:03,000 --> 00:07:05,800
Organizations experience multi-dimensional financial consequences
138
00:07:05,800 --> 00:07:10,800
that compound over time as shadow data accumulates across the enterprise ecosystem.
139
00:07:10,800 --> 00:07:15,200
The IBM cost of a data breach report found that incidents involving shadow data
140
00:07:15,200 --> 00:07:19,200
cost organizations an average of $4.87 million per breach.
141
00:07:19,200 --> 00:07:23,000
That's significantly higher than breaches involving only centrally managed data
142
00:07:23,000 --> 00:07:26,800
primarily because of the extended detection and containment times associated
143
00:07:26,800 --> 00:07:28,600
with shadow data repositories.
144
00:07:28,600 --> 00:07:34,200
When shadow data is involved, incidents take an average of 287 days to identify and contain.
145
00:07:34,200 --> 00:07:38,600
For breaches confined to govern systems, that number drops to 228 days.
146
00:07:38,600 --> 00:07:43,600
The extra 59 days of dwell time allow attackers more time to exfiltrate sensitive information
147
00:07:43,600 --> 00:07:45,600
and move laterally across the network,
148
00:07:45,600 --> 00:07:48,600
which substantially increases the breaches financial impact.
149
00:07:48,600 --> 00:07:53,000
Beyond direct breach costs, organizations suffer significant operational inefficiencies.
150
00:07:53,000 --> 00:07:56,800
Employees waste approximately 3.1 hours per week searching for information
151
00:07:56,800 --> 00:07:59,200
across disparate, ungoverned repositories.
152
00:07:59,200 --> 00:08:04,400
That translates to an annual productivity loss of $5,200 per employee.
153
00:08:04,400 --> 00:08:11,000
For a mid-sized company with 5,000 employees, that's over $26 million in lost productivity every single year.
154
00:08:11,000 --> 00:08:13,800
Shadow Data also creates substantial compliance costs.
155
00:08:13,800 --> 00:08:19,400
Financial Services firms report an average expenditure of $1.2 million annually specifically
156
00:08:19,400 --> 00:08:23,400
for shadow data remediation activities related to compliance requirements.
157
00:08:23,400 --> 00:08:26,400
The cost of non-compliance amplifies these impacts even further.
158
00:08:26,400 --> 00:08:32,200
GDPR violations involving shadow data have resulted in fines averaging 18.7 million euros
159
00:08:32,200 --> 00:08:36,000
or 4% of global annual turnover, which ever is higher.
160
00:08:36,000 --> 00:08:40,000
Regulators increasingly hold organizations accountable for data they claim to be unaware of
161
00:08:40,000 --> 00:08:43,400
and they consistently reject claims of ignorance regarding data
162
00:08:43,400 --> 00:08:45,800
that should have been discovered and protected.
163
00:08:45,800 --> 00:08:49,200
Healthcare organizations face even more stringent requirements under HIPAA.
164
00:08:49,200 --> 00:08:53,200
The Department of Health and Human Services has increasingly focused enforcement actions
165
00:08:53,200 --> 00:08:56,600
on organization's ability to account for all protected health information
166
00:08:56,600 --> 00:08:58,600
across their data ecosystems.
167
00:08:58,600 --> 00:09:01,400
Recent settlements have included multi-million dollar penalties,
168
00:09:01,400 --> 00:09:04,200
specifically citing failures in data discovery and mapping.
169
00:09:04,200 --> 00:09:07,400
For multinational organizations, data sovereignty requirements mandate
170
00:09:07,400 --> 00:09:12,200
that certain categories of data remain within specific geographic boundaries.
171
00:09:12,200 --> 00:09:15,800
Shadow Data that proliferates across cloud regions and personal devices
172
00:09:15,800 --> 00:09:19,600
without proper location tracking creates significant compliance risks
173
00:09:19,600 --> 00:09:22,600
that are nearly impossible to manage retrospectively.
174
00:09:22,600 --> 00:09:26,400
Financial Services organizations must contend with additional regulatory frameworks
175
00:09:26,400 --> 00:09:29,100
including GLBR, SOX and PCI DSS.
176
00:09:29,100 --> 00:09:32,400
All of these contain specific data management and protection requirements
177
00:09:32,400 --> 00:09:37,400
that become impossible to satisfy when shadow data exists outside governance frameworks.
178
00:09:37,400 --> 00:09:41,600
The Evolving EUA IACT introduces additional data governance requirements
179
00:09:41,600 --> 00:09:45,200
specifically targeting training data for artificial intelligence systems,
180
00:09:45,200 --> 00:09:49,000
creating new compliance risks when shadow data is inadvertently incorporated
181
00:09:49,000 --> 00:09:52,500
into AI development without proper oversight.
182
00:09:52,500 --> 00:09:56,500
The operational inefficiencies created by shadow data represent a significant
183
00:09:56,500 --> 00:09:58,600
yet frequently overlooked business impact.
184
00:09:58,600 --> 00:10:03,400
Enterprises waste approximately 20 to 30% of their data related operational capacity
185
00:10:03,400 --> 00:10:08,400
managing the fragmentation and inconsistency caused by ungoverned data repositories.
186
00:10:08,400 --> 00:10:12,000
Employees across departments spend an average of 19% of their work week
187
00:10:12,000 --> 00:10:15,800
searching for information across disparate systems and 38% report
188
00:10:15,800 --> 00:10:19,300
that they frequently can't locate the data they need when they need it.
189
00:10:19,300 --> 00:10:24,400
Sales teams wait an average of 48 hours to access customer information stored in shadow repositories.
190
00:10:24,400 --> 00:10:29,100
Procurement departments experience 30% longer cycle times due to inconsistent supplier data.
191
00:10:29,100 --> 00:10:33,100
Product development teams report 25% longer time to market
192
00:10:33,100 --> 00:10:37,500
due to difficulties accessing complete accurate product specifications.
193
00:10:37,500 --> 00:10:41,700
Organizations lose an estimated 8 to 12% of potential revenue opportunities annually
194
00:10:41,700 --> 00:10:46,200
due to slow decision making and missed market windows caused by data fragmentation.
195
00:10:46,200 --> 00:10:49,500
Different departments often maintain conflicting versions of the same information
196
00:10:49,500 --> 00:10:53,700
in separate shadow repositories which leads to significant reconciliation efforts
197
00:10:53,700 --> 00:10:57,900
and decision paralysis when stakeholders can't determine which data source
198
00:10:57,900 --> 00:11:00,300
represents the authoritative version.
199
00:11:00,300 --> 00:11:03,300
This problem is particularly acute in mergers and acquisitions.
200
00:11:03,300 --> 00:11:08,300
Where integrating data ecosystems reveals extensive shadow data duplication and inconsistency
201
00:11:08,300 --> 00:11:15,300
that can extend integration timelines by 40 to 60% and increase integration costs by 25 to 35%.
202
00:11:15,300 --> 00:11:18,800
The lack of standardized data formats and definitions across shadow repositories
203
00:11:18,800 --> 00:11:21,500
also creates substantial barriers to automation.
204
00:11:21,500 --> 00:11:26,000
Organizations report that 65% of potential robotic process automation opportunities
205
00:11:26,000 --> 00:11:30,000
can't be implemented due to inconsistent or inaccessible data sources.
206
00:11:30,000 --> 00:11:34,100
Shadow data repositories typically exhibit three to five times higher error rates
207
00:11:34,100 --> 00:11:37,600
than centrally managed systems due to the absence of validation rules,
208
00:11:37,600 --> 00:11:40,600
cleansing processes and quality monitoring.
209
00:11:40,600 --> 00:11:45,100
Reputational damage from shadow data incidents often exceeds the immediate financial consequences.
210
00:11:45,100 --> 00:11:49,600
Organizations experiencing breaches involving shadow data suffer 35% greater erosion
211
00:11:49,600 --> 00:11:53,600
of customer trust compared to breaches confined to centrally managed systems.
212
00:11:53,600 --> 00:11:56,300
The extended dwell time characteristic of shadow data breaches
213
00:11:56,300 --> 00:12:01,000
creates the impression of systemic security failures rather than isolated incidents.
214
00:12:01,000 --> 00:12:04,800
Customers increasingly view an organization's ability to manage its data responsibly
215
00:12:04,800 --> 00:12:10,700
as a proxy for overall trustworthiness and 78% of consumers indicate they would reconsider
216
00:12:10,700 --> 00:12:14,900
their relationship with the company following a data breach involving information
217
00:12:14,900 --> 00:12:17,700
they believed were securely managed.
218
00:12:17,700 --> 00:12:22,400
Organizations experiencing shadow data breaches report 22% higher customer turn rates
219
00:12:22,400 --> 00:12:25,500
in the six months following an incident compared to industry averages.
220
00:12:25,500 --> 00:12:29,900
It takes organizations an average of 28 months to fully recover their pre-breach reputation metrics
221
00:12:29,900 --> 00:12:36,600
following incidents involving shadow data compared to 18 months for breaches confined to govern systems.
222
00:12:36,600 --> 00:12:41,200
65% of technology professionals indicate they would be less likely to join an organization
223
00:12:41,200 --> 00:12:45,500
with a history of shadow data breaches viewing such incidents as indicative of poor technical leadership
224
00:12:45,500 --> 00:12:47,500
and operational discipline.
225
00:12:47,500 --> 00:12:50,900
This talent impact is often overlooked in breach cost calculations,
226
00:12:50,900 --> 00:12:54,200
but it has long term consequences for your ability to build and retain
227
00:12:54,200 --> 00:12:56,000
a high performing technical organization.
228
00:12:56,000 --> 00:13:00,800
The case study that brings all of this together involves a major financial services organization
229
00:13:00,800 --> 00:13:03,700
that experienced a significant breach in late 2025.
230
00:13:03,700 --> 00:13:07,400
An unsecured Amazon S3 bucket containing customer financial records
231
00:13:07,400 --> 00:13:10,200
had been created by a marketing team for campaign analysis
232
00:13:10,200 --> 00:13:13,700
but was subsequently forgotten and left without proper access controls.
233
00:13:13,700 --> 00:13:17,300
The bucket contained personally identifiable information and financial data
234
00:13:17,300 --> 00:13:20,200
for approximately 8.7 million customers.
235
00:13:20,200 --> 00:13:23,700
It remained publicly accessible for 14 months before discovery.
236
00:13:23,700 --> 00:13:30,700
During that time attackers exfiltrated the data and used it for sophisticated identity theft and financial fraud schemes.
237
00:13:30,700 --> 00:13:35,700
The immediate financial impact included a $22 million regulatory fine from multiple jurisdictions,
238
00:13:35,700 --> 00:13:42,500
$15 million in direct breach response costs, and $38 million in customer compensation and credit monitoring services.
239
00:13:42,500 --> 00:13:45,900
That totals approximately $75 million in direct costs,
240
00:13:45,900 --> 00:13:49,000
but the more significant impact emerged from customer attrition.
241
00:13:49,000 --> 00:13:54,800
The organization experienced a 27% churn rate among affected customers in the 6 months following the breach announcement,
242
00:13:54,800 --> 00:13:59,400
resulting in an estimated $210 million in lost annual revenue.
243
00:13:59,400 --> 00:14:03,000
This revenue loss exceeded the direct breach costs by nearly 3 to 1,
244
00:14:03,000 --> 00:14:09,300
demonstrating that the long term business impact of shadow data breaches extends far beyond the immediate regulatory and response expenses.
245
00:14:09,300 --> 00:14:13,800
The breach also triggered a 34% decline in new customer acquisition during the following year,
246
00:14:13,800 --> 00:14:20,200
with 68% of potential customers citing the breach as a primary factor in their decision to choose a competitor.
247
00:14:20,200 --> 00:14:28,000
Subsequent internal investigations identified over 1,200 additional unsecured data repositories across the organization's cloud environments,
248
00:14:28,000 --> 00:14:31,600
containing sensitive information for more than 22 million customers.
249
00:14:31,600 --> 00:14:35,900
Remediation efforts required 18 months and cost an additional $45 million.
250
00:14:35,900 --> 00:14:40,800
The organization's stock price declined by 19% in the three months following the breach announcement
251
00:14:40,800 --> 00:14:43,800
and took 14 months to recover to pre-breach levels.
252
00:14:43,800 --> 00:14:48,200
The organization was forced to delay a major AI-driven customer service transformation by 18 months
253
00:14:48,200 --> 00:14:52,200
while rebuilding data governance capabilities, causing them to fall behind competitors
254
00:14:52,200 --> 00:14:55,500
who had invested in comprehensive data mapping and governance.
255
00:14:55,500 --> 00:14:59,400
Multiple class action lawsuits were ultimately settled for $85 million,
256
00:14:59,400 --> 00:15:03,200
bringing the total direct costs to approximately $415 million.
257
00:15:03,200 --> 00:15:07,000
The organization's attempts to attribute blame to the marketing team backfired,
258
00:15:07,000 --> 00:15:11,600
as regulators and courts determined that the organization bore ultimate responsibility
259
00:15:11,600 --> 00:15:15,400
for failing to implement adequate data discovery and governance processes
260
00:15:15,400 --> 00:15:19,300
that would have identified and secured the shadow data repository.
261
00:15:19,300 --> 00:15:23,600
This case study illustrates that shadow data isn't merely a compliance risk or security risk.
262
00:15:23,600 --> 00:15:28,100
It's an existential business risk that can destroy customer relationships, market position,
263
00:15:28,100 --> 00:15:31,600
and strategic initiatives in a single incident, the structural flaw.
264
00:15:31,600 --> 00:15:35,500
The old model for data governance relies on periodic audits, spreadsheet inventories,
265
00:15:35,500 --> 00:15:38,500
and department self-reporting. This approach was never fast enough,
266
00:15:38,500 --> 00:15:41,900
but in a static on-premises environment, it was at least possible.
267
00:15:41,900 --> 00:15:44,100
Today, it's neither fast enough nor possible.
268
00:15:44,100 --> 00:15:48,100
Data creation speed exceeds manual cataloging capacity by orders of magnitude.
269
00:15:48,100 --> 00:15:51,500
By the time a manual audit finishes, the environment has changed.
270
00:15:51,500 --> 00:15:54,500
New repositories have been created, old ones have been forgotten,
271
00:15:54,500 --> 00:15:56,400
and the inventory is already outdated.
272
00:15:56,400 --> 00:15:58,100
This is the latency of enforcement problem.
273
00:15:58,100 --> 00:15:59,900
Your governance policy might be correct,
274
00:15:59,900 --> 00:16:02,900
but if your map of the environment lags reality by months,
275
00:16:02,900 --> 00:16:04,500
the policy is governing a fiction.
276
00:16:04,500 --> 00:16:08,100
The fundamental mismatch is that governance was designed for static systems
277
00:16:08,100 --> 00:16:10,500
and is being applied to dynamic cloud estates.
278
00:16:10,500 --> 00:16:13,100
Most organizations build their data governance frameworks
279
00:16:13,100 --> 00:16:17,100
around the assumption that data lives in known databases and approved file shares.
280
00:16:17,100 --> 00:16:18,500
That assumption is broken.
281
00:16:18,500 --> 00:16:20,200
Work doesn't start with navigation anymore.
282
00:16:20,200 --> 00:16:23,400
It starts with context, and context is created in tools and repositories
283
00:16:23,400 --> 00:16:26,200
that emerge faster than any manual process can track.
284
00:16:26,200 --> 00:16:30,900
Organizations that conflate shadow data with shadow IT often implement ineffective solutions.
285
00:16:30,900 --> 00:16:36,300
They focus on blocking unauthorized applications without addressing the data that already exists in unauthorized locations.
286
00:16:36,300 --> 00:16:42,000
Or they attempt to break down data silos without first identifying and securing the shadow data those silos contain.
287
00:16:42,000 --> 00:16:46,600
The most effective governance strategies recognize the interrelationships between these phenomena
288
00:16:46,600 --> 00:16:50,100
while applying targeted approaches to each specific challenge.
289
00:16:50,100 --> 00:16:54,000
Shadow IT governance focuses on application inventory and user behavior.
290
00:16:54,000 --> 00:16:58,100
Data silo governance focuses on integration, architecture, and access policies.
291
00:16:58,100 --> 00:17:01,700
Shadow data governance focuses on discovery, classification, and lineage.
292
00:17:01,700 --> 00:17:06,000
All three are necessary, but they require different tools and different success metrics.
293
00:17:06,000 --> 00:17:10,300
The latency of enforcement isn't just a technical problem, it's an organizational problem.
294
00:17:10,300 --> 00:17:15,300
When your governance cycle operates on quarterly audits, your policy changes take effect quarterly.
295
00:17:15,300 --> 00:17:18,100
In a cloud environment where new data stores appear daily,
296
00:17:18,100 --> 00:17:20,800
quarterly governance is effectively no governance at all.
297
00:17:20,800 --> 00:17:25,200
The gap between policy intent and policy reality widens until the policy becomes irrelevant.
298
00:17:25,200 --> 00:17:31,300
This is why manual governance failed and it's why automated discovery is the prerequisite for any effective modern governance program.
299
00:17:31,300 --> 00:17:34,900
This is where the model has to change, not more governance, different governance.
300
00:17:34,900 --> 00:17:39,700
Visibility must come before control because you can't protect what you can't see.
301
00:17:39,700 --> 00:17:40,700
The purview model.
302
00:17:40,700 --> 00:17:45,500
Microsoft purview wasn't designed to add another layer of policy on top of your existing stack.
303
00:17:45,500 --> 00:17:49,200
It was designed to replace the assumption that you already know where your data lives.
304
00:17:49,200 --> 00:17:50,700
The core philosophy is simple.
305
00:17:50,700 --> 00:17:53,000
Discover first, govern second.
306
00:17:53,000 --> 00:17:57,100
Most governance platforms start with rules. They assume you have a complete inventory
307
00:17:57,100 --> 00:17:59,200
and they apply controls to that inventory.
308
00:17:59,200 --> 00:18:01,200
Purview starts with the opposite assumption.
309
00:18:01,200 --> 00:18:08,400
It assumes your inventory is incomplete and its first job is to close that gap without disrupting the systems that are actually running your business.
310
00:18:08,400 --> 00:18:12,900
This is the structural difference that makes purview effective for shadow data where other platforms fail.
311
00:18:12,900 --> 00:18:15,600
The data map is the foundation. It's not a static catalog.
312
00:18:15,600 --> 00:18:22,200
It's a continuously updated metadata repository that discovers catalogs and classifies data assets from hundreds of supported sources.
313
00:18:22,200 --> 00:18:27,600
Those sources include on-premises systems, cloud platforms and SAS applications.
314
00:18:27,600 --> 00:18:30,800
The data map doesn't require you to pre-register every repository.
315
00:18:30,800 --> 00:18:33,300
It scans your environment and builds the map for you.
316
00:18:33,300 --> 00:18:37,000
This matters because the data map can find assets you didn't know existed,
317
00:18:37,000 --> 00:18:39,800
which is exactly the capability you need for shadow data.
318
00:18:39,800 --> 00:18:44,100
The metadata repository stores three types of metadata for each discovered asset.
319
00:18:44,100 --> 00:18:49,000
Technical metadata includes schemers, data types, storage locations and file formats.
320
00:18:49,000 --> 00:18:53,200
Operational metadata includes access patterns, update frequency and scan history.
321
00:18:53,200 --> 00:18:58,600
Business metadata includes ownership assignments, business context descriptions and sensitivity classifications.
322
00:18:58,600 --> 00:19:04,000
The combination of these three metadata layers transforms raw discovery into actionable intelligence.
323
00:19:04,000 --> 00:19:06,300
Complimenting the data map is the data catalog.
324
00:19:06,300 --> 00:19:12,200
This is the business-friendly interface that makes the technical metadata accessible to people who don't live in Azure portals every day.
325
00:19:12,200 --> 00:19:20,000
It provides a searchable business glossary, data dictionaries and rich metadata annotations that bridge the gap between technical data structures and business context.
326
00:19:20,000 --> 00:19:25,000
Without this bridge, your governance program remains an IT project instead of a business capability.
327
00:19:25,000 --> 00:19:31,100
Data stewards and business analysts use the catalog to find assets, understand their meaning and determine whether they meet their needs.
328
00:19:31,100 --> 00:19:33,700
The classification engine is the third core component.
329
00:19:33,700 --> 00:19:42,500
It leverages both system-defined and custom classification rules to automatically identify and label sensitive data according to organizational policies and regulatory requirements.
330
00:19:42,500 --> 00:19:44,700
The engine goes beyond simple pattern matching.
331
00:19:44,700 --> 00:19:50,200
It includes machine learning based identification of complex data types that don't fit neatly into regular expressions.
332
00:19:50,200 --> 00:19:54,800
The classification engine operates during scans, applying labels to assets as they are discovered,
333
00:19:54,800 --> 00:20:01,300
which means newly created shadow repositories get classified automatically rather than waiting for a manual review cycle.
334
00:20:01,300 --> 00:20:08,400
Data lineage completes the core triad. It provides visual representations of data movement and transformation across your entire data estate.
335
00:20:08,400 --> 00:20:16,400
Lineage enables impact analysis, root cause investigation and compliance verification through detailed tracking of data from source to consumption.
336
00:20:16,400 --> 00:20:24,600
For shadow data management, lineage is particularly valuable because it reveals how sensitive information propagates through systems you may not have known were connected.
337
00:20:24,600 --> 00:20:34,200
A file that starts in a govern share point library might flow through an ADF pipeline into a data lake, then into a Power BI data set, then into an analyst's personal workspace.
338
00:20:34,200 --> 00:20:40,500
Lineage captures that entire chain. These core components integrate with Microsoft's broader security and compliance ecosystem.
339
00:20:40,500 --> 00:20:46,500
That includes Microsoft Defender for Cloud, Microsoft Sentinel and the Microsoft 365 Compliance Center.
340
00:20:46,500 --> 00:20:54,400
The result is a unified governance framework that spans data discovery, protection and threat response without requiring you to rip out your existing tooling.
341
00:20:54,400 --> 00:21:02,500
When Perview discovers a sensitive asset, that discovery can trigger DLP policies inside a risk alerts and conditional access rules automatically.
342
00:21:02,500 --> 00:21:11,700
The architecture is designed with extensibility in mind, robust APIs and connectors enable integration with third party data platforms, security tools and business applications.
343
00:21:11,700 --> 00:21:18,500
This means you can leverage Perview within your existing technology stack rather than requiring a wholesale replacement of established systems.
344
00:21:18,500 --> 00:21:25,100
For organizations that have already invested in specialized tools, this modular approach reduces adoption friction significantly.
345
00:21:25,100 --> 00:21:29,800
You don't have to choose between Perview and your existing data quality tool, you connect them.
346
00:21:29,800 --> 00:21:34,300
Perview's Discover First Philosophy minimizes disruption to existing workflows.
347
00:21:34,300 --> 00:21:39,200
Instead of immediately blocking ungoverned repositories, it identifies and catalogs them first.
348
00:21:39,200 --> 00:21:46,700
This gives you the visibility to make informed governance decisions rather than reactive policy changes that interrupt business operations.
349
00:21:46,700 --> 00:21:57,600
You identify and understand your data landscape fully before making governance decisions, which creates a more sustainable and effective governance program that addresses actual business needs rather than theoretical concerns.
350
00:21:57,600 --> 00:22:01,800
The modular design allows organizations to implement capabilities incrementally.
351
00:22:01,800 --> 00:22:07,000
You can start with data discovery and classification before expanding to more advanced governance scenarios.
352
00:22:07,000 --> 00:22:15,100
This supports adoption at organizations with varying levels of data governance maturity, which is important because most enterprises aren't starting from a blank slate.
353
00:22:15,100 --> 00:22:19,300
They have existing policies, existing tools and existing resistance to change.
354
00:22:19,300 --> 00:22:26,300
Perview accommodates that reality by letting you bring one data source under governance at a time rather than requiring a big bank deployment.
355
00:22:26,300 --> 00:22:34,000
A phased approach also lets you demonstrate value early, which builds the political capital needed to expand the program to additional sources and capabilities.
356
00:22:34,000 --> 00:22:40,200
The integration architecture is particularly important for organizations with existing investments in data governance tooling.
357
00:22:40,200 --> 00:22:46,100
Perview doesn't force you to abandon your existing data catalog, your existing DLP solution or your existing CM.
358
00:22:46,100 --> 00:22:52,900
Instead, it acts as a central metadata hub that feeds these specialized tools with richer, more comprehensive data about your estate.
359
00:22:52,900 --> 00:22:57,900
Your existing DLP policies become more effective when they can reference perview classification labels.
360
00:22:57,900 --> 00:23:04,200
Your existing CM alerts become more contextual when they include perview lineage showing how a sensitive file moved through your environment.
361
00:23:04,200 --> 00:23:12,600
This augmentation model reduces the political and technical barriers to adoption because it positions perview as an enabler of existing investments rather than a replacement.
362
00:23:12,600 --> 00:23:14,600
But philosophy doesn't scan your storage.
363
00:23:14,600 --> 00:23:20,600
The real test of any governance platform is what happens when you point it at a production environment that has never been cataloged before.
364
00:23:20,600 --> 00:23:22,600
Let's look at how the engine actually runs.
365
00:23:22,600 --> 00:23:23,900
Automated Discovery.
366
00:23:23,900 --> 00:23:30,700
The scanning architecture in Perview connects to your data sources and extracts metadata without requiring you to move the data itself.
367
00:23:30,700 --> 00:23:35,100
This is a critical distinction. Perview doesn't copy your files into a central repository.
368
00:23:35,100 --> 00:23:41,300
It reads metadata about your files, databases and storage accounts, then builds a searchable index from that metadata.
369
00:23:41,300 --> 00:23:47,300
This approach keeps the performance impact on your production systems minimal while still providing comprehensive visibility.
370
00:23:47,300 --> 00:23:54,100
The metadata includes schema information, column names, file sizes, access patterns, and sample content for classification purposes.
371
00:23:54,100 --> 00:24:05,000
Because only metadata is indexed, your sensitive data never leaves your controlled environment which addresses a common objection from security teams who worry that a governance tool might become another attack surface.
372
00:24:05,000 --> 00:24:08,000
Supported sources span the entire modern data state.
373
00:24:08,000 --> 00:24:19,300
On the Azure side, Perview connects to Azure Data Lake storage, Azure Blob storage, Azure SQL database, Azure Synapse Analytics, Azure Cosmos DB, Azure Databricks, Azure files, and many others.
374
00:24:19,300 --> 00:24:28,500
For multi-cloud environments, it supports Amazon S3, Google Cloud Storage, various AWS database services including RDS and Redshift and Google BigQuery.
375
00:24:28,500 --> 00:24:38,500
On-premises systems are covered through SQL Server, Oracle, Teradata, MySQL, PostgreSQL, and a wide range of file systems including Windows, file shares, and Linux, NFS mounts.
376
00:24:38,500 --> 00:24:43,100
SAS applications like Salesforce, SAP ServiceNow and Power BI are also supported.
377
00:24:43,100 --> 00:24:46,800
The breadth of connectors matters because shadow data doesn't respect your cloud strategy.
378
00:24:46,800 --> 00:24:49,700
It lives wherever business units found it convenient to store it.
379
00:24:49,700 --> 00:24:58,600
The scanning process operates through configurable scan rules that determine what data to collect, how frequently to scan, and what classification rules to apply.
380
00:24:58,600 --> 00:25:07,200
You can tailor discovery efforts to your specific needs and risk profiles rather than running one size fits all scans across your entire state.
381
00:25:07,200 --> 00:25:16,100
This configurability is essential for large organizations where different business units have different data types, different compliance requirements, and different tolerance for scanning overhead.
382
00:25:16,100 --> 00:25:24,400
A financial services firm might configure aggressive scanning with deep content sampling for trading databases while running lightweight metadata only scans for marketing assets.
383
00:25:24,400 --> 00:25:28,100
The scan configuration workflow starts with registering the data source in PerView.
384
00:25:28,100 --> 00:25:32,400
You provide connection details and authentication credentials, then define the scan scope.
385
00:25:32,400 --> 00:25:36,300
Scope determines which databases, folders, or containers, the scan examines.
386
00:25:36,300 --> 00:25:40,800
You then select a scan rule set that specifies which classification rules to apply.
387
00:25:40,800 --> 00:25:43,200
Finally, you set the schedule and trigger type.
388
00:25:43,200 --> 00:25:47,800
The initial scan is always full, reading the complete metadata structure of the source.
389
00:25:47,800 --> 00:25:52,000
Subsequent scans can be incremental, reading only changes since the last scan.
390
00:25:52,000 --> 00:25:57,000
Automated triggers can detect newly created storage buckets and rogue databases almost instantly.
391
00:25:57,000 --> 00:26:04,400
When a new S3 bucket appears in your AWS account or a new Azure storage account is provisioned, PerView can be configured to scan it automatically.
392
00:26:04,400 --> 00:26:09,600
This prevents the accumulation of ungoverned data that characterizes traditional periodic audit approaches.
393
00:26:09,600 --> 00:26:17,600
In the case study we discussed earlier, the marketing teams rogue bucket remained undetected for 14 months because the organization relied on manual inventory processes.
394
00:26:17,600 --> 00:26:20,900
Automated triggers would have surfaced it within hours of creation.
395
00:26:20,900 --> 00:26:25,000
The trigger mechanism works by monitoring your cloud accounts for new resources.
396
00:26:25,000 --> 00:26:31,800
For Azure, PerView can integrate with Azure Event Grid to receive notifications when new storage accounts or databases are provisioned.
397
00:26:31,800 --> 00:26:38,000
For AWS, you can figure cloud watch events to notify PerView when new S3 buckets or RDS instances appear.
398
00:26:38,000 --> 00:26:47,400
This event-driven approach is far more responsive than polling-based discovery and it ensures that shadow repositories are caught at creation rather than at the next scheduled audit.
399
00:26:47,400 --> 00:26:51,200
Incremental scanning is one of the most important capabilities for production protection.
400
00:26:51,200 --> 00:26:57,800
Instead of rereading your entire data estate every time, incremental scans focus only on what has changed since the last scan.
401
00:26:57,800 --> 00:27:01,900
This dramatically reduces the load on your source systems while keeping your data map current.
402
00:27:01,900 --> 00:27:04,600
The initial scan of a large source is always full,
403
00:27:04,600 --> 00:27:12,300
but subsequent scans should typically be incremental unless you have made significant schema changes or updated your classification rule sets.
404
00:27:12,300 --> 00:27:21,100
When you modify classification rules or scan rule sets, PerView may automatically trigger a full rescan of affected sources to apply the new rules across the entire data set.
405
00:27:21,100 --> 00:27:26,500
Managed identities are the recommended authentication model for PerView scanning in 2026.
406
00:27:26,500 --> 00:27:32,000
Each PerView account exposes a system assigned managed identity that you grant appropriate reader roles on your data sources.
407
00:27:32,000 --> 00:27:39,200
For Azure SQL, you create a user from an external provider mapped to the PerView managed identity and grant database reader roles.
408
00:27:39,200 --> 00:27:43,100
For Azure storage, you assign storage block data reader to the managed identity.
409
00:27:43,100 --> 00:27:49,900
For on-premises SQL server, you use a service principle or SQL authentication through the self-hosted integration runtime.
410
00:27:49,900 --> 00:27:57,500
This pattern removes the need for stored passwords or keys which eliminates a common source of credential rotation failures and security vulnerabilities.
411
00:27:57,500 --> 00:28:02,800
The performance overhead of managed identity authentication itself is negligible compared to the scan workload.
412
00:28:02,800 --> 00:28:10,400
Once the identity has the right roles, scans authenticate and proceed with metadata reads just as they would with service principles or account keys.
413
00:28:10,400 --> 00:28:21,800
When you see slow scans or high load on a data source, the main drivers are almost always scan scope, data volume, schema complexity or classification rules rather than the authentication method.
414
00:28:21,800 --> 00:28:31,700
Managed identity does introduce a dependency on Azure Active Directory availability, but in practice, AD outages are rare and scans queue gracefully until authentication resumes.
415
00:28:31,700 --> 00:28:35,700
Scan scope optimization is the most effective lever for controlling performance impact.
416
00:28:35,700 --> 00:28:40,700
Instead of scanning entire subscriptions or storage accounts, you configure scans at the granular level.
417
00:28:40,700 --> 00:28:45,200
For a SQL server, you might scan only specific databases rather than every database on the instance.
418
00:28:45,200 --> 00:28:49,700
For a data lake, you might scan only specific folders rather than the entire container.
419
00:28:49,700 --> 00:28:56,700
You can also exclude file types that aren't relevant to your governance program such as image files or executable binaries in a document repository.
420
00:28:56,700 --> 00:29:02,700
This targeted approach ensures that scan costs and performance remain optimal while still covering your high risk assets.
421
00:29:02,700 --> 00:29:06,900
Custom scan rule sets let you exclude classifiers that aren't relevant to a particular asset type.
422
00:29:06,900 --> 00:29:13,100
If your scanning a storage container that only contains log files, you don't need to run every sensitive data classifier against it.
423
00:29:13,100 --> 00:29:18,500
You create a rule set that includes only the classifiers relevant to your risk profile for that source.
424
00:29:18,500 --> 00:29:21,400
This reduces both scan time and the noise in your results.
425
00:29:21,400 --> 00:29:28,700
A well designed rule set might include 10 classifiers for a human resources data source and only three for a public marketing content repository.
426
00:29:28,700 --> 00:29:36,700
Scan frequency should align with the change rate of your source, highly dynamic sources like streaming pipelines or frequently modified transactional databases
427
00:29:36,700 --> 00:29:39,900
might need daily or even sub-daily incremental scans.
428
00:29:39,900 --> 00:29:46,800
Static or slowly changing sources like archived financial records might only require weekly or monthly scans.
429
00:29:46,800 --> 00:29:53,000
The key is to match your scan cadence to your actual data change patterns rather than running everything on the same schedule.
430
00:29:53,000 --> 00:30:00,000
Overscanning waste capacity and increases throttling risk, under scanning leaves gaps in your visibility that shadow data can exploit.
431
00:30:00,000 --> 00:30:03,600
Scheduling scans during off-peak hours is a basic but essential practice.
432
00:30:03,600 --> 00:30:09,700
For cloud data stores that serve analytics only during business hours, you run per view scans at night or on weekends.
433
00:30:09,700 --> 00:30:14,900
For globally distributed systems, you identify the lowest traffic window and schedule accordingly.
434
00:30:14,900 --> 00:30:21,600
Staggering scan start times across your estate prevents the burst patterns that often trigger throttling or source system slowdowns.
435
00:30:21,600 --> 00:30:28,500
Instead of starting all scans at midnight you might start database scans at 11 pm storage scans at 1 am and SAS scans at 3 am.
436
00:30:28,500 --> 00:30:37,800
In hybrid environments where per view scans on premises systems through self-hosted integration run times network throughput and gateway capacity become the dominant bottlenecks rather than per view itself.
437
00:30:37,800 --> 00:30:49,200
You should use multiple self-hosted integration run times for scale and isolation and you should consider scanning only metadata rather than content sampling in systems where performance or regulatory constraints exist.
438
00:30:49,200 --> 00:30:54,800
The integration run time is your bridge to on-premises data and like any bridge it has capacity limits.
439
00:30:54,800 --> 00:31:01,200
A single integration run time scanning a thousand on-premises file shares will eventually saturate its network connection.
440
00:31:01,200 --> 00:31:07,200
Scan execution monitoring is essential for identifying when a scan has stalled or failed silently.
441
00:31:07,200 --> 00:31:12,400
Per view provides scan history views that show start times end times and status for each scan run.
442
00:31:12,400 --> 00:31:17,700
You should review these histories weekly during initial rollout and monthly during steady state operations.
443
00:31:17,700 --> 00:31:23,200
Failed scans are particularly dangerous because they create the illusion of coverage while leaving assets undiscovered.
444
00:31:23,200 --> 00:31:30,600
A scan that fails due to expired credentials on a critical database might go unnoticed for weeks if you aren't actively monitoring scan outcomes.
445
00:31:30,600 --> 00:31:34,700
Your operational dashboard should alert on any scan failure, not just on system level outages.
446
00:31:34,700 --> 00:31:38,400
Automation is the final piece of a mature scanning strategy.
447
00:31:38,400 --> 00:31:46,300
Instead of relying on administrators to manually trigger scans you use Azure CLI, PowerShell or Logic apps to orchestrate scan creation and execution.
448
00:31:46,300 --> 00:31:53,900
This ensures that scans run consistently and that new data sources are brought under governance as part of your standard provisioning workflow rather than as an afterthought.
449
00:31:53,900 --> 00:32:04,300
You can integrate scan provisioning into your infrastructure as code pipelines so that every new database or storage account automatically gets registered and scanned within hours of deployment.
450
00:32:04,300 --> 00:32:08,500
This closes the window between creation and governance that shadow data exploits.
451
00:32:08,500 --> 00:32:20,700
A terraform template that provisions a new Azure SQL database should include a purview registration block that creates the scan rule set, assigns the managed identity role and triggers the initial scan as part of the same deployment pipeline.
452
00:32:20,700 --> 00:32:27,700
Throttling and production protection scanning at scale introduces a problem most teams ignore until production slows down.
453
00:32:27,700 --> 00:32:35,100
The Microsoft purview data map is a cloud metadata service that stores information about data sources assets, schemas, classifications and lineage.
454
00:32:35,100 --> 00:32:41,600
It's not an infinite resource. It has throughput limits and when you hit them the consequences cascade through your entire governance program.
455
00:32:41,600 --> 00:32:51,100
Throttling occurs when requests to the data map exceed the provision throughput capacity units capacity units represent how many operations the service can reliably process per unit time.
456
00:32:51,100 --> 00:32:55,900
When limits are hit additional requests are delayed, rejected or retried with back off.
457
00:32:55,900 --> 00:33:03,100
Scan and ingestion jobs slow down or stall interactive operations like search, browse and lineage views become sluggish during spikes.
458
00:33:03,100 --> 00:33:07,700
The user experience degrades precisely when your governance teams need the catalog most.
459
00:33:07,700 --> 00:33:11,900
Each purview account has a base allocation of capacity units included with the account.
460
00:33:11,900 --> 00:33:19,100
You can request increases through Azure support quotas but once you upgrade data map throughput you can't downgraded under the classic model.
461
00:33:19,100 --> 00:33:23,300
This makes capacity planning important for both cost and long term architecture.
462
00:33:23,300 --> 00:33:32,100
Many organizations adopt a stepwise increase strategy raising capacity incrementally based on observable load rather than jumping straight to the highest tiers.
463
00:33:32,100 --> 00:33:43,300
A common pattern is to start with the base capacity monitor for throttling events during the first month of production scanning then requests a single increment that covers observed peak load plus 50% headroom.
464
00:33:43,300 --> 00:33:46,700
The default limit for concurrent scans per purview account is five.
465
00:33:46,700 --> 00:33:52,700
You can request an increase up to 10 through Azure support but this requires justification based on your workload needs.
466
00:33:52,700 --> 00:33:59,100
Self-hosted integration runtime scenarios may be governed by separate limitations that are explicitly outside the standard concurrency table.
467
00:33:59,100 --> 00:34:05,500
If you attempt to start more scans than the allowed concurrent limit you encounter throttling errors and queued or failed scan runs.
468
00:34:05,500 --> 00:34:13,300
The error messages typically indicate that the scan is waiting for capacity rather than failing permanently which means your governance data arrives late rather than never arriving.
469
00:34:13,300 --> 00:34:32,100
Late data is still a problem for time sensitive compliance requirements. Throttling most often affects large initial estate scans, high frequency incremental scans of big data platforms, massive lineage event ingestion from synapse and fabric bulk updates of classifications or glossary terms and parallel automation scripts calling data map APIs for custom metadata management.
470
00:34:32,100 --> 00:34:40,100
Burst the ingestion from massive initial scans tends to hit throttling first continuous steady workloads fair better even at moderate capacity when properly scheduled.
471
00:34:40,100 --> 00:34:48,100
The difference is analogous to water pressure in a building a single faucet running steadily works fine but every tenant opening every faucet at once overwhelms the system.
472
00:34:48,100 --> 00:35:04,100
When data map throttling is triggered the direct technical impacts include scan job slowdowns and failures backlog of metadata ingestion where assets scanned in the source aren't yet reflected in the catalog intermittent errors for API clients and degraded interactive experiences in the catalog user interface.
473
00:35:04,100 --> 00:35:19,100
From a business and operational perspective this translates to delayed compliance visibility slower AI and analytics onboarding reduced trust in lineage and catalog data and incident response friction when security teams can't quickly locate and assess impacted assets.
474
00:35:19,100 --> 00:35:26,100
For organizations adopting purview as a central control plane for AI data governance sustained throttling isn't merely a technical nuisance.
475
00:35:26,100 --> 00:35:37,100
It becomes a direct governance and business risk if your data map can't keep up with your environment your AI training pipelines may pull from unverified sources because the catalog hasn't yet registered the new data sets.
476
00:35:37,100 --> 00:35:48,100
Your compliance reports may miss recently created sensitive repositories because the scans are stalled your data scientists may lose trust in the catalog and revert to finding data through informal channels which creates more shadow data.
477
00:35:48,100 --> 00:35:58,100
Right sizing data map capacity requires planning for the expected number of assets scan frequency by source and anticipated lineage volume from fabric synapse and ETL tools.
478
00:35:58,100 --> 00:36:14,100
You add a headroom margin to absorb onboarding spikes on your project surges and you plan periodic capacity reviews as new data sources and AI initiatives go live because capacity increases are non reversible organizations often start with conservative sizing and expand based on observed metrics rather than theoretical projections.
479
00:36:14,100 --> 00:36:22,100
A typical enterprise might start with base capacity for a pilot covering 10,000 assets then increase after measuring actual throughput during full production rollout.
480
00:36:22,100 --> 00:36:29,100
Throttling aware scan strategies start with staggering you schedule big platform scans at different times rather than running them all simultaneously.
481
00:36:29,100 --> 00:36:35,100
You avoid overlapping peak business hours if interactive catalog performance is critical for your data analysts.
482
00:36:35,100 --> 00:36:44,100
You start with high value and high risk data sets like regulated systems and AI training data lakes then expand to lower priority sources as capacity allows.
483
00:36:44,100 --> 00:36:51,100
The scan calendar becomes a critical operational document that your data platform team maintains alongside other infrastructure schedules.
484
00:36:51,100 --> 00:36:58,100
Resilient integration patterns include implementing retry logic with exponential back off for any custom code calling purview data map api's.
485
00:36:58,100 --> 00:37:10,100
You use batching and q based ingestion to smooth bursts of metadata events you treat the data map as a shared platform resource and coordinate with other teams that might run bulk catalog updates or large governance tasks at the same time.
486
00:37:10,100 --> 00:37:20,100
If two teams each run heavy automation scripts on Monday mornings they will collectively degrade performance for everyone establishing a shared calendar for governance automation prevents these collisions.
487
00:37:20,100 --> 00:37:28,100
Operational monitoring should track scan job durations and status error and timeout rates for metadata operations and any exposed throughput metrics in Azure monitor.
488
00:37:28,100 --> 00:37:40,100
You need run books to identify whether slow scans are due to throttling versus source system issues to escalate for quota increases when sustained pressure persists and to temporarily reduce non-critical workloads when capacity is constrained.
489
00:37:40,100 --> 00:37:49,100
Your run book should include specific decision criteria if scan durations increase by more than 50% over baseline for three consecutive runs investigate throttling.
490
00:37:49,100 --> 00:38:06,100
If api error rates exceed 5% for 30 minutes pause non-critical scans and alert the platform team the cost implications of throttling deserve explicit attention in your planning capacity unit increases raise your ongoing purview costs and because they're non reversible under the classic model over provisioning has permanent financial consequences.
491
00:38:06,100 --> 00:38:18,100
Your capacity planning should therefore include cost modeling alongside performance modeling calculate the cost per capacity unit estimate the capacity needed for your target state size and compare that to the cost of the business risks you are mitigating.
492
00:38:18,100 --> 00:38:28,100
In most cases the cost of additional capacity is modest compared to the cost of a single compliance failure or data breach but this comparison should be explicit in your business case rather than assumed.
493
00:38:28,100 --> 00:38:46,100
Custom classifiers even with perfect scanning you will miss the data that matters most if you rely only on generic classification Microsoft chips 93 built in classifiers and they cover the common patterns well credit card numbers national identifiers and common medical codes are all detected out of the box but built in classifiers misproprietry data formats.
494
00:38:46,100 --> 00:38:54,100
Industry specific identifiers and the nuanced document types that carry your organizations most sensitive intellectual property.
495
00:38:54,100 --> 00:39:06,100
Custom classification in purview isn't a single feature it's a set of approaches with different performance characteristics and choosing the wrong approach for your data type is a common source of both false negatives and false positives.
496
00:39:06,100 --> 00:39:23,100
3 mechanisms are trainable classifiers custom rule based classifications using regular expressions or dictionaries and the built in catalog that Microsoft maintains for you each has strengths weaknesses and optimal use cases that every architect should understand before deploying trainable classifiers learn from positive and negative examples.
497
00:39:23,100 --> 00:39:40,100
You provide seed content typically between 50 and 500 positive examples and you place them in a dedicated SharePoint folder you provide a separate folder with negative examples that represent similar but non matching content the model builds within 24 hours or less and you can then test it before publishing for production use.
498
00:39:40,100 --> 00:39:53,100
3. In turn process documents policy artifacts specialized business records and unstructured text that doesn't follow a rigid format all fall into this category.
499
00:39:53,100 --> 00:40:00,100
The main advantage of trainable classifiers is flexibility they can capture patterns that are difficult or impossible to express with regular expressions.
500
00:40:00,100 --> 00:40:26,100
The main limitation is that performance very significantly with seed quality and category clarity if your positive examples aren't representative of the full range of content you need to detect the classifier will misvariance if your positive and negative examples aren't clearly distinct the model will struggle to discriminate a trainable classifier trained on 50 corporate policy documents might fail to detect a policy that uses a different template or was created by an acquired subsidiary with different formatting conventions.
501
00:40:26,100 --> 00:40:33,100
Microsoft advises using a communication site or other standard SharePoint site type for seed content rather than a team's folder type.
502
00:40:33,100 --> 00:40:41,100
This is a specific configuration detail that matters because team's folders have different permission and storage behaviors that can interfere with the classifier training pipeline.
503
00:40:41,100 --> 00:40:52,100
The seed content should be real examples from your environment not synthetic samples created for training purposes because the model needs to learn from the actual language formatting and context your employees use.
504
00:40:52,100 --> 00:40:59,100
Synthetic samples might teach the model to detect your template rather than your actual content which creates a false sense of security.
505
00:40:59,100 --> 00:41:09,100
The training process is opaque in the sense that you don't see the exact model weights or decision boundaries but it's transparent in the sense that you can test the classifier against holdout data before publishing.
506
00:41:09,100 --> 00:41:13,100
You should allocate at least 20% of your seed content for testing rather than training.
507
00:41:13,100 --> 00:41:26,100
If the classifier performs well on the training data but poorly on the test data it has overfit to your examples and will fail in production. This is the same machine learning validation principle that data scientists apply to their models and it is equally important for governance classifiers.
508
00:41:26,100 --> 00:41:36,100
Custom rule-based classifications use deterministic logic. Regular expressions match predictable patterns like employee ID formats, product serial numbers or contract reference codes.
509
00:41:36,100 --> 00:41:45,100
Dictionary matching identifies known term lists such as project code names, client names or band substances. These approaches are preferable when the target pattern is stable and explicit.
510
00:41:45,100 --> 00:41:50,100
They are usually easier to explain, audit and benchmark because outcomes can be traced directly to the rule logic.
511
00:41:50,100 --> 00:41:58,100
Reg-ex-based classification in purview can evaluate both the column name and the display name, instructed sources, not just the payload content.
512
00:41:58,100 --> 00:42:11,100
This matters because apparent false positives or misses may come from metadata matching rather than data matching. If your rejects is designed to match a pattern in cell values but it triggers on a similarly named column header you need to understand that behavior and adjust your rules accordingly.
513
00:42:11,100 --> 00:42:20,100
A rejects for social security numbers might match a column called SSNmasked that actually contains hashed values which would trigger false positives across thousands of rows.
514
00:42:20,100 --> 00:42:26,100
Dictionary uploads use configurable thresholds such as distinct match threshold and minimum match threshold.
515
00:42:26,100 --> 00:42:33,100
These thresholds determine how many terms from your dictionary must appear in a document before it's flagged and how many total matches are required.
516
00:42:33,100 --> 00:42:41,100
Tuning these thresholds is the primary method for controlling false positive rates with dictionary classifiers. A threshold that is too low floods your results with noise.
517
00:42:41,100 --> 00:42:51,100
A threshold that is too high misses legitimate matches. The optimal threshold for a dictionary of pharmaceutical terms might be three distinct matches in a document of at least 100 words.
518
00:42:51,100 --> 00:42:59,100
But you determine this through testing rather than guessing. Built in classifiers remain attractive when you want fast deployment and vendor maintained coverage.
519
00:42:59,100 --> 00:43:11,100
Microsoft updates the built-in catalog as new data types and regulatory requirements emerge. They reduce the effort required to define and maintain detection logic which is valuable for organizations with limited data governance staffing.
520
00:43:11,100 --> 00:43:25,100
The trade-off is less customization and the risk that your specific industry or regional requirements aren't fully covered. A healthcare organization in the United States might find that built-in classifiers cover HIPAA well but miss state-specific privacy regulations that apply to their patient population.
521
00:43:25,100 --> 00:43:33,100
There's no publicly documented universal benchmark for purview custom classifier accuracy latency or recall across common enterprise data types.
522
00:43:33,100 --> 00:43:43,100
Organizations measure performance using their own validation sets against practical metrics. Precision measures how many flagged items are truly relevant, recall measures how many relevant items are successfully found.
523
00:43:43,100 --> 00:43:58,100
False positive rate measures how often the classifier over matches, false negative rate measures how often it misses relevant content, time to train and publish matters for trainable classifiers and operational stability measures whether results stay consistent after content, schema or scan changes.
524
00:43:58,100 --> 00:44:13,100
For rule-based classifiers, benchmarking involves testing rejects or dictionary rules against known data sets and adjusting thresholds to reduce over matching. For trainable classifiers benchmark quality depends on the representativeness of the seed set and the separation between positive and negative examples.
525
00:44:13,100 --> 00:44:24,100
The practical approach is to run your own evaluation on representative data sets and report results separately for trainable and rule-based classifiers since they behave differently and are optimized for different content types.
526
00:44:24,100 --> 00:44:35,100
Exact data match or EDM represents a precision focused approach for highly structured data. Instead of patent matching, EDM compares content against an exact index of known values.
527
00:44:35,100 --> 00:44:43,100
This is particularly useful for employee IDs, customer account numbers and other identifiers where rejects might match false positives that happen to fit the format.
528
00:44:43,100 --> 00:44:57,100
EDM requires more setup because you need to build and maintain the index but it virtually eliminates format-based false positives. The trade-off is that EDM only detects values you already know about so it can't find new instances of a pattern like a reject scan.
529
00:44:57,100 --> 00:45:06,100
The validation workflow before global deployment is critical. Per view provides a testing sandbox where you can run classifiers against representative sample data before enabling them in production scans.
530
00:45:06,100 --> 00:45:13,100
This lets you measure precision and recall against ground truth you control and it lets you tune thresholds without generating noise in your life catalog.
531
00:45:13,100 --> 00:45:22,100
Organizations that skip this step often find themselves with hundreds or thousands of false positive classifications that degrade trust in the entire governance program.
532
00:45:22,100 --> 00:45:29,100
A single poorly tuned classifier can generate more alert noise than an entire team can investigate which leads to alert fatigue and ignored notifications.
533
00:45:29,100 --> 00:45:38,100
The false positive tuning technique that separates production-ready classifiers from noisy experiments is simple in concept but rarely executed well.
534
00:45:38,100 --> 00:45:43,100
You start with a narrow pilot on a single source with known content, you run the classifier and manually review every match.
535
00:45:43,100 --> 00:45:52,100
You categorize each match as true positive, false positive or ambiguous. You adjust the rule thresholds or seed content based on the patterns in the false positives.
536
00:45:52,100 --> 00:45:56,100
You rerun the test and repeat until the precision meets your acceptance criteria.
537
00:45:56,100 --> 00:46:03,100
Only then do you expand to additional sources. This iterative approach takes longer upfront but saves weeks of cleanup work later.
538
00:46:03,100 --> 00:46:09,100
Most organizations that complain about classifier noise skip this validation step and deploy directly to production.
539
00:46:09,100 --> 00:46:17,100
Classifier performance matters beyond detection accuracy because classifiers feed downstream actions like labeling, policy publication and scan driven governance workflows.
540
00:46:17,100 --> 00:46:24,100
A classifier that is technically accurate but attached to the wrong downstream policy produces weak business outcomes.
541
00:46:24,100 --> 00:46:33,100
The architecture of your classification strategy must align with your labeling strategy and your remediation workflow or you end up with perfectly classified data that nobody knows how to handle.
542
00:46:33,100 --> 00:46:43,100
If your confidential label triggers encryption that breaks a legacy reporting tool, the business will circumvent the label rather than fix the tool generating fresh shadow copies outside your governed perimeter.
543
00:46:43,100 --> 00:46:46,100
And that's exactly where most governance programs fail.
544
00:46:46,100 --> 00:46:49,100
Not in the technology but in the handoff between discovery and action.
545
00:46:49,100 --> 00:46:55,100
The deployment strategy for custom classifiers should follow a phased approach that mirrors the broader purview adoption model.
546
00:46:55,100 --> 00:47:04,100
Phase one is assessment where you inventory your sensitive data types, identify gaps in built in coverage and prioritize the categories that represent the highest business risk.
547
00:47:04,100 --> 00:47:12,100
Phase two is pilot development where you build and validate one or two classifiers for your highest priority data types using the sandbox in iterative tuning process.
548
00:47:12,100 --> 00:47:20,100
Phase three is controlled rollout where you deploy validated classifiers to a subset of production sources and monitor precision and recall for several weeks.
549
00:47:20,100 --> 00:47:29,100
Phase four is full deployment where you expand coverage across your estate and establish ongoing maintenance procedures for updating rules and retraining models as your data evolves.
550
00:47:29,100 --> 00:47:33,100
Each phase should have explicit exit criteria before progressing to the next.
551
00:47:33,100 --> 00:47:40,100
The assessment phase ends when you have a ranked list of data types and a clear mapping of which classifier type is appropriate for each.
552
00:47:40,100 --> 00:47:46,100
The pilot phase ends when your test classifier achieves at least 90% precision on representative holdout data.
553
00:47:46,100 --> 00:47:54,100
The controlled rollout phase ends when production metrics confirm that the sandbox results transfer to real world sources without significant degradation.
554
00:47:54,100 --> 00:48:02,100
These gates prevent the common failure mode of rushing to full deployment before validation is complete, which generates the noise and false confidence that undermine governance programs.
555
00:48:02,100 --> 00:48:10,100
Lineage tracking classification tells you what the data is, but lineage tells you where it came from and where it went and that's where shadow data becomes visible.
556
00:48:10,100 --> 00:48:18,100
You can classify every file in your estate, but if you don't understand how copies propagate from govern systems to unmanage locations, you're only solving half the problem.
557
00:48:18,100 --> 00:48:24,100
Data lineage is the life cycle that spans a data sets origin and its movement over time across your data state.
558
00:48:24,100 --> 00:48:30,100
It enables you to trace information from source to destination, including all transformations it undergoes during processing.
559
00:48:30,100 --> 00:48:38,100
This comprehensive map of data flows often reveals previously unknown shadow data repositories that you would never find through static scanning alone.
560
00:48:38,100 --> 00:48:48,100
The lineage graph shows not just the endpoints, but the paths between them, which is how you discover that a govern data set has spawned unauthorized copies in unexpected places.
561
00:48:48,100 --> 00:48:55,100
Microsoft purview implements lineage through a metadata collection process that connects with various data processing, storage and analytics systems.
562
00:48:55,100 --> 00:49:07,100
It extracts movement and transformation information, then combines that information to represent a generic, scenario specific lineage experience that accurately reflects data flows regardless of the underlying technology.
563
00:49:07,100 --> 00:49:21,100
The visual representation shows data moving from source to destination with transformation steps clearly marked, which provides an intuitive way for both technical and business stakeholders to understand complex flows and identify potential shadow data touch points.
564
00:49:21,100 --> 00:49:33,100
For as your data factory, the integration is mature and operates through managed identity authentication. You enable a system assigned managed identity on your ADF instance and you grant that identity the data curator role on your purview root collection.
565
00:49:33,100 --> 00:49:42,100
Once connected, ADF automatically pushes lineage metadata for each supported activity execution into purview without requiring modifications to your pipeline logic.
566
00:49:42,100 --> 00:49:54,100
The supported activities include copy activity, mapping data flow activity and execute SSIS package activity. Copy activity is the most critical scenario because it represents the majority of data movement operations in most Azure estates.
567
00:49:54,100 --> 00:50:03,100
The connection between ADF and purview can be established from either direction, from ADF you navigate to manage, then Microsoft purview, then connect to a Microsoft purview account.
568
00:50:03,100 --> 00:50:16,100
From purview, you register the ADF instance as an external connection so purview can ingest lineage. Both approaches achieve the same result, but the ADF side configuration is more common because it's typically managed by data engineering teams who own the pipelines.
569
00:50:16,100 --> 00:50:25,100
The ADF managed identity must have the data curator role on the purview root collection and both services should ideally be in the same region for performance.
570
00:50:25,100 --> 00:50:33,100
Cross region connections are supported but introduce additional latency. Lineage generally appears in purview within 5 to 15 minutes after a successful pipeline run.
571
00:50:33,100 --> 00:50:39,100
That latency is acceptable for governance and compliance use cases, but it means lineage isn't a real time monitoring tool.
572
00:50:39,100 --> 00:50:49,100
It's an operational intelligence layer. If you need immediate detection of unauthorized data movement, you supplement lineage with DLP and inside a risk management policies rather than relying on lineage alone.
573
00:50:49,100 --> 00:50:53,100
The 5 to 15 minute window is a trade off between system performance and freshness.
574
00:50:53,100 --> 00:51:02,100
Purview batch is lineage events to reduce overhead on both the ADF side and the data map ingestion pipeline. The practical integration pattern for Azure storage follows the same model.
575
00:51:02,100 --> 00:51:12,100
You scan storage accounts into purview for cataloging and metadata, then you connect the orchestration layer so pipeline executions push lineage into the data map. This hybrid approach gives you the complete view.
576
00:51:12,100 --> 00:51:16,100
The catalog shows what exists while lineage shows how data moved and changed.
577
00:51:16,100 --> 00:51:29,100
If a storage container receives data from 5 different pipelines but you only have lineage from 3, you know that the remaining 2 data sources are either manual uploads, external imports or pipeline activities that aren't yet configured for lineage capture.
578
00:51:29,100 --> 00:51:35,100
For Azure Synapse Analytics, purview captures runtime lineage from copy data and data flow activities.
579
00:51:35,100 --> 00:51:48,100
If a pipeline uses an unsupported transformation pattern or storage target, lineage may be incomplete or dropped. This means purview lineage is best understood as system generated operational lineage, not a universal reconstruction of every file level operation.
580
00:51:48,100 --> 00:51:58,100
You should test whether your specific copy patterns, data flows and parameterized pipelines appear correctly in purview because unsupported patterns can lead to gaps that create false confidence in your coverage.
581
00:51:58,100 --> 00:52:09,100
A common gap occurs when copy activities include additional columns or complex mappings which sometimes prevent purview from generating complete lineage. Power BI lineage is another important integration point.
582
00:52:09,100 --> 00:52:16,100
When Power BI data sets refresh from Azure sources, purview can capture the lineage from the underlying data source through the data set to the report.
583
00:52:16,100 --> 00:52:23,100
This is critical because business users frequently export data from Power BI reports to Excel for offline analysis which creates shadow data copies.
584
00:52:23,100 --> 00:52:34,100
When you can trace a specific Excel file back to a specific Power BI data set and from there to a specific SQL database, you have the evidence needed to demonstrate data provenance to auditors or regulators.
585
00:52:34,100 --> 00:52:52,100
Lineage information supports multiple critical use cases for shadow data management. It allows you to identify unauthorized data copies created during ETL processes, detect shadow data repositories that receive data from governed systems without proper oversight and understand how sensitive information propagates through your organization's data ecosystem.
586
00:52:52,100 --> 00:53:04,100
This capability proves especially valuable for identifying shadow data created through legitimate business processes such as when analysts create local copies of production data for reporting purposes without following proper governance procedures.
587
00:53:04,100 --> 00:53:16,100
When an analyst copies a production table to a personal workspace, lineage captures that movement. When a marketing team exports customer data to a CSV and uploads it to an unmanaged share point site, lineage records that transfer.
588
00:53:16,100 --> 00:53:29,100
When a data science team pulls training data from a governed warehouse and stores it in a personal blob container, lineage tracks that copy. These are the exact patterns that create shadow data and lineage makes them visible in ways that static inventory never could.
589
00:53:29,100 --> 00:53:41,100
The lineage graph also enables impact analysis. If you need to change a source schema or retire a legacy system, you can trace downstream dependencies to see which reports, data sets and shadow copies will be affected.
590
00:53:41,100 --> 00:53:49,100
This prevents the accidental creation of new shadow data during migrations because you can identify every location that depends on the source before you make changes.
591
00:53:49,100 --> 00:54:00,100
Without lineage, teams often create emergency copies of deprecated data sources to keep critical reports running, which generates new shadow repositories during the very migration that was supposed to reduce technical debt.
592
00:54:00,100 --> 00:54:15,100
RootCore's analysis is another critical capability. When data quality issues appear in downstream reports, lineage lets you trace the problem back through the pipeline to identify whether the error originated in a governed source or in a shadow repository that injected bad data into the flow.
593
00:54:15,100 --> 00:54:21,100
Without lineage, you waste hours or days searching for the source of a problem that lineage could identify in minutes.
594
00:54:21,100 --> 00:54:32,100
A sales report showing incorrect revenue figures might trace back to a shadow excel file that a regional manager manually edits before uploading to the official system introducing typos and outdated customer names.
595
00:54:32,100 --> 00:54:42,100
Compliance verification is the third major use case. Regulators increasingly ask not just whether you protect sensitive data, but whether you can demonstrate how that data moves through your organization.
596
00:54:42,100 --> 00:54:53,100
Lineage diagrams provide that evidence. They show the complete path from ingestion through transformation to consumption, which satisfies audit requirements for records of processing under GDPR and similar frameworks.
597
00:54:53,100 --> 00:55:04,100
When a regulator asks how personal data from a customer sign up form reaches your analytics warehouse, lineage provides the answer in a visual format that non-technical auditors can understand.
598
00:55:04,100 --> 00:55:18,100
For complex ecosystems, organizations adopt augmented lineage patterns while still using purview as the central hub. Custom connectors and scripts push lineage into purview via API for non-ADF ETL tools, on-premises systems and third-party SaaS data movers.
599
00:55:18,100 --> 00:55:24,100
Where full automation isn't possible, teams manually describe certain flows using curated assets and business glossary terms.
600
00:55:24,100 --> 00:55:34,100
This hybrid approach balances automation with targeted customization, which is necessary because no single platform can automatically capture every data movement pattern in a heterogeneous enterprise.
601
00:55:34,100 --> 00:55:41,100
A large bank might have mainframe based ETL tools that predate modern cloud platforms and these require custom lineage scripts to bridge into purview.
602
00:55:41,100 --> 00:55:47,100
Column level lineage is an emerging capability that matters for precision shadow data tracking.
603
00:55:47,100 --> 00:55:58,100
While data set level lineage tells you that a file moved from source A to destination B, column level lineage tells you that the Social Security number column in file A became the customer identifier column in file B.
604
00:55:58,100 --> 00:56:10,100
This granularity is essential for understanding exactly which sensitive data elements propagate through your pipelines because a data set might contain dozens of columns, while only one or two carry the sensitive information that creates compliance risk.
605
00:56:10,100 --> 00:56:18,100
When column level lineage is available, your impact analysis can focus remediation on the specific data elements rather than treating the entire data set as high risk.
606
00:56:18,100 --> 00:56:23,100
Purview lineage also supports data quality insights by connecting lineage paths to data quality scan results.
607
00:56:23,100 --> 00:56:33,100
When a data quality rule flags that a particular column contains anomalous values, lineage lets you trace those anomalies back to the source system or transformation step that introduced them.
608
00:56:33,100 --> 00:56:42,100
This is particularly valuable for shadow data repositories which often have lower data quality than govern systems because they bypass standard validation and cleansing processes.
609
00:56:42,100 --> 00:56:55,100
A downstream report that shows inconsistent customer names might trace back to a shadow excel file that a user manually edits before uploading, introducing typos and outdated information that contaminate the official data pipeline.
610
00:56:55,100 --> 00:57:06,100
The relationship graph lineage alone is just a map. You need to know who owns the territory. The relationship graph in purview connects disparate data points to identify hops between secure environments and unmanage shadow repositories.
611
00:57:06,100 --> 00:57:15,100
It lets you pinpoint the specific owners and applications responsible for creating unauthorized data copies. The pattern repeats in nearly every organization that has shadow data.
612
00:57:15,100 --> 00:57:23,100
Data originates in a governed production system moves to an unmanage development or testing environment then leaks to personal storage or external collaboration tools.
613
00:57:23,100 --> 00:57:34,100
Production to dev, dev to personal one drive, personal one drive to a consumer cloud storage account. Each hop takes the data further from governance and each hop creates a new shadow copy that your static inventory won't detect.
614
00:57:34,100 --> 00:57:43,100
The pattern is so predictable that you can almost diagram it from memory once you have seen it a few times. Understanding the hop pattern is essential because each hop introduces new risks.
615
00:57:43,100 --> 00:57:49,100
The production system is governed, backed up and monitored. The development environment might have relaxed access controls to make debugging easier.
616
00:57:49,100 --> 00:57:56,100
The personal one drive has no enterprise backup and no access logging. The consumer cloud account is outside your identity perimeter entirely.
617
00:57:56,100 --> 00:58:04,100
By the time data reaches the fourth hop, you have lost virtually all visibility and control yet the data might still contain the same sensitive information it had in production.
618
00:58:04,100 --> 00:58:12,100
The 3 to 5 hop rule is a practical guideline for graph visualization. Beyond 3 to 5 hops, lineage graphs become difficult to interpret and maintain at scale.
619
00:58:12,100 --> 00:58:23,100
If your data moves through more than 5 transformations or systems before reaching its final destination, you should consider breaking the lineage visualization into segments or using summary nodes to represent complex subsystems.
620
00:58:23,100 --> 00:58:29,100
This keeps the graph usable for business stakeholders while still preserving the technical detail for engineering teams.
621
00:58:29,100 --> 00:58:39,100
A summary node might represent an entire data lake or analytics platform as a single box in the high level view with the detailed internal flows available in a separate drill down diagram.
622
00:58:39,100 --> 00:58:51,100
Pinpointing responsibility is where the relationship graph delivers its greatest value. When purview discovers a shadow repository, lineage traces back through the hops to identify the application or user that created the original copy.
623
00:58:51,100 --> 00:58:56,100
A SharePoint site full of customer spreadsheets might trace back to a BI tool extract run last quarter.
624
00:58:56,100 --> 00:59:02,100
A rogue database in a dev subscription might originate from an Azure Data Factory pipeline that was never decommissioned.
625
00:59:02,100 --> 00:59:11,100
A personal one drive folder might come from a specific employee who downloaded files from a govern system. This transforms shadow data from an anonymous problem into an accountable problem.
626
00:59:11,100 --> 00:59:19,100
Instead of facing a sea of ungoverned repositories and wondering where to start, you can identify the specific system's teams and individuals that generate the most shadow data.
627
00:59:19,100 --> 00:59:26,100
You can then target your remediation efforts, training programs and policy adjustments at the sources of the problem rather than treating the symptoms.
628
00:59:26,100 --> 00:59:35,100
A department that creates 50 shadow repositories per quarter needs different intervention than a department that creates two. The graph gives you the data to make that distinction.
629
00:59:35,100 --> 00:59:44,100
Attribution also changes the conversation from blame to architecture when you can show that a specific team creates shadow copies because the official data request process takes three weeks.
630
00:59:44,100 --> 00:59:50,100
You have an architecture problem, not a people problem. The solution is to streamline the request process not to punish the team for finding a workaround.
631
00:59:50,100 --> 00:59:58,100
The relationship graph reveals the structural incentives by connecting shadow data creation to the official processes that fail to meet business needs.
632
00:59:58,100 --> 01:00:06,100
The relationship graph also reveals consolidation opportunities when you can see that three different departments each maintain separate shadow copies of the same production data set.
633
01:00:06,100 --> 01:00:11,100
You have a business case for creating a single governed data product that serves all three departments.
634
01:00:11,100 --> 01:00:23,100
Shadow data often emerges because legitimate business needs aren't met by official channels. The graph shows you where those needs are strongest, which lets you design governance improvements that reduce the incentive to create shadow copies in the first place.
635
01:00:23,100 --> 01:00:32,100
Another pattern the graph reveals is the ghost pipeline. These are data flows that were active in the past but have been abandoned, leaving behind stale copies that remain accessible.
636
01:00:32,100 --> 01:00:40,100
A quarterly reporting pipeline that copied production data to a staging area might have been replaced by a new architecture but the old staging tables were never deleted.
637
01:00:40,100 --> 01:00:46,100
The lineage graph shows the pipeline as in active while the data remains flagging these ghost repositories for cleanup.
638
01:00:46,100 --> 01:00:53,100
Ghost data is particularly dangerous because it's invisible to active monitoring while still containing sensitive information from the period when the pipeline ran.
639
01:00:53,100 --> 01:01:08,100
The relationship graph can also identify shadow data that enters your environment from external sources when a vendor sends a file to a shared mailbox which gets forwarded to a team Slack channel which gets downloaded to a local drive lineage captures that external to internal flow.
640
01:01:08,100 --> 01:01:14,100
Many organizations focus exclusively on internal data movement and miss these external injection points.
641
01:01:14,100 --> 01:01:24,100
A customer complaint form that arrives via email and gets processed through four different personal inboxes before entering the CRM is a shadow data chain that starts outside your perimeter entirely.
642
01:01:24,100 --> 01:01:28,100
This is where the graph becomes more than a diagnostic tool. It becomes a forensic instrument.
643
01:01:28,100 --> 01:01:38,100
Temporal analysis adds another dimension to the relationship graph. By examining when data copies were created relative to business events, you can identify patterns that explain why shadow data emerges.
644
01:01:38,100 --> 01:01:46,100
A spike in shadow copies after a quarterly close might indicate that finance teams are extracting data for reporting because the official process is too slow.
645
01:01:46,100 --> 01:01:55,100
A cluster of copies after a product launch might indicate that marketing teams are sharing campaign data through informal channels because the approved collaboration tools don't meet their needs.
646
01:01:55,100 --> 01:02:03,100
These temporal patterns reveal the business process failures that create shadow data which lets you design preventive measures rather than just reactive cleanup.
647
01:02:03,100 --> 01:02:15,100
The consolidation opportunities revealed by the graph often extend beyond data to include tools and processes when three departments each maintain separate shadow copies because they use three different analytics tools that can't share a common data source.
648
01:02:15,100 --> 01:02:27,100
The root problem is tool fragmentation rather than data governance. The graph shows you these tool level patterns by revealing which applications generate the most shadow copies and which departments are most affected.
649
01:02:27,100 --> 01:02:34,100
Your remediation strategy then includes both data consolidation and tool standardization which addresses the root cause rather than the symptom.
650
01:02:34,100 --> 01:02:40,100
Operationalizing. Now you can see it, you can trace it, you can name the owner. The next question is what you actually do with it.
651
01:02:40,100 --> 01:02:50,100
Discovery without action is just a more detailed description of your problems. Operationalizing means transforming discovered shadow data into governed assets through systematic repeatable processes.
652
01:02:50,100 --> 01:02:59,100
The first step is automated tagging. When purview discovers a new asset it applies classification labels based on the content analysis and custom classifiers you have configured.
653
01:02:59,100 --> 01:03:08,100
But classification alone doesn't make an asset governed. You need life cycle retention policies that define how long the asset should be kept when it should be archived and when it should be deleted.
654
01:03:08,100 --> 01:03:18,100
You need sensitivity labels that enforce encryption, access restrictions and sharing limitations. And you need business metadata that connects the asset to your glossary terms, data domains and organizational structure.
655
01:03:18,100 --> 01:03:26,100
Without these additional controls classification is merely a colored sticker on an ungoverned file. Automated tagging policies in purview have matured significantly by 2026.
656
01:03:26,100 --> 01:03:39,100
As of mid-April 2026, auto labeling in SharePoint and OneDrive can override existing sensitivity labels including manually applied ones and can remove specific labels when content no longer meets policy conditions.
657
01:03:39,100 --> 01:03:47,100
This feature applies to files at rest and isn't enabled by default which means you must explicitly configure it after validating your classification accuracy.
658
01:03:47,100 --> 01:03:58,100
The ability to downgrade or remove labels automatically is as important as the ability to apply them because data that was sensitive last year might not be sensitive today after a project closes or content is revised.
659
01:03:58,100 --> 01:04:04,100
Without automatic removal your estate accumulates incorrectly labeled files that create false confidence in your protection posture.
660
01:04:04,100 --> 01:04:09,100
Real-time alerts notify data stewards the moment a new unmanaged silo is detected by the data map.
661
01:04:09,100 --> 01:04:19,100
These alerts aren't native to purview by default so organizations typically use purview rest APIs combined with azure functions or power automate to query for new or recently updated assets.
662
01:04:19,100 --> 01:04:25,100
Evaluate each asset against required metadata rules and send notifications or create tasks for stewards.
663
01:04:25,100 --> 01:04:31,100
This automation transforms governance from a periodic audit activity into a continuous operational process.
664
01:04:31,100 --> 01:04:44,100
A typical automation pattern runs every four hours queries for assets discovered since the last run that lack descriptions owners or classifications and sends a team's message to the mapped steward group with a direct link to the asset in purview.
665
01:04:44,100 --> 01:04:58,100
The data steward role is central to this workflow. A steward in the purview context is responsible for maintaining accurate metadata ensuring business glossary terms are correctly mapped monitoring data quality, overseeing access governance and supporting compliance.
666
01:04:58,100 --> 01:05:09,100
Typical daily activities include reviewing automated classifications and correcting misclassifications weekly activities include glossary and term assignment work plus review of pending metadata or access requests.
667
01:05:09,100 --> 01:05:14,100
Monthly activities include comprehensive domain reviews of quality access compliance and user engagement.
668
01:05:14,100 --> 01:05:19,100
Stewards are the human checkpoint that prevents automation from making incorrect decisions at scale.
669
01:05:19,100 --> 01:05:31,100
The shift left model is the most effective approach for sustainable shadow data remediation. Instead of routing every discovered issue to a central security team that's already overwhelmed, you send remediation requests directly to the file owners and data creators.
670
01:05:31,100 --> 01:05:37,100
The owners understand the business context. They know whether a file is still needed, who should have access and where it should move.
671
01:05:37,100 --> 01:05:43,100
Central teams provide policy and oversight, but the actual cleanup work happens at the edge where the data was created.
672
01:05:43,100 --> 01:05:55,100
This model respects the expertise of the people who created the data while maintaining centralized accountability for policy compliance. The Data Security Trilogy agent, which entered public preview in 2026, automates this shift left workflow.
673
01:05:55,100 --> 01:06:08,100
It identifies sensitive data in SharePoint and OneDrive at scale, automatically sends remediation requests via Microsoft Teams to the last modifier of a file and provides a closed loop remediation process with visibility into progress and completion rates.
674
01:06:08,100 --> 01:06:23,100
This move's work from specialized security staff to end users through guided remediation reduces the time to remediate oversharing and misclassification issues and improves remediation rates by making the process part of the user's normal workflow rather than an external ticket system.
675
01:06:23,100 --> 01:06:32,100
A user who receives a Teams notification asking them to confirm whether a file still needs external sharing is far more likely to respond than if they receive a security ticket with no context.
676
01:06:32,100 --> 01:06:43,100
Because purview doesn't natively notify stewards when new assets or columns are discovered with missing metadata, the most effective organizations build integration pipelines using Azure Functions, Logic Apps or Power Automate.
677
01:06:43,100 --> 01:06:54,100
These pipelines query the catalog for unmanaged assets, look up the correct steward or owner based on domain mapping rules and create work items in existing ticketing systems like Azure DevOps or ServiceNow.
678
01:06:54,100 --> 01:07:00,100
This treats unmanaged asset remediation as a standard work queue with SLA-driven metrics rather than an ad hoc cleanup project.
679
01:07:00,100 --> 01:07:07,100
The integration pipeline becomes part of your operational infrastructure maintained and monitored just like any other business process automation.
680
01:07:07,100 --> 01:07:12,100
Sensitivity labels travel with data and invoke the protection rules you configure for each label.
681
01:07:12,100 --> 01:07:19,100
They can enforce encryption at rest, restrict external sharing, apply watermarks and control which AI tools can access the content.
682
01:07:19,100 --> 01:07:26,100
In the context of shadow data, this means that once an asset is discovered and labeled, the protections follow it even if it moves to another location.
683
01:07:26,100 --> 01:07:33,100
A file that's labeled confidential and encrypted can't be casually copied to a personal device and opened without the proper credentials.
684
01:07:33,100 --> 01:07:40,100
The label itself becomes a governance mechanism that operates independently of the repository where the file currently resides.
685
01:07:40,100 --> 01:07:43,100
This is the difference between protecting a location and protecting data.
686
01:07:43,100 --> 01:07:48,100
The governance lifecycle for shadow data follows a clear pattern. Discover the asset through automated scanning.
687
01:07:48,100 --> 01:07:55,100
Classify the asset using built-in and custom classifiers, label the asset with the appropriate sensitivity and retention policies.
688
01:07:55,100 --> 01:08:03,100
Monitor the asset for changes in content, access, patterns or location and finally retire the asset when it reaches the end of its business value or legal retention period.
689
01:08:03,100 --> 01:08:07,100
This lifecycle applies equally to governed assets and shadow data.
690
01:08:07,100 --> 01:08:12,100
The only difference is that shadow data enters the lifecycle at the discovery stage rather than the creation stage.
691
01:08:12,100 --> 01:08:21,100
A well-designed lifecycle prevents shadow data from accumulating by ensuring that discovered assets either get properly governed or get deleted if they have no business value.
692
01:08:21,100 --> 01:08:28,100
Metrics and key performance indicators transform this lifecycle from an abstract process into a measurable operational program.
693
01:08:28,100 --> 01:08:35,100
Effective shadow data governance programs track coverage metrics showing what percentage of discovered assets have been classified, labeled and assigned owners.
694
01:08:35,100 --> 01:08:39,100
They track remediation velocity measuring the average time from discovery to full governance.
695
01:08:39,100 --> 01:08:45,100
They track recurrence rates showing how often new shadow data appears in the same locations or from the same teams after a mediation.
696
01:08:45,100 --> 01:08:55,100
And they track risk reduction metrics like the number of overshared sensitive files, the volume of ungoverned personal information and the percentage of AI training data sets with verified provenance.
697
01:08:55,100 --> 01:09:03,100
These metrics become the language you use to communicate progress to leadership, justify ongoing investment and identify areas where the program needs adjustment.
698
01:09:03,100 --> 01:09:14,100
Steward productivity metrics are equally important. Track the number of assets reviewed per steward per week, the accuracy rate of automated classifications versus steward corrections and the time steward spend on different activity types.
699
01:09:14,100 --> 01:09:20,100
If your steward spend 80% of their time correcting false positives from a single classifier, that classifier needs tuning.
700
01:09:20,100 --> 01:09:32,100
If they spend most of their time on metadata enrichment rather than classification validation, your automation is working well and your human capacity is being used for value added work rather than mechanical verification.
701
01:09:32,100 --> 01:09:42,100
The automation pipeline itself requires operational monitoring. Track the success rate of API queries, the latency of steward notifications and the completion rate of automated remediation workflows.
702
01:09:42,100 --> 01:09:50,100
A notification system that fails silently is worse than no notification system at all because it creates false confidence that steward are being alerted when they aren't.
703
01:09:50,100 --> 01:09:58,100
Your operational dashboards should show green when the pipeline is healthy and read when any component fails with automated alerts to the platform team that maintains the integration infrastructure.
704
01:09:58,100 --> 01:10:02,100
The ROI case? None of this matters if you can't justify the investment.
705
01:10:02,100 --> 01:10:12,100
Let's look at the numbers. The Forester Total Economic Impact Study on Microsoft Perview measured a 355% return on investment over three years for a composite organization.
706
01:10:12,100 --> 01:10:17,100
The net present value was $2.3 million. The payback period was under six months.
707
01:10:17,100 --> 01:10:26,100
The composite organization achieved a 30% reduction in risky data activity and data breaches. These numbers offer per view overall not specifically for shadow data remediation.
708
01:10:26,100 --> 01:10:33,100
But the biggest drivers in the study are exactly the activities related to shadow data, discovering sensitive content that was previously invisible.
709
01:10:33,100 --> 01:10:42,100
Applying labels and access controls to that content, tightening sharing permissions on overshared files, automating remediation workflows that used to require manual investigation.
710
01:10:42,100 --> 01:10:49,100
The ROI story is largely a risk reduction and efficiency story and shadow data is the largest source of unmanaged risk in most organizations.
711
01:10:49,100 --> 01:11:04,100
To build your own ROI model, you start with a baseline assessment. Run Perview Discovery for 30 to 60 days to obtain the number of sensitive items discovered by type and label, the number of overshared or externally shared items, and the current medium time to detect and remediate issues.
712
01:11:04,100 --> 01:11:12,100
Map these items to business risk by classifying them by business unit data owner and regulatory category, then estimate the potential impact if each category were breached.
713
01:11:12,100 --> 01:11:21,100
This baseline becomes your evidence based foundation for the business case. Without it, you're asking leadership to trust projections built on assumptions rather than observations from your actual environment.
714
01:11:21,100 --> 01:11:31,100
The benefit categories break down into four areas. First, reduce breach and incident costs. Use the 30% risk reduction from the forest study as a guidepost, then adjust based on your actual environment.
715
01:11:31,100 --> 01:11:38,100
Calculate your annual expected loss before and after per view by estimating breach probability multiplied by average breach impact.
716
01:11:38,100 --> 01:11:49,100
For a mid-sized organization with a 1 in 5 annual breach probability and an average cost of 4.87 million dollars per breach, a 30% risk reduction saves approximately 2.9 million dollars per year.
717
01:11:49,100 --> 01:11:55,100
Your actual numbers will differ, but the methodology remains the same. Second, avoid regulatory and legal penalties.
718
01:11:55,100 --> 01:12:03,100
Link categories of shadow data to the regulatory regimes that govern them and estimate final voidance based on decreased likelihood of regulator relevant exposures.
719
01:12:03,100 --> 01:12:16,100
If your baseline discovers 5,000 ungoverned files containing personal information subject to GDPR and your remediation program reduces that exposure by 80% before the next audit cycle, you have a quantifiable reduction in regulatory risk.
720
01:12:16,100 --> 01:12:22,100
Convert that reduction into financial terms using the maximum fine percentages and your organization's revenue figures.
721
01:12:22,100 --> 01:12:32,100
Third, operational efficiency and staff time savings. Quantify the hours per week your analysts and compliance officers currently spend on manual discovery and cleanup, then convert those hours to cost savings using loads of money.
722
01:12:32,100 --> 01:12:47,100
If a team of 5 compliance analysts spends 30% of their time on manual data discovery and remediation and their loaded hourly rate is $125, that's approximately $480,000 annually in recoverable capacity.
723
01:12:47,100 --> 01:12:56,100
After per view automation, that same team can focus on policy design, risk analysis and strategic initiatives rather than hunting for files in unmanaged directories.
724
01:12:56,100 --> 01:13:09,100
Fourth, improve decision making and governance. Better visibility into where sensitive data lives supports cleaner data architectures, more targeted retention policies and reduced storage costs from deleting stale but sensitive data.
725
01:13:09,100 --> 01:13:16,100
Organizations often discover that 20% to 30% of their storage consumption is shadow data that has no business value and should be deleted.
726
01:13:16,100 --> 01:13:26,100
In a cloud environment where storage costs scale with usage, deleting 10 terabytes of obsolete shadow data can save tens of thousands of dollars annually in direct cloud costs alone.
727
01:13:26,100 --> 01:13:40,100
Cost components include licensing for the per view features you use, implementation and configuration effort, change management for user communications and training and ongoing operations for policy tuning and risk assessment review cycles.
728
01:13:40,100 --> 01:13:47,100
Over three year horizon, you discount these costs to net present value if you are following a total economic impact methodology.
729
01:13:47,100 --> 01:14:00,100
Licensing costs vary based on your Microsoft agreement and the specific per view capabilities you enable, data map capacity units scale with your estate size and you should include the projected growth in your cost model rather than assuming static capacity.
730
01:14:00,100 --> 01:14:08,100
Implementation costs include the initial policy design, custom classifier development, scan configuration and integration with your existing tooling.
731
01:14:08,100 --> 01:14:17,100
A typical enterprise implementation takes six to 12 weeks for the initial discovery phase, followed by three to six months of policy refinement and user adoption.
732
01:14:17,100 --> 01:14:27,100
Change management costs include training for data stewards, communications to business users about new workflows and potentially external consulting support for organizations that lack internal governance expertise.
733
01:14:27,100 --> 01:14:41,100
Ongoing operations include periodic review of classification accuracy, tuning of scans schedules based on observed load, capacity planning for data map growth and maintenance of the automation pipelines that connect per view to your ticketing and notification systems.
734
01:14:41,100 --> 01:14:50,100
These operational costs are typically 20 to 30% of the initial implementation effort per year, which is modest compared to the ongoing cost of manual governance without automation.
735
01:14:50,100 --> 01:15:00,100
At a basic level, the formula is straightforward total quantified benefits minus total quantified costs divided by total quantified costs multiplied by 100 that gives you your percentage return.
736
01:15:00,100 --> 01:15:10,100
Most organizations model multiple scenarios, a conservative scenario assumes smaller risk reduction and modest staff time savings and expected scenario aligns more closely with the forest of findings.
737
01:15:10,100 --> 01:15:24,100
An aggressive scenario assumes broad automated remediation with strong user engagement and high coverage of your data state shadow data remediation isn't just cost avoidance, its revenue protection when sales teams lose 48 hours waiting for customer information.
738
01:15:24,100 --> 01:15:31,100
That's lost revenue when product development takes 25% longer to reach market because teams can't find accurate specifications.
739
01:15:31,100 --> 01:15:37,100
That's lost revenue when mergers and acquisitions take 40% longer because data integration reveals hidden shadow repositories.
740
01:15:37,100 --> 01:15:44,100
The business case for per view is stronger when you frame it as protecting revenue streams rather than merely reducing security spending.
741
01:15:44,100 --> 01:15:51,100
Your CFO cares more about protected revenue than avoided fines and your board cares more about competitive positioning than compliance checkbox status.
742
01:15:51,100 --> 01:15:55,100
Scenario modeling is where the business case becomes specific to your organization.
743
01:15:55,100 --> 01:16:04,100
A conservative scenario might assume a 15% reduction in shadow data exposure, modest staff time savings of 10% and no significant storage cost reduction.
744
01:16:04,100 --> 01:16:11,100
This scenario still typically produces a positive return within 18 months for organizations with significant shadow data problems.
745
01:16:11,100 --> 01:16:21,100
An expected scenario aligns with the forest a composite assuming 30% risk reduction, 25% staff time savings and measurable storage cost reductions from deleting obsolete shadow data.
746
01:16:21,100 --> 01:16:30,100
An aggressive scenario assumes 50% risk reduction, full automation of routine stewardship tasks and proactive data architecture improvements that prevent new shadow data from emerging.
747
01:16:30,100 --> 01:16:39,100
The aggressive scenario requires more upfront investment in custom classifiers, integration pipelines and change management, but it produces the highest long term returns.
748
01:16:39,100 --> 01:16:42,100
Your scenario selection should reflect your organizational maturity.
749
01:16:42,100 --> 01:16:47,100
If this is your first data governance initiative, start with the conservative scenario and exceed it.
750
01:16:47,100 --> 01:16:53,100
If you have existing governance tools and processes that per view will replace or augment, the expected scenario is more realistic.
751
01:16:53,100 --> 01:17:01,100
Only pursue the aggressive scenario if you have executive sponsorship, dedicated implementation resources and a culture that adapts well to process changes.
752
01:17:01,100 --> 01:17:10,100
Overpromising and underdelivering is the fastest way to lose funding for a governance program because the benefits are invisible when they work and catastrophic when they fail.
753
01:17:10,100 --> 01:17:15,100
The intangible benefits of shadow data governance deserve mention even though they resist precise quantification.
754
01:17:15,100 --> 01:17:22,100
Improved data quality across the enterprise reduces the time analysts spend validating and correcting data before using it for decisions.
755
01:17:22,100 --> 01:17:27,100
The data discoverability increases the reuse of existing data sets rather than creating redundant copies.
756
01:17:27,100 --> 01:17:35,100
Stronger governance posture improves customer trust and can become a competitive differentiator in industries where data handling practices influence purchasing decisions.
757
01:17:35,100 --> 01:17:43,100
These benefits are real and significant, but they are best presented as supplementary to the quantified financial case rather than as substitutes for it.
758
01:17:43,100 --> 01:17:47,100
AI readiness and the future state, but the real payoff isn't a three year ROI model.
759
01:17:47,100 --> 01:17:50,100
It's what happens when your data architecture is finally ready for AI.
760
01:17:50,100 --> 01:18:02,100
Shadow data management is no longer just a security concern. It has become foundational to successful AI implementation because unmanaged shadow data introduces significant quality issues and compliance risks into training data sets.
761
01:18:02,100 --> 01:18:09,100
Every ungoverned data set your teams use for model training introduces potential compliance risks you can't audit.
762
01:18:09,100 --> 01:18:18,100
A training data set that contains personally identifiable information copied to a shadow repository without proper consent or anonymization passes that liability straight to your AI model.
763
01:18:18,100 --> 01:18:24,100
A training data set that includes biased or inaccurate information from an unmanaged source infects your model with that same bias.
764
01:18:24,100 --> 01:18:32,100
A training data set that moves through five undocumented hops before reaching your data science platform leaves you unable to explain its provenance to regulators or customers.
765
01:18:32,100 --> 01:18:40,100
The model you deploy reflects the data you feed it and shadow data is often the lowest quality least verified data in your organization.
766
01:18:40,100 --> 01:18:47,100
The EU AI act introduces additional data governance requirements specifically targeting training data for artificial intelligence systems.
767
01:18:47,100 --> 01:18:57,100
It requires organizations to maintain records of the data used to train high risk AI systems including information about the origin collection methods and pre-processing of that data.
768
01:18:57,100 --> 01:19:05,100
Shadow data makes these requirements nearly impossible to satisfy because by definition you don't have records for data that lives outside your governance framework.
769
01:19:05,100 --> 01:19:14,100
A regulator asking for the provenance of your loan approval model can't accept we aren't sure where the training data came from as an answer yet that's exactly the position shadow data creates.
770
01:19:14,100 --> 01:19:25,100
Pervue governance feeds trustworthy AI data registries by providing the discovery classification lineage and quality context that AI development teams need to select appropriate data sets.
771
01:19:25,100 --> 01:19:37,100
When a data scientist searches for training data the Pervue catalog shows them which data sets are available how they are classified where they came from and whether they meet the compliance requirements for their intended use case.
772
01:19:37,100 --> 01:19:44,100
This prevents the common pattern where data scientists create shadow copies of production data because they can't find or trust the official sources.
773
01:19:44,100 --> 01:19:55,100
A data scientist who can search the catalog filter for data sets labeled as anonymized and approved for model training and verify the lineage back to the original source won't waste hours creating unauthorized copies.
774
01:19:55,100 --> 01:20:06,100
The data security triage agent and automated remediation loops that are maturing in 2026 represent the next phase of this evolution instead of requiring human investigators to manually trace and remediate every shadow data.
775
01:20:06,100 --> 01:20:14,100
The system identifies the problem, notifies the owner, tracks the resolution and updates the catalog automatically.
776
01:20:14,100 --> 01:20:22,100
This closed loop approach scales governance in ways that manual processes never could and it's essential for organizations that are deploying AI at enterprise scale.
777
01:20:22,100 --> 01:20:30,100
Manual governance processes that work for 100 data assets break down completely at 10,000 assets which is the scale that AI initiatives typically require.
778
01:20:30,100 --> 01:20:42,100
Fabric integration extends this governance model to end to end AI pipelines when your data flows from Azure Data Lake storage through Synapse transformations into Power BI reports and ultimately into Azure machine learning training jobs.
779
01:20:42,100 --> 01:20:54,100
Per view captures the complete lineage across that chain. This gives you a single view of how data moves from raw ingestion through transformation through consumption through model training which is the level of traceability that responsible AI frameworks require.
780
01:20:54,100 --> 01:21:04,100
When a business user questions a model prediction, you can trace the data that influence that prediction back through every intermediate step to its original source demonstrating both accuracy and compliance.
781
01:21:04,100 --> 01:21:10,100
Microsoft 365 co-pilot governance is another emerging requirement that ties directly to shadow data.
782
01:21:10,100 --> 01:21:13,100
Co-pilot can only access data that your permissions and labels allow it to see.
783
01:21:13,100 --> 01:21:26,100
If shadow data exists in unmanaged sharepoint sites or one-drive folders without proper labels, co-pilot might ingest that data into its training or retrieval processes creating compliance risks that are invisible until they surface in generated content.
784
01:21:26,100 --> 01:21:35,100
Per view labels control which data co-pilot can access and per view discovery ensures that unmanaged data doesn't escape these controls by hiding in unlabeled repositories.
785
01:21:35,100 --> 01:21:49,100
The strategic shift is from defensive compliance to offensive data architecture. Organizations that solve shadow data first will have a structural advantage. Their AI initiatives will move faster because their data scientists will spend less time hunting for data and more time building models.
786
01:21:49,100 --> 01:21:54,100
Their compliance audits will cost less because they will have automated evidence of data provenance.
787
01:21:54,100 --> 01:22:00,100
Their breach risk will be lower because they will have eliminated the invisible repositories that attack is preferred to target.
788
01:22:00,100 --> 01:22:07,100
The organizations that delay will discover their blind spots through regulatory fines, failed AI deployments or security incidents.
789
01:22:07,100 --> 01:22:19,100
Looking ahead, the convergence of data governance and AI governance will only accelerate. As AI systems become more deeply embedded in business processes, the quality and provenance of training data becomes a competitive differentiator.
790
01:22:19,100 --> 01:22:31,100
Organizations with clean, well-documented, governed data estates will build more reliable models, pass regulatory scrutiny more easily and adapt to new AI regulations faster than competitors who are still cleaning up shadow data.
791
01:22:31,100 --> 01:22:41,100
The investment you make in Per view today isn't just a security investment. It's an AI readiness investment that pays dividends across every AI initiative your organization launches over the next decade.
792
01:22:41,100 --> 01:22:51,100
Time line for achieving AI ready governance varies by organization size and complexity, but a realistic enterprise roadmap spans 12 to 18 months for full implementation.
793
01:22:51,100 --> 01:22:59,100
Months 1 through 3 focus on discovery and baseline establishment, running Per view scans across your highest risk data sources and building the initial classification taxonomy.
794
01:22:59,100 --> 01:23:07,100
Months 4 through 6 focus on custom classifier development and validation ensuring that your automated classification accurately reflects your sensitive data types.
795
01:23:07,100 --> 01:23:17,100
Months 7 through 12 focus on lineage integration and operational workflow automation, connecting the major data movement patterns and establishing the Stuart notification and remediation pipelines.
796
01:23:17,100 --> 01:23:27,100
Months 13 through 18 focus on optimization and expansion, tuning thresholds based on production metrics and extending coverage to additional business units and data sources.
797
01:23:27,100 --> 01:23:37,100
Each phase of this roadmap should deliver measurable value that justifies the next phase. The discovery phase should produce a report showing the volume and location of shadow data that leadership didn't know existed.
798
01:23:37,100 --> 01:23:48,100
The classification phase should demonstrate automated labeling accuracy that reduces manual review effort. The lineage phase should reveal data movement patterns that explain previously unexplained data quality issues.
799
01:23:48,100 --> 01:24:01,100
The optimization phase should show improving KPIs for coverage, remediation, velocity and risk reduction. These incremental deliverables maintain momentum and funding for a program that might otherwise lose executive attention after the initial excitement fades.
800
01:24:01,100 --> 01:24:06,100
ShadowDiter isn't a security problem to be locked down. It's a structural visibility problem to be mapped.
801
01:24:06,100 --> 01:24:14,100
And Microsoft Per view data map provides the architectural foundation for transforming invisible liabilities into governed assets without disrupting production.
802
01:24:14,100 --> 01:24:24,100
The organizations that master this first will operate with a structural advantage that compounds over time. If this changed how you think about data governance, follow me, Mirko Peters, on LinkedIn.

Founder of m365.fm, m365.show and m365con.net
Mirko Peters is a Microsoft 365 expert, content creator, and founder of m365.fm, a platform dedicated to sharing practical insights on modern workplace technologies. His work focuses on Microsoft 365 governance, security, collaboration, and real-world implementation strategies.
Through his podcast and written content, Mirko provides hands-on guidance for IT professionals, architects, and business leaders navigating the complexities of Microsoft 365. He is known for translating complex topics into clear, actionable advice, often highlighting common mistakes and overlooked risks in real-world environments.
With a strong emphasis on community contribution and knowledge sharing, Mirko is actively building a platform that connects experts, shares experiences, and helps organizations get the most out of their Microsoft 365 investments.