


 Apple Podcasts
 Spotify
 Youtube Music
 Spreaker
 Podchaser
 Amazon Music
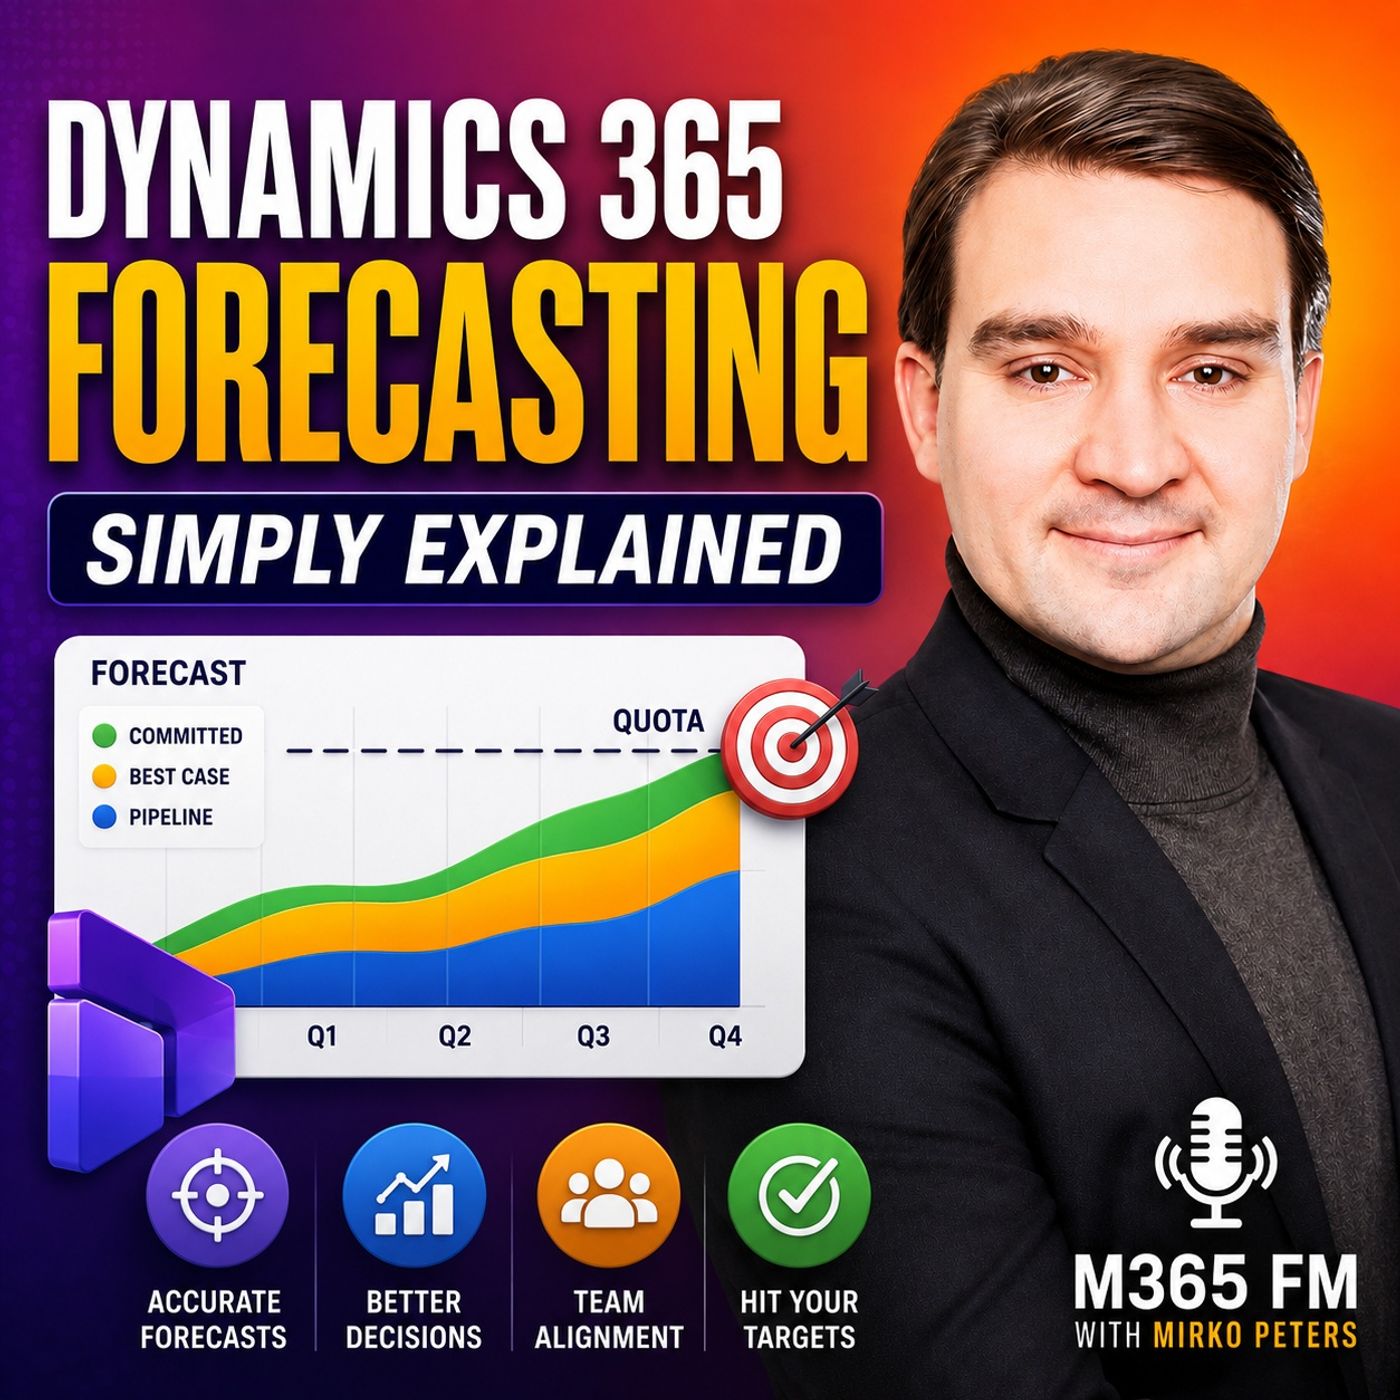
 Dynamics 365 Forecasting - Simply Explained
Key Takeaways
- Dynamics 365 Forecasting turns open sales opportunities into a shared, real-time view of expected revenue, confidence, and pipeline risk.
- Replacing scattered spreadsheets with Dynamics 365 Sales ensures everyone across the organization works from the exact same underlying deal data.
- Forecast categories like Pipeline, Best Case, Committed, and Omitted provide a common language to measure the confidence behind every opportunity.
- Role-based views and hierarchy rollups empower individual sellers, managers, and leadership to make data-driven decisions at every level of the organization.
- Accurate revenue forecasting fundamentally depends on consistent data hygiene, requiring sellers to keep opportunity amounts and close dates current.
Dynamics 365 Forecasting helps sales teams answer one of the most important questions in business: are we going to hit our sales target? Instead of collecting numbers from spreadsheets, emails, and individual sales reports, Dynamics 365 Sales brings opportunities, expected revenue, close dates, forecast categories, quotas, and sales performance into one shared forecasting view. In this episode of M365 FM, Mirko Peters explains how Dynamics 365 Forecasting works, how forecast categories represent confidence, and why accurate opportunity data is essential for reliable revenue forecasting.
ㅤ
WHAT IS DYNAMICS 365 FORECASTING?
ㅤ
Dynamics 365 Forecasting turns the opportunities your sales team already manages in Dynamics 365 Sales into a structured view of expected revenue. A sales forecast isn't a guarantee of future revenue. It's a continuously changing estimate based on what the sales organization currently knows about its open opportunities.
The forecast combines important information including expected deal value, expected close dates, sales quotas, ownership, and confidence. This allows sellers and sales managers to understand not only how much potential revenue exists, but how realistic that revenue is for the current forecasting period.
ㅤ
FROM SPREADSHEETS TO A SHARED SALES FORECAST
ㅤ
Traditional forecasting often depends on individual spreadsheets that sellers update at different times. Managers then collect those files, consolidate the numbers, and try to determine which version contains the latest information.
Dynamics 365 Sales changes this process by building forecasts from opportunity data already maintained by the sales organization. Instead of creating another reporting process, forecasting becomes part of everyday sales management. Everyone can work from the same underlying opportunity information.
ㅤ
UNDERSTANDING THE FORECAST GRID
ㅤ
The Dynamics 365 forecast grid acts like a shared sales scorecard. Depending on how forecasting is configured, rows can represent individual sellers, teams, territories, or products. Columns can show quota, forecast amounts, and different levels of forecast confidence.
Managers can move beyond headline revenue numbers and drill into the opportunities behind those totals. This makes forecast conversations more practical because teams can discuss specific deals, changes in close dates, customer decisions, and pipeline risks instead of debating spreadsheet numbers.
ㅤ
FORECAST CATEGORIES EXPLAINED
ㅤ
Forecast categories provide a common language for describing the confidence behind each opportunity. Pipeline represents opportunities that are still relatively early or uncertain. Best Case represents opportunities showing meaningful progress but which are not yet reliable enough to treat as expected revenue.
Committed represents opportunities where the customer has provided a strong verbal or contractual commitment, although the sale has not officially closed. Omitted removes an opportunity from forecast totals without deleting the opportunity from Dynamics 365 Sales.
Won and Lost are handled differently. When opportunities are formally closed, Dynamics 365 updates their final status accordingly. Together, these categories allow teams to see the difference between potential revenue, realistic upside, and high-confidence opportunities.
ㅤ
FORECASTING FOR SELLERS AND SALES MANAGERS
ㅤ
Different roles can use the same forecasting data for different decisions. Individual sellers can compare their current forecast against quota and identify where they need to focus their attention. A seller who has a large gap between expected revenue and target can determine whether existing opportunities need attention or whether additional pipeline must be created.
Sales managers can view the entire team and then drill into individual sellers and opportunities. This makes coaching more specific. Instead of simply asking why someone's forecast is low, managers can discuss actual opportunities, customer activity, delayed close dates, missing proposals, and the next actions required to move deals forward.
ㅤ
FORECAST HIERARCHIES AND ROLLUPS
ㅤ
Dynamics 365 Forecasting can aggregate opportunity information through different organizational structures. An organizational hierarchy can follow reporting relationships, while territory-based forecasts can organize revenue around geographic or assigned markets. Product forecasts can show expected revenue based on what the company sells.
These rollups allow sellers, managers, directors, and leadership to work from connected sales data while viewing the information at the level appropriate to their responsibilities.
ㅤ
AI AND SALES FORECASTING
ㅤ
AI can provide additional signals around sales opportunities, but it doesn't know exactly which customers will buy. Opportunity scoring and related sales intelligence can analyze patterns such as customer interactions, meetings, emails, sales stages, opportunity values, and previous sales activity.
These signals can help sellers and managers identify opportunities that may require attention. A low score should therefore be treated as another piece of information rather than a final decision about whether an opportunity will close.
ㅤ
WHY DATA QUALITY MATTERS
ㅤ
Even sophisticated forecasting technology cannot compensate for inaccurate sales data. If an opportunity has an outdated close date, incorrect expected revenue, or an unrealistic forecast category, those errors can flow directly into the forecast.
Sellers should keep opportunity amounts, expected close dates, ownership, and forecast categories current whenever the customer situation changes. Accurate forecasting starts with accurate opportunity management.
ㅤ
HUMAN JUDGMENT STILL MATTERS
ㅤ
Sales data cannot capture every detail of a customer relationship. Budget changes, competitors, internal customer reorganizations, new decision makers, delayed projects, and changing priorities can dramatically affect an opportunity.
The strongest forecasting process combines structured Dynamics 365 data with the knowledge of the people actually speaking with customers. Managers can use forecast reviews to understand what changed, challenge assumptions, and determine whether opportunities still belong in their current forecast categories.
ㅤ
BUILDING A RELIABLE FORECASTING RHYTHM
ㅤ
Reliable forecasting depends on regular updates rather than a last-minute cleanup before a leadership meeting. Sellers should review open opportunities throughout the week and update values, expected close dates, ownership, and forecast categories when circumstances change.
Forecast reviews can then focus on meaningful questions: Which deals moved forward? Which opportunities slipped? Where is revenue at risk? Is there enough pipeline to reach quota? Which opportunities need immediate attention?
This turns forecasting from a reporting exercise into an active sales management process.
ㅤ
THE KEY TAKEAWAY
ㅤ
Dynamics 365 Forecasting transforms everyday sales opportunity data into a shared view of expected revenue, confidence, quota performance, and pipeline risk. Sellers can understand where to focus their effort, managers can identify problems earlier, and leadership gains a clearer picture of expected business performance.
But the quality of the forecast ultimately depends on the quality of the information behind it. Keep opportunity data accurate, use forecast categories consistently, and combine the numbers with human judgment. That's when Dynamics 365 Forecasting becomes a practical tool for sales planning rather than another report.
Subscribe to M365 FM for more Microsoft Knowledge Nuggets and Simply Explained episodes covering Dynamics 365, Microsoft 365, Power Platform, Azure, Copilot, AI, security, governance, and the Microsoft ecosystem.
Become a supporter of this podcast: https://www.spreaker.com/podcast/m365-fm-modern-work-security-and-productivity-with-microsoft-365--6704921/support.
🚀 Want to be part of m365.fm?
Then stop just listening… and start showing up.
👉 Connect with me on LinkedIn and let’s make something happen:
- 🎙️ Be a podcast guest and share your story
- 🎧 Host your own episode (yes, seriously)
- 💡 Pitch topics the community actually wants to hear
- 🌍 Build your personal brand in the Microsoft 365 space
This isn’t just a podcast — it’s a platform for people who take action.
🔥 Most people wait. The best ones don’t.
👉 Connect with me on LinkedIn and send me a message:
"I want in"
Let’s build something awesome 👊
Frequently Asked Questions
What is Dynamics 365 Forecasting?
Dynamics 365 Forecasting is a sales management feature that aggregates open opportunities, expected revenue, close dates, and sales quotas into a single shared view. It provides organizations with a continuously changing estimate of future sales performance rather than relying on static spreadsheets.
What do forecast categories mean in Dynamics 365 Sales?
Forecast categories represent the confidence level behind each sales opportunity. Standard categories include Pipeline for early deals, Best Case for progressing opportunities, Committed for high-confidence deals awaiting signature, and Omitted to remove deals from revenue totals.
How do sales managers use Dynamics 365 Forecasting?
Sales managers use the forecast grid to view team-wide revenue performance against quotas and easily drill down into individual seller opportunities. This enables targeted coaching conversations focused on specific deal risks, close dates, and pipeline health.
Why is data quality important for sales forecasting?
Even advanced forecasting tools rely on accurate input data to generate reliable revenue projections. Outdated close dates, incorrect opportunity values, or mislabeled forecast categories will directly distort the forecast and lead to poor strategic decisions.
00:00:00,000 --> 00:00:02,280
Imagine a sales leader asks their team,
2
00:00:02,280 --> 00:00:04,160
"Are we going to hit the number this quarter?"
3
00:00:04,160 --> 00:00:06,160
A manager needs an answer and a seller wants to know
4
00:00:06,160 --> 00:00:07,860
which deal to focus on first.
5
00:00:07,860 --> 00:00:09,720
But too often, that answer is scattered
6
00:00:09,720 --> 00:00:12,660
across separate spreadsheets, old email attachments,
7
00:00:12,660 --> 00:00:14,560
and a hopeful guess from Friday's sales call.
8
00:00:14,560 --> 00:00:17,360
I'm Mirko Peters from M365, FFM,
9
00:00:17,360 --> 00:00:19,600
and this knowledge nugget puts that into plain English,
10
00:00:19,600 --> 00:00:21,120
Dynamics 365.
11
00:00:21,120 --> 00:00:24,120
Forecasting gives your team one shared view
12
00:00:24,120 --> 00:00:27,040
of expected revenue, how confident people feel about it,
13
00:00:27,040 --> 00:00:28,240
and where the risks sit,
14
00:00:28,240 --> 00:00:30,000
think of it like a whiteboard in the sales office
15
00:00:30,000 --> 00:00:31,960
where every open deal adds to the picture.
16
00:00:31,960 --> 00:00:33,000
Before we look at the tool,
17
00:00:33,000 --> 00:00:35,480
let's get clear on what a forecast actually means.
18
00:00:35,480 --> 00:00:37,920
Herkud, "What a sales forecast actually is."
19
00:00:37,920 --> 00:00:39,560
Will your team hit its number this quarter?
20
00:00:39,560 --> 00:00:42,360
That's the question behind almost every sales forecast.
21
00:00:42,360 --> 00:00:44,280
But a forecast isn't a promise carved into stone,
22
00:00:44,280 --> 00:00:45,960
"Oh, it's a working estimate
23
00:00:45,960 --> 00:00:48,800
that changes as customers respond, deals move forward,
24
00:00:48,800 --> 00:00:50,320
and dates slip."
25
00:00:50,320 --> 00:00:52,360
Think of the target, often called quota,
26
00:00:52,360 --> 00:00:54,960
as the line your sales team aims to cross.
27
00:00:54,960 --> 00:00:57,080
The forecast shows the path toward that line
28
00:00:57,080 --> 00:00:59,120
based on what the team knows right now.
29
00:00:59,120 --> 00:01:01,720
That difference matters because a quota tells a seller
30
00:01:01,720 --> 00:01:04,080
to bring in $100,000 this quarter.
31
00:01:04,080 --> 00:01:06,560
But the forecast tells them whether their current open deals
32
00:01:06,560 --> 00:01:08,600
offer a realistic root to that number
33
00:01:08,600 --> 00:01:11,280
or whether the pipeline needs more opportunities.
34
00:01:11,280 --> 00:01:13,800
A useful sales forecast starts with open deals.
35
00:01:13,800 --> 00:01:16,200
An open deal is a possible sale that hasn't closed yet,
36
00:01:16,200 --> 00:01:18,280
oh, a company looking at your software,
37
00:01:18,280 --> 00:01:20,080
a customer asking for a proposal,
38
00:01:20,080 --> 00:01:22,280
or a buyer waiting for final approval.
39
00:01:22,280 --> 00:01:25,240
In Dynamics 365 sales, we call these opportunities,
40
00:01:25,240 --> 00:01:28,200
and each one holds the details that feed the forecast.
41
00:01:28,200 --> 00:01:29,480
You need an expected amount.
42
00:01:29,480 --> 00:01:32,560
If a customer might buy services worth $20,000,
43
00:01:32,560 --> 00:01:34,600
that amount goes on the opportunity.
44
00:01:34,600 --> 00:01:36,800
Without it, the forecast can't show how much revenue
45
00:01:36,800 --> 00:01:38,000
the deal could bring in.
46
00:01:38,000 --> 00:01:39,800
You also need an expected close date.
47
00:01:39,800 --> 00:01:41,240
A deal might seem promising,
48
00:01:41,240 --> 00:01:43,200
but if it won't close until next quarter,
49
00:01:43,200 --> 00:01:45,160
it shouldn't count in this quarter's forecast.
50
00:01:45,160 --> 00:01:47,760
That's how dates keep the team from counting the same deal
51
00:01:47,760 --> 00:01:50,360
in the wrong period just because everyone wants it to close sooner.
52
00:01:50,360 --> 00:01:51,440
Then there's confidence.
53
00:01:51,440 --> 00:01:53,280
Not every open deal deserves the same weight
54
00:01:53,280 --> 00:01:55,240
in a revenue conversation over you.
55
00:01:55,240 --> 00:01:57,840
A first call with a potential customer feels very different
56
00:01:57,840 --> 00:01:59,560
from a buyer who has agreed to the price
57
00:01:59,560 --> 00:02:01,480
and is just waiting for paperwork.
58
00:02:01,480 --> 00:02:03,040
Forecasting captures that difference
59
00:02:03,040 --> 00:02:05,080
with confidence categories, which we'll get into shortly.
60
00:02:05,080 --> 00:02:08,080
So a sales forecast brings together four simple pieces.
61
00:02:08,080 --> 00:02:10,200
The open deal, the expected amount,
62
00:02:10,200 --> 00:02:11,760
the expected close date,
63
00:02:11,760 --> 00:02:14,000
and the team's confidence that it will close.
64
00:02:14,000 --> 00:02:15,480
Think of them as the building blocks.
65
00:02:15,480 --> 00:02:17,880
Imagine a seller named Alex with three deals.
66
00:02:17,880 --> 00:02:19,240
The first deal is a new conversation
67
00:02:19,240 --> 00:02:21,920
with Northwind traders worth $10,000.
68
00:02:21,920 --> 00:02:23,360
Alex knows the customer has a problem,
69
00:02:23,360 --> 00:02:24,640
but they haven't seen a proposal yet,
70
00:02:24,640 --> 00:02:26,920
so that deal sits in the early part of the forecast.
71
00:02:26,920 --> 00:02:29,920
The second deal is with Contoso worth $30,000.
72
00:02:29,920 --> 00:02:32,520
Alex has met the buyer twice, shared pricing,
73
00:02:32,520 --> 00:02:34,480
and answered technical questions, oh,
74
00:02:34,480 --> 00:02:35,560
it could close this quarter,
75
00:02:35,560 --> 00:02:37,760
but the customer is still shopping around.
76
00:02:37,760 --> 00:02:39,880
The third deal is worth $50,000,
77
00:02:39,880 --> 00:02:41,760
and the customer has agreed to buy.
78
00:02:41,760 --> 00:02:43,440
Alex is just waiting for the final signature,
79
00:02:43,440 --> 00:02:45,400
so that one carries much more confidence,
80
00:02:45,400 --> 00:02:47,920
even though it's not revenue until the sale closes.
81
00:02:47,920 --> 00:02:49,720
Alex can look at those three opportunities
82
00:02:49,720 --> 00:02:52,480
and see more than a total of $90,000.
83
00:02:52,480 --> 00:02:55,080
But the forecast shows the shape of that money,
84
00:02:55,080 --> 00:02:56,920
some of it looks early, some could happen,
85
00:02:56,920 --> 00:02:58,080
and some looks close.
86
00:02:58,080 --> 00:03:00,240
That helps Alex decide whether to chase a new deal,
87
00:03:00,240 --> 00:03:02,080
help Contoso resolve a concern,
88
00:03:02,080 --> 00:03:05,720
or make sure the paperwork for the $50,000 sale doesn't stall.
89
00:03:05,720 --> 00:03:08,280
When sellers keep these opportunity records current,
90
00:03:08,280 --> 00:03:10,440
the forecast becomes a near real-time view
91
00:03:10,440 --> 00:03:12,200
of the sales team's current position.
92
00:03:12,200 --> 00:03:13,800
It won't predict the future perfectly,
93
00:03:13,800 --> 00:03:16,800
because customers can change their minds, budgets can disappear,
94
00:03:16,800 --> 00:03:19,080
and approvals can take longer than anyone expected.
95
00:03:19,080 --> 00:03:21,080
But it gives everyone the same starting point
96
00:03:21,080 --> 00:03:23,560
for a useful conversation.
97
00:03:23,560 --> 00:03:26,120
From spreadsheets to a shared forecast board,
98
00:03:26,120 --> 00:03:28,200
let me paint you a picture of the old way.
99
00:03:28,200 --> 00:03:30,320
Every salesperson keeps their own spreadsheet,
100
00:03:30,320 --> 00:03:32,800
one updates theirs on Monday, another changes a number
101
00:03:32,800 --> 00:03:34,520
after a phone call on Thursday.
102
00:03:34,520 --> 00:03:36,480
Then the manager rounds them up, copies everything
103
00:03:36,480 --> 00:03:39,840
into one master file, and tries to explain the total in a meeting.
104
00:03:39,840 --> 00:03:41,440
By the time that total reaches leadership,
105
00:03:41,440 --> 00:03:43,120
somebody out missed deal has already slipped
106
00:03:43,120 --> 00:03:44,920
another seller added a new opportunity,
107
00:03:44,920 --> 00:03:46,520
and one of those spreadsheets might not even
108
00:03:46,520 --> 00:03:48,760
be the latest version.
109
00:03:48,760 --> 00:03:50,640
That would miss the real problem with forecasting
110
00:03:50,640 --> 00:03:51,720
through attachments.
111
00:03:51,720 --> 00:03:53,720
It's how Tim's not just that the numbers live
112
00:03:53,720 --> 00:03:56,720
in different places, and people also use different definitions.
113
00:03:56,720 --> 00:03:59,600
One seller counts a deal the moment they have the first meeting.
114
00:03:59,600 --> 00:04:01,760
Another waits until they send a quote.
115
00:04:01,760 --> 00:04:03,880
Meanwhile, a manager might know the customer
116
00:04:03,880 --> 00:04:06,080
paused their buying process, but the spreadsheet
117
00:04:06,080 --> 00:04:07,560
still shows the full amount.
118
00:04:07,560 --> 00:04:09,360
Nobody sets out to create confusion.
119
00:04:09,360 --> 00:04:11,720
But when the whole process depends on separate files
120
00:04:11,720 --> 00:04:14,680
and manual updates, the forecast gets stalefast.
121
00:04:14,680 --> 00:04:17,920
You also lose visibility into who owns each number,
122
00:04:17,920 --> 00:04:20,280
what UTM deets actually behind it,
123
00:04:20,280 --> 00:04:23,280
and whether the total change because a deal moved forward
124
00:04:23,280 --> 00:04:26,640
or because somebody accidentally overwrote a sell.
125
00:04:26,640 --> 00:04:29,680
Dynamics 365 sales changes where the forecast starts.
126
00:04:29,680 --> 00:04:32,400
Instead of asking people to build a separate report from scratch,
127
00:04:32,400 --> 00:04:34,680
it uses the opportunity records the sales team
128
00:04:34,680 --> 00:04:36,800
already updates during their daily work.
129
00:04:36,800 --> 00:04:39,480
The amount, owner, close date, and all those deal details
130
00:04:39,480 --> 00:04:41,040
live in one connected platform.
131
00:04:41,040 --> 00:04:43,360
So the forecast does know and requires someone
132
00:04:43,360 --> 00:04:45,480
to gather 10 files before a meeting.
133
00:04:45,480 --> 00:04:48,440
It can pull together the sales data the team has already recorded.
134
00:04:48,440 --> 00:04:50,200
That means everyone starts the conversation
135
00:04:50,200 --> 00:04:51,360
with the same information.
136
00:04:51,360 --> 00:04:53,720
Sure, people still need to keep their opportunities current,
137
00:04:53,720 --> 00:04:55,520
but the system eliminates the copy and paste
138
00:04:55,520 --> 00:04:58,200
step that usually sits between a seller and their manager.
139
00:04:58,200 --> 00:05:00,240
The main view is called a forecast grid.
140
00:05:00,240 --> 00:05:01,800
Think of it as a shared scorecard,
141
00:05:01,800 --> 00:05:04,280
I/O, not another spreadsheet buried in someone A-B-O,
142
00:05:04,280 --> 00:05:06,080
T-M as personal folder.
143
00:05:06,080 --> 00:05:08,440
The rows can show individual sellers, teams, products,
144
00:05:08,440 --> 00:05:09,960
or sales territories depending on how
145
00:05:09,960 --> 00:05:12,040
the business wants to look at its pipeline.
146
00:05:12,040 --> 00:05:15,080
Across those rows, columns display things like quota
147
00:05:15,080 --> 00:05:16,880
and forecast amounts for the period.
148
00:05:16,880 --> 00:05:18,720
A seller can see their own row and compare
149
00:05:18,720 --> 00:05:20,680
their current picture against their target.
150
00:05:20,680 --> 00:05:22,400
A sales manager sees the team total,
151
00:05:22,400 --> 00:05:25,320
then scans down the page to find where a gap starts.
152
00:05:25,320 --> 00:05:27,920
If one territory looks weak while another is strong,
153
00:05:27,920 --> 00:05:29,600
that difference shows up in the same view
154
00:05:29,600 --> 00:05:31,400
instead of hiding in two separate reports.
155
00:05:31,400 --> 00:05:33,760
The total matters, but the details matter just as much.
156
00:05:33,760 --> 00:05:36,920
Say a manager sees the team expects $200,000 this month.
157
00:05:36,920 --> 00:05:39,320
That number alone does know, to me tell you much.
158
00:05:39,320 --> 00:05:40,720
Is it built on a few big deals?
159
00:05:40,720 --> 00:05:42,720
Is one seller carrying most of the weight?
160
00:05:42,720 --> 00:05:45,280
Did a major opportunity slide to a later date?
161
00:05:45,280 --> 00:05:48,360
With a forecast grid, the manager can drill into that total
162
00:05:48,360 --> 00:05:50,400
and open the actual opportunities behind it.
163
00:05:50,400 --> 00:05:52,280
Now the conversation changes completely.
164
00:05:52,280 --> 00:05:54,800
Instead of asking, oh, why does your number look low?
165
00:05:54,800 --> 00:05:57,040
A manager can say, oh, this customer deal
166
00:05:57,040 --> 00:05:58,280
moved out of the month.
167
00:05:58,280 --> 00:05:59,040
What changed?
168
00:05:59,040 --> 00:06:00,200
And what can we do next?
169
00:06:00,200 --> 00:06:02,520
A-O's at tower teams are much better sales conversation
170
00:06:02,520 --> 00:06:04,520
because it starts with a real customer situation,
171
00:06:04,520 --> 00:06:06,840
not a mystery hidden in a spreadsheet cell.
172
00:06:06,840 --> 00:06:09,640
Regular forecast reviews keep that shared view useful.
173
00:06:09,640 --> 00:06:11,880
The team checks what changed since the last review,
174
00:06:11,880 --> 00:06:13,520
looks at the deals that need attention
175
00:06:13,520 --> 00:06:16,160
and updates the records while the details are still fresh.
176
00:06:16,160 --> 00:06:19,160
The forecast becomes part of how the team plans its work,
177
00:06:19,160 --> 00:06:21,240
not a report everyone rushes to prepare
178
00:06:21,240 --> 00:06:23,040
when leadership asks for an answer.
179
00:06:23,040 --> 00:06:25,600
One shared board does know to remove uncertainty,
180
00:06:25,600 --> 00:06:27,880
but it does remove the argument over which attachment
181
00:06:27,880 --> 00:06:29,200
has the right number.
182
00:06:29,200 --> 00:06:31,560
Next, we need to look at the labels that decide
183
00:06:31,560 --> 00:06:34,520
where each opportunity appears on that board.
184
00:06:34,520 --> 00:06:37,440
Forecast categories, the confidence ladder.
185
00:06:37,440 --> 00:06:39,880
The forecast grid needs more than amounts and dates.
186
00:06:39,880 --> 00:06:41,880
It also needs a simple answer to one question.
187
00:06:41,880 --> 00:06:43,800
How likely is this deal right now?
188
00:06:43,800 --> 00:06:47,320
Dynamics 365 sales uses forecast categories for that job.
189
00:06:47,320 --> 00:06:50,520
A category is a label on an opportunity that tells the system,
190
00:06:50,520 --> 00:06:52,600
which forecast column should include its amount.
191
00:06:52,600 --> 00:06:54,560
It also tells the team how much confidence
192
00:06:54,560 --> 00:06:56,320
to place in that amount during a review.
193
00:06:56,320 --> 00:06:57,960
This is now tempt about pretending
194
00:06:57,960 --> 00:07:00,800
every customer decision fits neatly into a box.
195
00:07:00,800 --> 00:07:03,560
It gives sellers a common language, so, oh, looking good,
196
00:07:03,560 --> 00:07:06,280
oh, means more than a vague feeling after a call.
197
00:07:06,280 --> 00:07:08,160
When one seller marks a deal is committed,
198
00:07:08,160 --> 00:07:10,720
everyone should understand exactly what that label means.
199
00:07:10,720 --> 00:07:12,160
The first category is pipeline.
200
00:07:12,160 --> 00:07:14,400
Pipeline is the default for any new opportunity.
201
00:07:14,400 --> 00:07:17,240
It fits deals that are early, unclear, or not moving much yet.
202
00:07:17,240 --> 00:07:20,440
Maybe you ooo, Tim, who found a real customer need.
203
00:07:20,440 --> 00:07:22,080
You might even know the potential value,
204
00:07:22,080 --> 00:07:23,840
but the buyer is still researching,
205
00:07:23,840 --> 00:07:27,240
comparing priorities, or deciding whether to spend at all.
206
00:07:27,240 --> 00:07:28,720
Keep pipeline visible.
207
00:07:28,720 --> 00:07:31,360
A low confidence deal can still turn into a good sale,
208
00:07:31,360 --> 00:07:33,880
and it might show where next quarter our TMS revenue
209
00:07:33,880 --> 00:07:34,880
could come from.
210
00:07:34,880 --> 00:07:36,480
It just should noten't carry the same weight
211
00:07:36,480 --> 00:07:38,880
as a customer who has already agreed to buy.
212
00:07:38,880 --> 00:07:40,280
Imagine a seller meets a company
213
00:07:40,280 --> 00:07:42,400
that needs new customer service software.
214
00:07:42,400 --> 00:07:44,560
The first conversation goes well, but nobody knows
215
00:07:44,560 --> 00:07:46,520
who signs the contract, what budget exists,
216
00:07:46,520 --> 00:07:48,400
or when the company wants to make a decision.
217
00:07:48,400 --> 00:07:50,240
That opportunity belongs in pipeline.
218
00:07:50,240 --> 00:07:51,560
The seller needs to learn more
219
00:07:51,560 --> 00:07:53,440
before calling it anything stronger.
220
00:07:53,440 --> 00:07:54,640
Next comes best case.
221
00:07:54,640 --> 00:07:56,120
A best case opportunity has moved
222
00:07:56,120 --> 00:07:57,720
beyond the first conversation.
223
00:07:57,720 --> 00:07:59,920
The customer is actively looking at the solution.
224
00:07:59,920 --> 00:08:02,360
Maybe they asked for pricing, joined a product demo,
225
00:08:02,360 --> 00:08:03,960
brought in more people from their team,
226
00:08:03,960 --> 00:08:05,880
or discussed what the setup might look like.
227
00:08:05,880 --> 00:08:07,160
There is real progress.
228
00:08:07,160 --> 00:08:09,800
Still, progress is no to-med commitment.
229
00:08:09,800 --> 00:08:11,520
The buyer might choose another supplier,
230
00:08:11,520 --> 00:08:13,440
postpone the project, or decide the price
231
00:08:13,440 --> 00:08:15,320
does now at Met fit their budget.
232
00:08:15,320 --> 00:08:17,920
Best case means the deal could close in the forecast period,
233
00:08:17,920 --> 00:08:19,920
but the team should know, tend to plan
234
00:08:19,920 --> 00:08:22,120
as if the money is already in the bank.
235
00:08:22,120 --> 00:08:24,080
This category stops two bad habits.
236
00:08:24,080 --> 00:08:26,280
One is treating every active deal as a sure thing.
237
00:08:26,280 --> 00:08:27,720
The other is ignoring good deals
238
00:08:27,720 --> 00:08:30,480
just because they are no-tiered, ready for a firm call.
239
00:08:30,480 --> 00:08:32,120
Best case holds that middle ground.
240
00:08:32,120 --> 00:08:34,800
It makes the upside clear without hiding the risk
241
00:08:34,800 --> 00:08:35,840
that you have committed.
242
00:08:35,840 --> 00:08:37,480
Committed means the customer has given
243
00:08:37,480 --> 00:08:39,440
a verbal or contractual commitment.
244
00:08:39,440 --> 00:08:41,200
The deal has reached a high confidence point.
245
00:08:41,200 --> 00:08:42,720
Maybe the buyer agreed to the price
246
00:08:42,720 --> 00:08:45,280
and sent the contract through their approval process.
247
00:08:45,280 --> 00:08:47,280
Maybe the paperwork just needs a final signature.
248
00:08:47,280 --> 00:08:49,120
That sounds close because it is close,
249
00:08:49,120 --> 00:08:51,720
but a committed opportunity has now been closed yet.
250
00:08:51,720 --> 00:08:54,520
Paperwork can stall, a senior leader can pause spending.
251
00:08:54,520 --> 00:08:56,280
Legal teams can request changes.
252
00:08:56,280 --> 00:08:59,120
That outams why sellers need to use this category carefully,
253
00:08:59,120 --> 00:09:00,760
not move a deal there just because the end
254
00:09:00,760 --> 00:09:02,440
of the quarter feels uncomfortable.
255
00:09:02,440 --> 00:09:03,680
Commit is a serious call
256
00:09:03,680 --> 00:09:05,240
when a manager sees committed revenue,
257
00:09:05,240 --> 00:09:06,400
they should be able to ask,
258
00:09:06,400 --> 00:09:08,720
oh, what exactly has the customer agreed to?
259
00:09:08,720 --> 00:09:10,440
And what remains before we close?
260
00:09:10,440 --> 00:09:11,920
Oh, if the answer is only hope,
261
00:09:11,920 --> 00:09:13,560
the deal belongs somewhere else.
262
00:09:13,560 --> 00:09:14,840
There is also omitted.
263
00:09:14,840 --> 00:09:17,960
Omitted removes an opportunity from all forecast totals.
264
00:09:17,960 --> 00:09:20,680
Use it when a deal is on hold, no longer fits the current period
265
00:09:20,680 --> 00:09:22,800
or needs to stay out of the forecast for now.
266
00:09:22,800 --> 00:09:25,600
The opportunity can remain in Dynamics 365 sales
267
00:09:25,600 --> 00:09:26,720
with its history intact,
268
00:09:26,720 --> 00:09:29,520
but it one outam it, affect the team, outams number.
269
00:09:29,520 --> 00:09:31,120
That can feel strange at first.
270
00:09:31,120 --> 00:09:32,960
People sometimes leave weak deals in the forecast
271
00:09:32,960 --> 00:09:35,520
because they don't know if I did want to lose sight of them.
272
00:09:35,520 --> 00:09:36,920
Omitted solves that problem.
273
00:09:36,920 --> 00:09:38,920
You can still see the deal in the sales records
274
00:09:38,920 --> 00:09:41,280
while keeping it from distorting the revenue picture.
275
00:09:41,280 --> 00:09:42,640
One in Lost work differently.
276
00:09:42,640 --> 00:09:45,840
You should now tempt, select those categories by hand.
277
00:09:45,840 --> 00:09:47,400
When a seller closes an opportunity
278
00:09:47,400 --> 00:09:49,440
through the close opportunity process,
279
00:09:49,440 --> 00:09:52,040
Dynamics 365 sales updates the category
280
00:09:52,040 --> 00:09:53,720
to one or lost automatically.
281
00:09:53,720 --> 00:09:56,000
That ties the result to the actual closing action,
282
00:09:56,000 --> 00:09:58,080
not a label someone changed too early.
283
00:09:58,080 --> 00:10:00,000
Manual changes can create bad totals.
284
00:10:00,000 --> 00:10:01,760
So let the system handle the final outcome.
285
00:10:01,760 --> 00:10:05,600
Until a deal closes, use Pipeline, best case, committed
286
00:10:05,600 --> 00:10:08,120
or omitted to show its current position.
287
00:10:08,120 --> 00:10:10,960
Picture one opportunity as it develops over several weeks.
288
00:10:10,960 --> 00:10:12,640
A customer first contacts your company
289
00:10:12,640 --> 00:10:14,160
about a new service package.
290
00:10:14,160 --> 00:10:15,800
The seller creates the opportunity
291
00:10:15,800 --> 00:10:17,280
and it starts in Pipeline.
292
00:10:17,280 --> 00:10:19,720
After meetings, a proposal, and a serious review
293
00:10:19,720 --> 00:10:23,040
by the customer AOTMS team, the seller moves it to best case.
294
00:10:23,040 --> 00:10:24,760
Later, the customer agrees to move ahead
295
00:10:24,760 --> 00:10:26,160
and confirms the commercial terms.
296
00:10:26,160 --> 00:10:28,080
The seller moves the opportunity to commit it
297
00:10:28,080 --> 00:10:30,440
because only the final paperwork remains.
298
00:10:30,440 --> 00:10:32,520
Each change updates the forecast view.
299
00:10:32,520 --> 00:10:34,440
So managers can see that the deal did not
300
00:10:34,440 --> 00:10:36,520
and suddenly appear from nowhere.
301
00:10:36,520 --> 00:10:38,720
Its confidence changed as the customer moved closer
302
00:10:38,720 --> 00:10:39,880
to a decision.
303
00:10:39,880 --> 00:10:41,520
That is what makes categories useful.
304
00:10:41,520 --> 00:10:43,120
They turn a long list of opportunities
305
00:10:43,120 --> 00:10:47,080
into a clearer picture of risk, upside, and expected revenue.
306
00:10:47,080 --> 00:10:49,840
Once every seller uses the same confidence labels,
307
00:10:49,840 --> 00:10:52,360
those individual judgments can flow upward interviews
308
00:10:52,360 --> 00:10:54,920
for managers, directors, and leadership.
309
00:10:54,920 --> 00:10:55,680
There it.
310
00:10:55,680 --> 00:10:58,880
One forecast, different views for every sales role.
311
00:10:58,880 --> 00:11:00,960
A forecast starts with individual deals,
312
00:11:00,960 --> 00:11:02,960
but different people see it differently.
313
00:11:02,960 --> 00:11:04,680
That's because each role looks at the same data
314
00:11:04,680 --> 00:11:05,760
from a different angle.
315
00:11:05,760 --> 00:11:07,600
If you're a seller, your view is personal,
316
00:11:07,600 --> 00:11:10,640
you compare your forecast to your quota for the current period.
317
00:11:10,640 --> 00:11:12,920
Let's say your target is $100,000
318
00:11:12,920 --> 00:11:15,400
and your best open deals only add up to 60,000.
319
00:11:15,400 --> 00:11:17,400
You can see that gap early and take action.
320
00:11:17,400 --> 00:11:19,280
Maybe you need a meeting with a decision maker
321
00:11:19,280 --> 00:11:20,760
on a best case deal.
322
00:11:20,760 --> 00:11:22,840
Or maybe a deal you expected to close this month,
323
00:11:22,840 --> 00:11:24,360
slipped to next month.
324
00:11:24,360 --> 00:11:26,000
So you need to find another opportunity.
325
00:11:26,000 --> 00:11:27,960
Maybe you just don't have enough active deals yet.
326
00:11:27,960 --> 00:11:30,520
The forecast won't sell for you, but it shows you
327
00:11:30,520 --> 00:11:33,160
where to focus your time for the biggest impact.
328
00:11:33,160 --> 00:11:35,000
A sales manager sees a bigger picture.
329
00:11:35,000 --> 00:11:36,880
Instead of checking one seller's forecast,
330
00:11:36,880 --> 00:11:38,120
you can view the whole team.
331
00:11:38,120 --> 00:11:40,200
Then you can zoom in when something needs attention.
332
00:11:40,200 --> 00:11:42,520
One seller might have a healthy committed amount.
333
00:11:42,520 --> 00:11:44,080
Another might have a large target,
334
00:11:44,080 --> 00:11:46,200
but very little pipeline behind it.
335
00:11:46,200 --> 00:11:48,600
That makes coaching conversations much clearer.
336
00:11:48,600 --> 00:11:51,200
Instead of telling a seller to improve the forecast,
337
00:11:51,200 --> 00:11:52,640
you can open up their actual deals
338
00:11:52,640 --> 00:11:55,560
and ask practical questions, which customer still needs a proposal
339
00:11:55,560 --> 00:11:57,400
of why did this expected close date move?
340
00:11:57,400 --> 00:11:59,000
Who needs help getting a technical person
341
00:11:59,000 --> 00:12:00,360
into the next meeting?
342
00:12:00,360 --> 00:12:02,520
The manager can also spot risk across the team.
343
00:12:02,520 --> 00:12:05,640
If nearly all of the expected revenue depends on two huge deals,
344
00:12:05,640 --> 00:12:08,160
the total might look fine while the quarter is fragile.
345
00:12:08,160 --> 00:12:10,040
A forecast view makes that dependence visible
346
00:12:10,040 --> 00:12:11,760
before the final week arrives.
347
00:12:11,760 --> 00:12:15,440
Directors usually look across groups, not individual sellers.
348
00:12:15,440 --> 00:12:17,120
You might compare one region to another.
349
00:12:17,120 --> 00:12:18,640
Look at results from several teams
350
00:12:18,640 --> 00:12:20,720
or check how a product line is performing.
351
00:12:20,720 --> 00:12:23,200
That helps you decide where to focus your attention
352
00:12:23,200 --> 00:12:23,880
and support.
353
00:12:23,880 --> 00:12:26,760
Imagine one territory has a strong pipeline for a product
354
00:12:26,760 --> 00:12:29,160
while another territory struggles to start conversations
355
00:12:29,160 --> 00:12:30,160
with customers.
356
00:12:30,160 --> 00:12:32,080
The director can ask whether the stronger team
357
00:12:32,080 --> 00:12:34,160
has a useful sales approach to share.
358
00:12:34,160 --> 00:12:36,360
Maybe they bring marketing help to the weaker territory,
359
00:12:36,360 --> 00:12:38,560
reassigned specialist, or adjust a plan
360
00:12:38,560 --> 00:12:40,480
that no longer fits customer demand.
361
00:12:40,480 --> 00:12:42,520
Leadership needs an even higher view,
362
00:12:42,520 --> 00:12:45,120
projected revenue affects more than sales meetings.
363
00:12:45,120 --> 00:12:47,560
The business may need to plan product work, staffing,
364
00:12:47,560 --> 00:12:50,840
inventory, or talks with investors and other stakeholders.
365
00:12:50,840 --> 00:12:53,600
Nobody treats a forecast as guaranteed money,
366
00:12:53,600 --> 00:12:55,160
but it gives leadership a current view
367
00:12:55,160 --> 00:12:57,000
instead of waiting until the period ends
368
00:12:57,000 --> 00:12:59,280
to find out something went wrong.
369
00:12:59,280 --> 00:13:02,800
Dynamics 365 sales supports this with hierarchy rollups.
370
00:13:02,800 --> 00:13:05,520
Think of expense receipts after a business trip.
371
00:13:05,520 --> 00:13:07,560
Each person submits their own receipts,
372
00:13:07,560 --> 00:13:09,600
a manager sees the department total
373
00:13:09,600 --> 00:13:11,720
and finances the company total.
374
00:13:11,720 --> 00:13:13,720
Forecast amounts work the same way out.
375
00:13:13,720 --> 00:13:16,080
They flow from opportunities into a seller's row
376
00:13:16,080 --> 00:13:17,880
then up through the sales structure.
377
00:13:17,880 --> 00:13:19,800
You can set up a forecast based on the structure
378
00:13:19,800 --> 00:13:21,240
that fits your question.
379
00:13:21,240 --> 00:13:23,640
An org chart forecast follows reporting lines,
380
00:13:23,640 --> 00:13:25,600
so a manager sees the people who report to them
381
00:13:25,600 --> 00:13:27,120
and they're combined totals.
382
00:13:27,120 --> 00:13:29,000
A territory forecast group sales by area
383
00:13:29,000 --> 00:13:30,800
like regions or assigned markets.
384
00:13:30,800 --> 00:13:32,800
A product forecast groups expected revenue
385
00:13:32,800 --> 00:13:34,480
by what the company sells.
386
00:13:34,480 --> 00:13:36,480
The numbers change depending on the view,
387
00:13:36,480 --> 00:13:38,080
but the source stays connected.
388
00:13:38,080 --> 00:13:39,400
That helps people stop arguing
389
00:13:39,400 --> 00:13:41,520
over whose spreadsheet has the right answer.
390
00:13:41,520 --> 00:13:44,040
A seller, manager, director, and leader
391
00:13:44,040 --> 00:13:46,000
can all look at the same sales records
392
00:13:46,000 --> 00:13:48,280
while asking the questions that fit their role.
393
00:13:48,280 --> 00:13:50,120
Automation can help bring those views together,
394
00:13:50,120 --> 00:13:52,920
but people still need to judge what the numbers mean.
395
00:13:52,920 --> 00:13:55,480
AI, data quality, and human judgment automation
396
00:13:55,480 --> 00:13:57,120
can help bring those views together,
397
00:13:57,120 --> 00:13:59,040
but you still need to judge what the numbers mean.
398
00:13:59,040 --> 00:14:00,320
That's where AI comes in.
399
00:14:00,320 --> 00:14:02,360
Many people here, AI forecasting,
400
00:14:02,360 --> 00:14:05,280
and imagine a machine that knows exactly which deals will close.
401
00:14:05,280 --> 00:14:06,160
That's not what it does.
402
00:14:06,160 --> 00:14:09,280
Instead, think of it as a second opinion.
403
00:14:09,280 --> 00:14:10,920
It looks at all the sales information
404
00:14:10,920 --> 00:14:14,040
stored in Dynamics 365 sales and spots patterns
405
00:14:14,040 --> 00:14:15,880
you might miss when you're looking at dozens
406
00:14:15,880 --> 00:14:17,440
or hundreds of opportunities.
407
00:14:17,440 --> 00:14:18,880
For example, an opportunity score
408
00:14:18,880 --> 00:14:21,680
can look at recent customer contact, meetings, emails,
409
00:14:21,680 --> 00:14:23,880
movement between stages, the deal amount,
410
00:14:23,880 --> 00:14:25,280
and where the lead came from.
411
00:14:25,280 --> 00:14:28,200
It compares current opportunities to past sales patterns,
412
00:14:28,200 --> 00:14:30,680
a deal that hasn't moved in months might need attention,
413
00:14:30,680 --> 00:14:32,960
so might a large opportunity where the seller hasn't
414
00:14:32,960 --> 00:14:34,680
spoken to the customer recently.
415
00:14:34,680 --> 00:14:37,200
On the other hand, a smaller deal with steady meetings,
416
00:14:37,200 --> 00:14:40,120
clear next steps, and a consistent expected close date
417
00:14:40,120 --> 00:14:42,480
might look healthier than its amounts suggests.
418
00:14:42,480 --> 00:14:44,320
That doesn't mean the score knows the customer better
419
00:14:44,320 --> 00:14:45,000
than you do.
420
00:14:45,000 --> 00:14:47,520
It just gives you and your manager another signal to consider
421
00:14:47,520 --> 00:14:50,440
before you spend time on the next call or forecast review.
422
00:14:50,440 --> 00:14:53,720
A low score is a reason to ask questions, not a final answer.
423
00:14:53,720 --> 00:14:56,520
Co-pilot and other sales tools can also reduce some of the admin
424
00:14:56,520 --> 00:14:58,040
work around forecasting.
425
00:14:58,040 --> 00:15:00,040
You can use them to catch up on customer history,
426
00:15:00,040 --> 00:15:02,440
prepare for a meeting, summarize a conversation,
427
00:15:02,440 --> 00:15:03,880
or draft a follow-up message.
428
00:15:03,880 --> 00:15:06,240
Less time hunting for notes means more time keeping
429
00:15:06,240 --> 00:15:08,120
your opportunity details current.
430
00:15:08,120 --> 00:15:11,200
But that only helps if the information in Dynamics 365 sales
431
00:15:11,200 --> 00:15:12,120
stays honest.
432
00:15:12,120 --> 00:15:14,040
Bad data leads to bad forecasts.
433
00:15:14,040 --> 00:15:15,880
A tool can look very smart while working
434
00:15:15,880 --> 00:15:18,200
from an old close date, an amount nobody
435
00:15:18,200 --> 00:15:20,760
updated after a pricing change, or an opportunity
436
00:15:20,760 --> 00:15:22,280
that should have closed months ago.
437
00:15:22,280 --> 00:15:26,480
Imagine a seller leaves a $60,000 opportunity marked as committed.
438
00:15:26,480 --> 00:15:29,600
The customer actually paused the project until next year,
439
00:15:29,600 --> 00:15:32,480
but nobody updates the close date or forecast category.
440
00:15:32,480 --> 00:15:34,800
AI can analyze the record, and the forecast
441
00:15:34,800 --> 00:15:36,680
can roll it up perfectly, but the result still
442
00:15:36,680 --> 00:15:38,680
points the business in the wrong direction.
443
00:15:38,680 --> 00:15:40,760
The system can only work with what you put into it.
444
00:15:40,760 --> 00:15:43,400
That's why basic habits matter more than fancy tools.
445
00:15:43,400 --> 00:15:45,440
Sellers need to record the current amount,
446
00:15:45,440 --> 00:15:47,720
the expected close date, the deal owner,
447
00:15:47,720 --> 00:15:49,520
and the latest forecast category.
448
00:15:49,520 --> 00:15:51,720
When a customer changes direction, the opportunity
449
00:15:51,720 --> 00:15:53,120
needs to change with them.
450
00:15:53,120 --> 00:15:55,360
Some information won't appear neatly in a field.
451
00:15:55,360 --> 00:15:56,920
You might know the customer lost budget
452
00:15:56,920 --> 00:15:58,400
after a reorganization.
453
00:15:58,400 --> 00:16:01,080
You might hear that a competitor lowered their price.
454
00:16:01,080 --> 00:16:02,880
A decision maker might leave the company,
455
00:16:02,880 --> 00:16:04,760
or a buying committee might postpone a decision
456
00:16:04,760 --> 00:16:06,160
while handling another project.
457
00:16:06,160 --> 00:16:08,200
Those details can change a deal overnight.
458
00:16:08,200 --> 00:16:11,000
No score can replace the person who spoke with the customer.
459
00:16:11,000 --> 00:16:13,160
A forecast works best when the system brings the data
460
00:16:13,160 --> 00:16:15,480
together, and the seller adds the human context
461
00:16:15,480 --> 00:16:16,760
that the data can't see.
462
00:16:16,760 --> 00:16:18,760
Managers play an active part too.
463
00:16:18,760 --> 00:16:21,040
During a forecast review, you can ask what change
464
00:16:21,040 --> 00:16:23,000
since the last conversation and whether the category
465
00:16:23,000 --> 00:16:24,000
still fits.
466
00:16:24,000 --> 00:16:25,800
If an opportunity sits in committed,
467
00:16:25,800 --> 00:16:27,760
ask what the customer agreed to and what's left
468
00:16:27,760 --> 00:16:29,120
before the sale closes.
469
00:16:29,120 --> 00:16:31,520
Sometimes, a manager can adjust a forecast value
470
00:16:31,520 --> 00:16:33,800
to account for something not yet captured in the system,
471
00:16:33,800 --> 00:16:35,720
out like a verbal customer commitment,
472
00:16:35,720 --> 00:16:38,000
or a pause deal that might come back.
473
00:16:38,000 --> 00:16:40,040
That adjustment should support a clear conversation,
474
00:16:40,040 --> 00:16:41,800
not hide a weak pipeline.
475
00:16:41,800 --> 00:16:43,840
The goal isn't to make every forecast look better.
476
00:16:43,840 --> 00:16:45,360
It's to remove false certainty early
477
00:16:45,360 --> 00:16:46,720
so the team can respond.
478
00:16:46,720 --> 00:16:48,760
Maybe the seller needs help with an approval.
479
00:16:48,760 --> 00:16:50,200
Maybe the account needs another meeting.
480
00:16:50,200 --> 00:16:51,840
Maybe the deal should move out of the period
481
00:16:51,840 --> 00:16:54,400
so everyone stops planning around money that won't arrive.
482
00:16:54,400 --> 00:16:56,840
There's also a line businesses need to respect.
483
00:16:56,840 --> 00:16:59,640
Microsoft describes forecasting as a tool for sales managers
484
00:16:59,640 --> 00:17:01,880
and supervisors to support team performance.
485
00:17:01,880 --> 00:17:04,480
It shouldn't decide someone's pay, rewards,
486
00:17:04,480 --> 00:17:07,280
seniority, or other employment rights.
487
00:17:07,280 --> 00:17:08,680
Companies also need to follow the laws
488
00:17:08,680 --> 00:17:11,200
that apply to employee information and customer communications,
489
00:17:11,200 --> 00:17:13,320
including notice and consent, where required.
490
00:17:13,320 --> 00:17:16,240
Use AI and forecasting to support planning and coaching.
491
00:17:16,240 --> 00:17:18,400
Don't let a score, a category, or a dashboard
492
00:17:18,400 --> 00:17:19,960
become a verdict about a person.
493
00:17:19,960 --> 00:17:21,320
The data describes sales work.
494
00:17:21,320 --> 00:17:23,720
It never tells the full story of the person doing it.
495
00:17:23,720 --> 00:17:26,640
It was a simple forecasting rhythm that holds up.
496
00:17:26,640 --> 00:17:28,080
Forecasting needs a routine.
497
00:17:28,080 --> 00:17:29,720
Each week check your open opportunities
498
00:17:29,720 --> 00:17:32,080
and update the amount, close date, owner, and forecast
499
00:17:32,080 --> 00:17:34,760
category whenever the customer situation changes.
500
00:17:34,760 --> 00:17:37,160
Small updates during the week beat a rushed cleanup
501
00:17:37,160 --> 00:17:39,640
before a leadership meeting, then review the forecast
502
00:17:39,640 --> 00:17:41,840
before anyone higher up needs an answer.
503
00:17:41,840 --> 00:17:44,800
Ask which deals moved forward, which one slipped?
504
00:17:44,800 --> 00:17:47,480
Does the team still have enough value to reach quota?
505
00:17:47,480 --> 00:17:50,080
Those questions turn the forecast into a working tool,
506
00:17:50,080 --> 00:17:51,480
treat committed with care.
507
00:17:51,480 --> 00:17:53,560
If a deal doesn't have a real customer commitment,
508
00:17:53,560 --> 00:17:55,840
don't use the label to make the number look stronger.
509
00:17:55,840 --> 00:17:57,880
Put your sales time where it can change the outcome
510
00:17:57,880 --> 00:18:02,040
or protect a near-close deal or create the next opportunity.
511
00:18:02,040 --> 00:18:05,360
Conclusion, Dynamics 365.
512
00:18:05,360 --> 00:18:07,360
Forecasting takes your daily sales work
513
00:18:07,360 --> 00:18:10,080
and turns it into a shared view of expected revenue.
514
00:18:10,080 --> 00:18:12,280
But that view is only useful if your opportunity updates
515
00:18:12,280 --> 00:18:13,120
are honest.
516
00:18:13,120 --> 00:18:15,520
Keep them accurate and the forecast becomes the one number
517
00:18:15,520 --> 00:18:16,440
everyone trusts.
518
00:18:16,440 --> 00:18:17,640
I'm Mirko Peters.
519
00:18:17,640 --> 00:18:19,480
Subscribe on your favorite podcast platform
520
00:18:19,480 --> 00:18:21,800
and share this knowledge nugget with someone still chasing
521
00:18:21,800 --> 00:18:25,320
forecast numbers through spreadsheets and late-night emails.




