


 Apple Podcasts
 Spotify
 Youtube Music
 Spreaker
 Podchaser
 Amazon Music
 What Is an Industrial Data Model
Key Takeaways
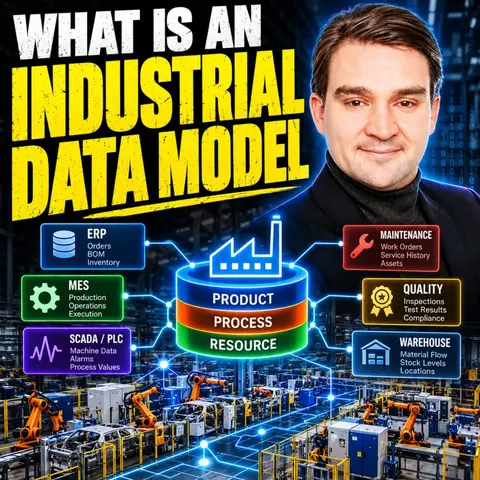
- An industrial data model establishes shared meaning across disparate factory systems like ERP, MES, and SCADA by defining core objects and their relationships.
- Traditional data platforms like Microsoft Fabric or SQL databases store and move information, but they cannot inherently define the contextual relationships between factory assets without a dedicated model.
- Using the Product, Process, Resource (PPR) framework provides a practical starting backbone to connect isolated manufacturing records into actionable production context.
- Factories often struggle when business logic is scattered across personal spreadsheets, custom reports, and local exception lists rather than a governed shared relationship layer.
- An effective industrial data model separates a resource's design capability from its real-time operational state to accurately determine production feasibility.
A factory can collect enormous amounts of data and still struggle to answer a basic operational question: what does this event actually affect?
ERP knows customer orders, materials, planned dates, and inventory. MES knows what is executing on the shop floor. PLCs and SCADA know machine states, alarms, and process values. Maintenance knows asset condition and service history. Quality knows inspection and release status. Engineering knows the product definition. The problem is not usually a lack of data. The problem is that these systems describe the same factory through different names, IDs, states, and rules.
An industrial data model creates shared meaning across those boundaries. It defines the factory objects that matter, gives them stable identity, and describes how products, processes, resources, orders, materials, people, tools, quality records, and machine events relate to each other. The goal is not to replace ERP, MES, maintenance, or other source systems. The goal is to make their information understandable as one connected production context.
PLENTY OF SYSTEMS — NO SHARED MEANING
A modern plant already has specialized systems for almost every important job. ERP manages demand and commitments. MES manages execution. PLCs control equipment. SCADA presents machine conditions. Historians store process data. Maintenance systems manage assets and service work. Quality systems maintain inspection records, and Power BI can combine information for reporting.
Each system exists for a reason. The problem begins when the same real-world object appears differently in every one of them. A machine may be represented as a work center in ERP, an asset number in maintenance, a resource in MES, a group of OPC UA nodes in the control system, and a completely different friendly name on the shop floor.
An industrial model does not force all of those systems to use one identifier. Instead, it records how those references relate to the same physical or logical object. That gives the factory a stable identity layer without destroying the local structures each source system needs.
WHAT AN INDUSTRIAL DATA MODEL ACTUALLY IS
An industrial data model is a shared set of rules describing what matters in the factory and how those things connect.
It answers practical questions such as what counts as a production order, what a product revision represents, how a work center differs from a physical asset, when material is released, and what it actually means for a machine to be available.
The model can describe:
• Object types and identities
• Properties and states
• Relationships between factory objects
• Source-system references
• Effective dates and versions
• Conditions attached to relationships
• Ownership of definitions and rules
This lets several systems describe different aspects of the same production situation without collapsing them into one misleading status. An order can be released in ERP while its current MES operation remains blocked. A machine can be mechanically healthy while still unavailable because the required fixture is missing. Those facts can all be true at the same time.
THE MODEL IS NOT THE DATA PLATFORM
Microsoft Fabric, SQL databases, historians, data lakes, and other platforms are useful for storing, moving, governing, and analyzing information. But none of them can determine what a work center means in your factory simply because the records are stored together.
You can load ERP orders, MES execution records, maintenance events, quality results, and machine telemetry into one Lakehouse and still be unable to answer whether a particular order can move to another machine before the end of the shift.
That answer depends on relationships.
Which product revision is involved? Which operation must run next? Which resources are approved for that operation? Which tooling is required? Is the operator qualified? Does the current machine state allow the work? Is an inspection rule attached to the alternate route?
The platform can host and query those relationships, but the factory still has to define them.
WHY TABLES ALONE OFTEN BECOME DIFFICULT
Relational tables are not the problem. ERP, MES, maintenance, and many manufacturing applications depend on relational models because they are excellent for transactions and structured records.
The difficulty appears when production questions cross many relationships that change over time.
A product revision may require several operations. An operation may be approved on multiple resources. One machine may support only certain product versions, tooling combinations, size ranges, or inspection requirements. Operator qualifications may expire. Engineering changes may invalidate a previously approved route.
All of this can be represented in tables, but the logic often becomes scattered across reports, SQL queries, spreadsheets, and local exception lists. Different reports then rebuild the same factory relationships differently.
The industrial model provides a shared relationship layer so the rules can be defined once, governed, and reused instead of rediscovered every time someone asks a difficult production question.
PPR — PRODUCT, PROCESS, RESOURCE
A practical starting structure is PPR: Product, Process, Resource.
Product answers: what are we building?
Process answers: how does the work need to happen?
Resource answers: what can perform that work under real production conditions?
PPR provides a simple backbone for connecting isolated records into a production model. It avoids trying to model the entire enterprise immediately and instead focuses on the relationships that determine whether work can actually happen.
PRODUCT IS MORE THAN A PART NUMBER
A product definition may include the product family, specific variant, revision, bill of material, customer configuration, material requirements, inspection requirements, and quality rules.
This matters because two records with the same broad part number may not be interchangeable. A new revision may require a tighter tolerance, different process parameters, another inspection step, or equipment with higher capability.
Engineering systems such as PLM may own design intent. ERP may hold the material master and planning version. MES may hold a production definition. Quality may maintain an inspection plan.
The industrial model connects those references so production can answer a much more important question than “what part number is this?”
It can answer: are we building the correct revision under the rules that currently apply?
PROCESS DEFINES HOW WORK SHOULD HAPPEN
The process side describes the approved route through production. It includes more than a list of machines.
It can describe operation sequence, setup requirements, inspection points, wait times, rework paths, approvals, handoffs, and conditions that must be satisfied before work continues.
A planned process definition describes how work is supposed to happen. MES execution data records what actually happened for a specific order.
Both matter.
Without the planned process, you cannot determine whether execution followed the approved route. Without the execution history, you cannot learn what actually happened during production.
RESOURCE MEANS CAPABILITY — NOT JUST A MACHINE
A production resource can be a machine, line, workstation, tool, fixture, operator, test rig, transport system, or another capability needed to perform work.
This distinction is critical because a machine can be technically available while the operation remains impossible.
The required fixture may be in use elsewhere. A tool may be out of calibration. The only qualified operator may not be on the current shift. A machine may support the product family but not the current revision.
The model therefore separates design capability from current state.
Capability asks what a resource can perform under defined conditions.
Current state asks whether that capability can actually be used right now.
Production feasibility depends on both.
THE RELATIONSHIPS CARRY THE REAL MEANING
The value of PPR comes from the relationships between Product, Process, and Resource.
A product requires a process. A process contains operations. An operation can be performed by certain resources, but often only under specific conditions.
For example, a relationship may effectively state that a particular machine can perform Operation 20 for a defined product family and revision range when Fixture F12 is installed, the machine is within its approved operating condition, and a qualified operator is assigned.
That sounds detailed because production is detailed.
Those are the checks people already make manually when they move work after a machine breakdown. The industrial model simply makes the logic explicit and reusable.
Become a supporter of this podcast: https://www.spreaker.com/podcast/m365-fm-a-microsoft-mvp-podcast-by-mirko-peters--6704921/support.
🚀 Want to be part of m365.fm?
Then stop just listening… and start showing up.
👉 Connect with me on LinkedIn and let’s make something happen:
- 🎙️ Be a podcast guest and share your story
- 🎧 Host your own episode (yes, seriously)
- 💡 Pitch topics the community actually wants to hear
- 🌍 Build your personal brand in the Microsoft 365 space
This isn’t just a podcast — it’s a platform for people who take action.
🔥 Most people wait. The best ones don’t.
👉 Connect with me on LinkedIn and send me a message:
"I want in"
Let’s build something awesome 👊
Frequently Asked Questions
What is an industrial data model?
An industrial data model is a shared set of rules that defines what matters in a factory and describes how products, processes, resources, and machine events relate to one another across different enterprise systems.
Why can't data platforms like Microsoft Fabric solve the manufacturing context problem on their own?
While data platforms excel at storing, governing, and analyzing information, they cannot automatically determine the operational relationships and business rules between a work center, product revision, and machine state simply because the tables are loaded into the same lakehouse.
What does the PPR framework stand for in manufacturing?
PPR stands for Product, Process, and Resource, serving as a foundational backbone that answers what you are building, how the work needs to happen, and what equipment or personnel can perform that work under real production conditions.
Why do factories still rely on spreadsheets despite having ERP and MES systems?
Factories rely on flexible spreadsheets because specialized enterprise systems often isolate data and leave the complex task of cross-system relationship-building up to human workers when disruptions occur.
00:00:00,000 --> 00:00:05,000
A factory can collect mountains of data, but when production changes and someone asks a simple question,
2
00:00:05,000 --> 00:00:07,000
what does this event really affect?
3
00:00:07,000 --> 00:00:09,000
It freezes up.
4
00:00:09,000 --> 00:00:14,000
Now your ERP holds customer orders, plant dates, bills of material, and stock counts.
5
00:00:14,000 --> 00:00:17,000
The MES tracks work as it moves through the line.
6
00:00:17,000 --> 00:00:20,000
Machines fire off alarms, state changes, cycle times, and sensor values.
7
00:00:20,000 --> 00:00:22,000
Quality team's log inspection results.
8
00:00:22,000 --> 00:00:28,000
Maintenance keeps work orders, service history, and maybe a note that only one guy truly understands that old machine online three.
9
00:00:28,000 --> 00:00:32,000
That sounds like a factory that knows itself, and in many plants it does.
10
00:00:32,000 --> 00:00:33,000
But here's the problem.
11
00:00:33,000 --> 00:00:38,000
That information usually lives as isolated facts in separate systems, each built for a different job,
12
00:00:38,000 --> 00:00:40,000
each using its own names, IDs, and rules.
13
00:00:40,000 --> 00:00:43,000
The factory has data, but it does not have a shared model of itself.
14
00:00:43,000 --> 00:00:46,000
Picture a work center, stopping halfway through a shift.
15
00:00:46,000 --> 00:00:48,000
The alarm reaches the control system.
16
00:00:48,000 --> 00:00:50,000
The MES logs downtime. Maintenance gets a notification.
17
00:00:50,000 --> 00:00:52,000
But the real production question starts somewhere else.
18
00:00:52,000 --> 00:00:54,000
Which customer orders are now at risk?
19
00:00:54,000 --> 00:00:55,000
Which tools can move?
20
00:00:55,000 --> 00:00:57,000
Who has approval to run an alternate machine?
21
00:00:57,000 --> 00:00:59,000
Which process route is still valid?
22
00:00:59,000 --> 00:01:01,000
And which promised dates need a new answer?
23
00:01:01,000 --> 00:01:04,000
The people on the floor generally know how to find those answers.
24
00:01:04,000 --> 00:01:12,000
They call the planner, they ask the shift lead, or someone opens a spreadsheet that has survived three system migrations and probably deserves its own asset tag by now.
25
00:01:12,000 --> 00:01:15,000
That human knowledge keeps factories running, but it doesn't scale.
26
00:01:15,000 --> 00:01:20,000
Not when the same questions need fast, repeatable answers across shifts, plants, products, and systems.
27
00:01:20,000 --> 00:01:24,000
This is where product, process, and resource, PPR for short, comes in.
28
00:01:24,000 --> 00:01:30,000
It gives us a simple structure to link what the factory builds, how it builds it, and what it needs to make it happen.
29
00:01:30,000 --> 00:01:36,000
Those links turn isolated records into context that people, planning tools, simulation models, and even AI can actually use.
30
00:01:36,000 --> 00:01:39,000
So let's start with the daily problem, not the data platform.
31
00:01:39,000 --> 00:01:42,000
Plenty of systems, no shared meaning.
32
00:01:42,000 --> 00:01:43,000
Take a typical plant.
33
00:01:43,000 --> 00:01:48,000
At the business end, the ERP holds sales demand, purchasing data, inventory, and plant production orders.
34
00:01:48,000 --> 00:01:51,000
The MES runs execution on the shop floor.
35
00:01:51,000 --> 00:01:57,000
Scada collects and presents machine and line status, while the PLCs run the actual control logic close to the equipment.
36
00:01:57,000 --> 00:02:04,000
Then you've got a historian holding years of process values and alarms, maybe a maintenance system, a quality system, a warehouse system, an engineering repository.
37
00:02:04,000 --> 00:02:12,000
On the reporting side, Power BI pulls together a view management can use, and somewhere, usually very close to the people who need it most.
38
00:02:12,000 --> 00:02:13,000
There are spreadsheets.
39
00:02:13,000 --> 00:02:15,000
None of that is a failure.
40
00:02:15,000 --> 00:02:23,000
Each system exists because it solves a real problem, and ERP needs control over orders and commercial commitments, the MES needs to manage execution.
41
00:02:23,000 --> 00:02:34,000
A historian needs to collect high volume time series data without asking a cloud service to make a control decision, and PLCs need to run safely and predictably, whether the enterprise network behaves or not.
42
00:02:34,000 --> 00:02:38,000
The trouble starts when each system describes the same factory thing differently.
43
00:02:38,000 --> 00:02:44,000
A work order might carry one number in ERP, a different execution ID in MES, and a shortened reference in a spreadsheet.
44
00:02:44,000 --> 00:02:50,000
A material may use an engineering code in one place, a planning code in another, and a supplier label on the shop floor.
45
00:02:50,000 --> 00:03:00,000
The same machine can appear as an asset number in maintenance, a tag group in Scada, a work center in ERP, and a friendly name the operators use because nobody can remember the asset number.
46
00:03:00,000 --> 00:03:01,000
Status is even more interesting.
47
00:03:01,000 --> 00:03:07,000
In ERP, an order may show as released, while in MES one operation may be active, and another waiting for inspection.
48
00:03:07,000 --> 00:03:11,000
The supervisor might describe the order as blocked because the fixture isn't available.
49
00:03:11,000 --> 00:03:15,000
All three descriptions can be correct, but they refer to different parts of the work.
50
00:03:15,000 --> 00:03:20,000
That difference causes friction during normal production, but during a disruption it becomes the whole job.
51
00:03:20,000 --> 00:03:27,000
A planner asks whether an order can move, the MES can report where the order sits, maintenance can tell you whether a machine is under repair.
52
00:03:27,000 --> 00:03:39,000
Quality might know that a certain product revision needs a tighter inspection path, and the person on the line knows the alternate machine only works if a particular tool is free, and a qualified operator is on shift.
53
00:03:39,000 --> 00:03:48,000
The data sits somewhere, but the shared meaning often doesn't. This is why factories still rely on phone calls, chat messages, whiteboards, and Excel when something goes wrong.
54
00:03:48,000 --> 00:03:57,000
Not because people reject digital systems, but because they need to connect information across boundaries, and the formal systems often leave that connection work to them.
55
00:03:57,000 --> 00:04:04,000
Excel survives because it's flexible. You can create a list in 10 minutes, add local rules, call a colleague, and change it again after lunch.
56
00:04:04,000 --> 00:04:11,000
The downside is that the logic lives inside a person, a workbook, or both, and nobody can reliably trace it, govern it, or reuse it across the plant.
57
00:04:11,000 --> 00:04:20,000
Power BI can make the situation easier to see by bringing data from many sources into a common report and applying shared measures, which helps especially for reporting.
58
00:04:20,000 --> 00:04:24,000
But a report can still combine records that refer to different things without anyone noticing.
59
00:04:24,000 --> 00:04:27,000
Connecting data means you can move it from one system to another.
60
00:04:27,000 --> 00:04:38,000
Agreeing on meaning means every system, report, and decision process can identify the same order, the same product revision, the same machine, and the same production state, and also understand how those things relate.
61
00:04:38,000 --> 00:04:41,000
That takes more than an interface. It takes a model.
62
00:04:41,000 --> 00:04:48,000
To see where the gap shows up, let's follow one production order through the plant. What an industrial data model actually is.
63
00:04:48,000 --> 00:04:51,000
Let's start with what an industrial data model actually is.
64
00:04:51,000 --> 00:04:58,000
It is a shared set of rules for describing what matters in a factory and how those things connect. That sounds abstract, so let me bring it down to the shop floor.
65
00:04:58,000 --> 00:05:09,000
The model gives clear answers to questions people actually ask. What counts as a production order, what's a product revision, what defines a work center, when does a batch actually release, what does it mean when a machine is available?
66
00:05:09,000 --> 00:05:12,000
Those answers have to hold across systems, which is usually where the trouble starts.
67
00:05:12,000 --> 00:05:19,000
Your ERP might call something a work center while the MES calls it a production unit. Maintenance knows the same physical equipment by an asset ID.
68
00:05:19,000 --> 00:05:25,000
Meanwhile, on the shop floor people just call it the press line or the big press or simply line two. None of those names need to disappear.
69
00:05:25,000 --> 00:05:30,000
Local language exists for good reasons, and you shouldn't force anyone to change how they talk.
70
00:05:30,000 --> 00:05:36,000
But the shared model needs to state whether those names point to the same thing, related things, or completely different things.
71
00:05:36,000 --> 00:05:41,000
A work center might represent a planning unit, while an asset represents the physical machine inside that unit.
72
00:05:41,000 --> 00:05:43,000
They're linked, but they aren't interchangeable.
73
00:05:43,000 --> 00:05:49,000
If the model blurs that distinction, planning and maintenance end up talking about the same equipment while drawing different conclusions.
74
00:05:49,000 --> 00:05:54,000
This is common language, but not the kind you solve by publishing a glossary and hoping people read it.
75
00:05:54,000 --> 00:06:01,000
The model gives each factory object a type, an identity, a set of known properties, possible states and permitted links to other objects.
76
00:06:01,000 --> 00:06:07,000
A product has an identity and a revision. A machine has an identity, a location, a condition, and known capabilities.
77
00:06:07,000 --> 00:06:15,000
An operation has a sequence, input and output rules, and a relationship to the resources that can perform it. Now here's where it gets interesting. The hard part is identity.
78
00:06:15,000 --> 00:06:23,000
Most plants already have IDs everywhere. The issue isn't a lack of IDs. The issue is that the same real world thing can carry several IDs, each valid in its own system.
79
00:06:23,000 --> 00:06:31,000
A pump might use a tag from the control system, an asset number and maintenance, a procurement reference in ERP, and an engineering reference in a design repository.
80
00:06:31,000 --> 00:06:37,000
A shared model doesn't force every source system to throw away its own code that would be disruptive and rarely necessary.
81
00:06:37,000 --> 00:06:43,000
Instead, it creates a stable identity for the factory object and records the source references that point to it.
82
00:06:43,000 --> 00:06:54,000
Think of it like an identity card for each thing you want to reason about. The card tells the model that these separate labels refer to the same physical pump, the same material lot, or the same production resource.
83
00:06:54,000 --> 00:07:02,000
Once that connection exists, a maintenance event can relate to the equipment that production planning refers to, without fragile spreadsheet matching, or a manual lookup every time.
84
00:07:02,000 --> 00:07:11,000
The same principle applies to states. Released, ready, in process, blocked, and complete sound simple until you ask which system owns the meaning.
85
00:07:11,000 --> 00:07:16,000
A model doesn't need to pretend that every status means exactly the same thing. It needs to define the difference.
86
00:07:16,000 --> 00:07:25,000
For example, an order can be commercially released in ERP while an operation remains blocked in MES. A material lot can exist in inventory while still waiting for quality release.
87
00:07:25,000 --> 00:07:30,000
A machine can be mechanically healthy while unavailable because a required tool is missing.
88
00:07:30,000 --> 00:07:36,000
The model lets you hold those facts together without collapsing them into one misleading green or red status.
89
00:07:36,000 --> 00:07:46,000
The model choices should come from the decisions people need to make. If the first use case is tracing quality containment, then you need clear links between product, batch, operation, inspection, result, and shipment.
90
00:07:46,000 --> 00:07:54,000
If the first use case is alternate routing after equipment failure, then machine capability, process rules, tool requirements, and operator approval matter more.
91
00:07:54,000 --> 00:07:58,000
You don't start by asking, "What is every possible field we could collect?"
92
00:07:58,000 --> 00:08:05,000
You start by asking, "What decision keeps taking too long, and what facts and relationships would let us make it with fewer guesses?"
93
00:08:05,000 --> 00:08:15,000
That question puts limits around the work. It also stops the data model from becoming a catalog of every object anyone has ever stored in an enterprise system. Factories already have enough of those.
94
00:08:15,000 --> 00:08:23,000
I think of the model as factory grammar. Words alone don't form a useful sentence. You need rules that tell you what connects to what, and what the connection means.
95
00:08:23,000 --> 00:08:31,000
In the same way, a product record, machine record, and order record don't describe a production situation until the model can express their relationship.
96
00:08:31,000 --> 00:08:43,000
The model may state that a product revision requires a process step that process step may run on a resource under stated conditions, and the language becomes precise enough for people and systems to ask the same question and reach for the same facts.
97
00:08:43,000 --> 00:08:53,000
That doesn't mean you need one giant central table containing every fact from every application. In fact, that approach usually creates a large copy of confusion. The model describes meaning across the factory.
98
00:08:53,000 --> 00:09:08,000
The systems that create, hold, and update the data still have their own jobs, which leads to a distinction that clears up a lot of architecture conversations. The model isn't the same thing as the platform that stores or moves the data. The model is not the data platform.
99
00:09:08,000 --> 00:09:20,000
This distinction saves a lot of wasted architecture work. Microsoft Fabric, a data lake, a SQL database, and a historian all handle data in useful ways, but none of them can decide what a work center means in your plant.
100
00:09:20,000 --> 00:09:34,000
Think about their actual jobs. A historian collects high frequency process values and machine events over time. A SQL database supports structured application data and controlled queries. A data lake keeps data from many systems in its original form and supports later analysis.
101
00:09:34,000 --> 00:09:47,000
Microsoft Fabric brings together ingestion storage analytics, governance, real-time data, and reporting in one connected environment. Those are storage and movement layers. They help you bring data together, retain its history, control access, and make it available for analysis.
102
00:09:47,000 --> 00:10:02,000
If your factory needs data from MES, ERP, maintenance, quality, and IoT sources in one place, that platform work matters. It is real work, and it often takes more effort than people expect. Still, a platform only knows what you tell it. Suppose you load ERP production orders into Fabric.
103
00:10:02,000 --> 00:10:09,000
You also load MES execution records, maintenance work orders, quality results, and machine states from the historian.
104
00:10:09,000 --> 00:10:19,000
This now contains more factory data than any person could read in a lifetime, which sounds impressive right up until someone asks a plain operational question, can order 2.847 run on another machine before the end of this shift.
105
00:10:19,000 --> 00:10:25,000
The answer doesn't emerge because all the source tables now sit in the same place. The answer depends on links and rules that may not exist in any one table.
106
00:10:25,000 --> 00:10:33,000
Which product revision does the order use? Which operation needs to run next? Which resources have approval for that operation? What tool and operator skill are required?
107
00:10:33,000 --> 00:10:49,000
Does the machines current state permit the job? Moving records into one platform does not create those answers. ERP and MES also need to stay in their proper roles. ERP typically acts as a system of record for demand, orders, materials, and plan supply. It manages commitments and transactions at the business level.
108
00:10:49,000 --> 00:10:59,000
MES acts as a system of record for execution. It records what the plant released, started, completed, held, scrapped, inspected, and produced on the shop floor.
109
00:10:59,000 --> 00:11:15,000
Neither system needs to contain every fact about the other. Trying to turn ERP into a live machine data system creates awkward processes. Trying to turn MES into the owner of commercial order commitments causes a different set of problems. They operate at different speeds with different users and with different forms of control.
110
00:11:15,000 --> 00:11:27,000
Integration works better when each system keeps ownership of the data it creates and the decisions it is built to support. The industrial data model sits across those sources. It gives a common meaning to the records without claiming that one application should replace all the others.
111
00:11:27,000 --> 00:11:35,000
It can state that an ERP work center relates to a physical asset in maintenance, a production unit in MES, and a set of tags in the control environment.
112
00:11:35,000 --> 00:11:48,000
It can also preserve the fact that these aren't always a one-to-one match. That detail matters. One ERP work center might include several machines. One physical machine might appear as several equipment objects in an MES because different operations run on it.
113
00:11:48,000 --> 00:11:59,000
A model needs room for that kind of factory logic. A simple lookup table may work at first, but it often breaks once real production conditions enter the picture. This is where data platform projects can drift into false confidence.
114
00:11:59,000 --> 00:12:06,000
Someone connects every source, builds a clean shared layer, publishes a Power BI report with consistent colors, filters, and drill parts.
115
00:12:06,000 --> 00:12:13,000
The report looks orderly and the data load runs every hour. Then a planner asks why a work order shows available when the line can't run it.
116
00:12:13,000 --> 00:12:19,000
The dashboard may pull the available status from inventory while quality holds a release status somewhere else.
117
00:12:19,000 --> 00:12:26,000
Or the dashboard may show a machine as idle because the historians sees no cycle signal while maintenance has already locked the asset out.
118
00:12:26,000 --> 00:12:31,000
Clean reporting can still sit on confused data. That isn't a criticism of fabric Power BI historians or SQL.
119
00:12:31,000 --> 00:12:42,000
It is a warning about assigning them a job they can't perform alone. A platform can host the model. It can enforce parts of the model through data rules, govern definitions, access control, and shared semantic layers.
120
00:12:42,000 --> 00:12:52,000
It can support the queries and workflows built on top of the model. But the plan still needs to define the things, identities, states, and relationships that give the data operational meaning.
121
00:12:52,000 --> 00:12:57,000
As a Microsoft MVP, I spend a lot of time around conversations that start with platform choice.
122
00:12:57,000 --> 00:13:04,000
Azure or on-premise, fabric, or a separate lake, SQL or a graph database. Those choices matter, but they come after a harder question.
123
00:13:04,000 --> 00:13:06,000
What does the factory need to understand about itself?
124
00:13:06,000 --> 00:13:15,000
Once you can answer that, you can select the right storage and integration approach. Without it, you risk building a very well-managed collection of records that still can't explain what depends on what.
125
00:13:15,000 --> 00:13:24,000
So let's move beyond where the data sits and look at why isolated records struggle when factory questions depend on relationships. Why tables alone often break down?
126
00:13:24,000 --> 00:13:29,000
I'm not here to bash relational tables. They run a lot of manufacturing and they run it well.
127
00:13:29,000 --> 00:13:37,000
ERP needs reliable transactions for orders, stock movements, purchase receipts, and financial records, and MES needs clean records of each production step.
128
00:13:37,000 --> 00:13:43,000
Relational databases give those systems structure, control, and predictable query patterns, and for controlled reporting, that's fine.
129
00:13:43,000 --> 00:13:48,000
You can calculate output by shift, compare scrap by product family, or track downtime by work center.
130
00:13:48,000 --> 00:13:54,000
When the question stays inside a known set of records with a stable reporting rule, a table model is often the right tool.
131
00:13:54,000 --> 00:14:01,000
The problem starts when a production question crosses relationships that change over time. Take a single product revision. It might need 10 operations, some in strict sequence.
132
00:14:01,000 --> 00:14:08,000
One operation could allow two approved machines, another needs a specific tool, and a later inspection step might depend on the route that came before it.
133
00:14:08,000 --> 00:14:13,000
Those aren't simple links, they carry conditions. Now add the resource side. A machine can have multiple capabilities.
134
00:14:13,000 --> 00:14:21,000
It might run a product family only within a certain size range, only with a specific fixture only after calibration, or only when an operator with the right approval is assigned.
135
00:14:21,000 --> 00:14:28,000
That same machine can show as available in a capacity table while being completely unsuitable for the order you actually care about.
136
00:14:28,000 --> 00:14:33,000
That isn't bad data. It's normal factory logic. A production order brings even more dependencies.
137
00:14:33,000 --> 00:14:43,000
It links to a customer date, a product revision, a routing, material lots, work instructions, quality requirements, open operations, and real capacity on the shop floor.
138
00:14:43,000 --> 00:14:49,000
A late order doesn't just need a machine. It needs a valid path through a set of constraints.
139
00:14:49,000 --> 00:14:59,000
Tables can represent all of this at least in theory. You can create product tables, routing tables, operation tables, resource tables, capability tables, qualification tables, tooling tables, and mapping tables between them.
140
00:14:59,000 --> 00:15:03,000
Then join those inquiries and build views to hide some complexity.
141
00:15:03,000 --> 00:15:09,000
Many good manufacturing systems do exactly that. The real question is where the meaning lives once the model reaches daily use.
142
00:15:09,000 --> 00:15:13,000
In too many plans, each report rebuilds part of that relationship logic.
143
00:15:13,000 --> 00:15:20,000
Power BI joins orders to operations, a planning spreadsheet joins machines to capability lists, and a quality report adds a separate filter for approved revisions.
144
00:15:20,000 --> 00:15:26,000
Meanwhile, a supervisor keeps another list of exceptions because the formal mapping doesn't cover what really happens during a shift.
145
00:15:26,000 --> 00:15:32,000
The logic starts to spread. One report treats a machine capability as current if the asset exists in master data.
146
00:15:32,000 --> 00:15:38,000
Another excludes machines with an open maintenance order. A third uses an old extract of operator qualifications.
147
00:15:38,000 --> 00:15:50,000
Each report looks reasonable by itself, yet they don't answer the same question the same way. That's how business logic quietly moves out of the operating model and into reports, workbooks, stored queries, and people's personal notes.
148
00:15:50,000 --> 00:15:55,000
You can recognize this pattern when a report needs a long explanation before anyone trusts it.
149
00:15:55,000 --> 00:16:03,000
Use this filter but ignore that route. This machine shows as valid except for these parts. The route changed last month, so use the new a tab.
150
00:16:03,000 --> 00:16:18,000
At that point, the report carries factory rules the shared model never captured. Relationships don't stay fixed. Product revisions change, new tools gain approval, qualifications expire, engineering changes alter routes, and machines return from maintenance with different operating conditions.
151
00:16:18,000 --> 00:16:29,000
Production doesn't pause while every downstream spreadsheet gets repaired. None of this means you should throw out relational data or replace every database with a graph database that would be another expensive way to avoid the real work.
152
00:16:29,000 --> 00:16:34,000
Relational systems are still the right place for transactions, source records, and well-defined queries.
153
00:16:34,000 --> 00:16:42,000
What you need is a relationship layer that makes cross-domain factory rules explicit, governed, and reusable. Instead of rebuilding them every time someone asks a tough production question.
154
00:16:42,000 --> 00:16:52,000
Think of that layer as the place where you state the allowed connections. Which product revision can follow? Which route? Which operation can use which resource? And under what conditions that relationship holds?
155
00:16:52,000 --> 00:17:02,000
Once those relationships have a shared home, reports can consume them instead of recreating them, planning tools can test them, and people can review and change them with a clear owner.
156
00:17:02,000 --> 00:17:11,000
The factory no longer depends on every analyst rebuilding the same mental map from tables. So where should you start? A practical structure begins with three things. Every plant already understands.
157
00:17:11,000 --> 00:17:18,000
The product you need to build, the process required to build it, and the resources that can perform the work.
158
00:17:18,000 --> 00:17:32,000
PPR, product process resource. PPR gives us a practical starting point. It doesn't try to describe every possible fact in a plant, and that's a good thing. Nobody needs another model that takes two years to explain and still can't help with Tuesday afternoon's disruption.
159
00:17:32,000 --> 00:17:39,000
PPR asks three plain questions. What are we building? How does the work need to happen? And what can perform that work under real production conditions?
160
00:17:39,000 --> 00:17:50,000
The product part describes more than the item a customer sees on an invoice. It includes the product variant, the revision currently approved for production, the bill of material, and the quality needs attached to that version.
161
00:17:50,000 --> 00:18:03,000
That level of detail changes what production can do. Two parts might share the same family name and still need different materials, inspection points, or machining limits, because one carries a newer revision or a customer specific configuration.
162
00:18:03,000 --> 00:18:14,000
The process part describes how the plant turns that product into something shippable, the root through production, the sequence of operations, setup needs, inspections, and rules that control the work.
163
00:18:14,000 --> 00:18:27,000
A root isn't simply a list of machines, and it describes the work itself. One operation may cut material, the next may form it, and a later step may require cleaning, curing, assembly, inspection, or a sign off before the part can move forward.
164
00:18:27,000 --> 00:18:38,000
Some steps can happen in more than one place, while others must happen in a strict order with a set, wait time, or quality check in between. Then you have the resource part. A resource is anything that performs work or enables work to happen.
165
00:18:38,000 --> 00:18:46,000
A machine, a tool, a fixture, an operator, a station, a production line, all the capacity available during a shift.
166
00:18:46,000 --> 00:18:56,000
In a real plant, these things don't act alone. A capable machine without the right fixture may not be capable for the order in front of you, and a ready line without a trained operator may still be unable to run.
167
00:18:56,000 --> 00:19:06,000
This is why PPR works as a starting point. It connects product demand to a feasible process, and then connects that process to the resources that can execute it.
168
00:19:06,000 --> 00:19:11,000
Think about a release production order. It demands a specific product in a specific version by a certain date.
169
00:19:11,000 --> 00:19:22,000
PPR lets the model trace from that demand to the process steps required for that version. Then from each process step to the machines tooling, people, and capacity that can actually support it, the word actually matters.
170
00:19:22,000 --> 00:19:32,000
A planning system may see idle time on a work center, but PPR asks whether that work center can perform the required operation for this exact product version with the required conditions in place.
171
00:19:32,000 --> 00:19:48,000
That changes a generic capacity question into a production question. Say a plant needs to produce a valve body. The product definition identifies the material grade, revision, and inspection requirements, while the process defines the machining, cleaning, pressure test, and final inspection steps.
172
00:19:48,000 --> 00:19:57,000
The resources include approved machining centers, test rigs, fixtures, trained operators, and the available shift time. Now the factory can connect the dots between IT and OT.
173
00:19:57,000 --> 00:20:07,000
An ERP order doesn't remain only in ERP order. It links to work that needs to happen. A machine alarm doesn't remain only in alarm. It relates to the process steps and product demand that depend on that resource.
174
00:20:07,000 --> 00:20:12,000
That creates the basis for real time visibility that reaches beyond a red status light.
175
00:20:12,000 --> 00:20:28,000
PPR also gives different teams a shared structure without pretending they do the same job. Engineering can own parts of the product definition. Production engineering can own routes and process rules. Maintenance can own asset condition. Operations can manage current execution. And quality can control inspection and release rules.
176
00:20:28,000 --> 00:20:37,000
The model connects their information without flattening their responsibilities into one giant master data spreadsheet, which would be a strange thing to call progress.
177
00:20:37,000 --> 00:20:51,000
PPR isn't a complete model of a factory. It doesn't by itself cover every supplier, relationship, energy reading, transport, route, commercial contract, safety procedure, or financial rule. A plant may later connect those things when a real decision needs them.
178
00:20:51,000 --> 00:20:56,000
PPR gives you the structural core, what you build, how you build it, and what performs the work.
179
00:20:56,000 --> 00:21:12,000
That core holds up because most factory decisions eventually touch all three. A quality issue affects a product, a process step, and often a resource. A late order affects product demand, process timing, and capacity. A machine failure becomes urgent only when it interrupts a process required by a product.
180
00:21:12,000 --> 00:21:18,000
So before we go further into the model, let's start with the product side first. Product means more than a part number.
181
00:21:18,000 --> 00:21:27,000
Here's the problem most manufacturers don't talk about. A part number helps you order, plan, and identify a product, but it doesn't tell the factory enough to build it safely.
182
00:21:27,000 --> 00:21:35,000
Think about a part number that stays the same in your ERP system while engineering releases a revision with a tighter tolerance, a different surface spec, or a new material.
183
00:21:35,000 --> 00:21:42,000
The customer still asks for the same part, but production may now need a different setup, revised work instructions, or a tighter inspection step.
184
00:21:42,000 --> 00:21:51,000
That gap causes more trouble than you'd expect. If your system only sees the part number, it can treat two versions as interchangeable when they're not. Configuration adds another layer to the problem.
185
00:21:51,000 --> 00:21:59,000
A product family might share a base part number while customer options change the material, dimensions, test requirements, labeling, or packaging rules.
186
00:21:59,000 --> 00:22:08,000
From sales, that looks like one product with a few options. On the shop floor though, it can mean different work, different checks, and different rules for what can run where.
187
00:22:08,000 --> 00:22:18,000
Batch rules matter too. Some products need full traceability from raw material through production and inspection to shipment. Others may need parts from one material lot to stay together.
188
00:22:18,000 --> 00:22:26,000
A regulated product may require proof that a specific test happened on approved equipment under an approved procedure. A part number alone can't hold that whole story.
189
00:22:26,000 --> 00:22:36,000
So the product side of an industrial data model needs a clearer identity. It needs to say which product we mean, which revision applies, which configuration version, and which rules travel with that definition.
190
00:22:36,000 --> 00:22:50,000
Engineering owns part of that definition, often through a product lifecycle management system or PLM. That system holds the design intent. Drawings, CAD models, material requirements, tolerances, technical specifications, and approved revisions.
191
00:22:50,000 --> 00:22:56,000
But engineering intent isn't yet a production ready definition. A drawing can state what the final part must look like.
192
00:22:56,000 --> 00:23:08,000
Production still needs to know how to build it in this plant with this equipment under current quality rules. That includes the bill of material, work instructions, process parameters, inspection requirements, packaging rules, and any approved deviations.
193
00:23:08,000 --> 00:23:24,000
Those details need controlled links. The bill of material tells you what goes into the product. Even that needs care because a design bill of material may group components according to engineering logic, while a manufacturing bill of material needs to support how materials are issued, staged, consumed, and traced on the floor.
194
00:23:24,000 --> 00:23:39,000
The view is wrong. They answer different questions. Work instructions bring the product definition closer to the person doing the work. They can describe torque values, setup conditions, test limits, visual checks, or handling limits. Specifications may sit in documents, quality systems, or engineering repositories.
195
00:23:39,000 --> 00:23:49,000
If those documents don't connect clearly to the product revision and the production context where they apply, people can easily use a correct document for the wrong version of the product.
196
00:23:49,000 --> 00:24:01,000
Product genealogy takes this further. It records how a finished product connects back through the materials, batches, subassemblies, and production history that contributed to it. When quality finds an issue, the question is rarely just which part number is affected.
197
00:24:01,000 --> 00:24:09,000
It becomes which actual units use this material lot, followed this revision, passed through this inspection step, and reached which customer orders.
198
00:24:09,000 --> 00:24:14,000
That needs identity at the level where the plant can trace real work, not just catalog items.
199
00:24:14,000 --> 00:24:28,000
A revision change shows why this becomes operational so quickly. Imagine engineering approves a tighter tolerance on one feature. The product keeps its broad identity, but the revised version may now need a more capable machine, a different measurement method, or an added inspection.
200
00:24:28,000 --> 00:24:40,000
An existing route may no longer be valid for that revision, even though it worked perfectly for the prior one. If the model doesn't represent that relationship, planning can schedule a part onto a resource that looks free but can't meet the updated requirement.
201
00:24:40,000 --> 00:24:52,000
The error may only appear during setup, inspection, or worse, after production. So the model needs to connect product identity across PLM, ERP, MS, and quality systems without pretending those systems use the same identifiers by default.
202
00:24:52,000 --> 00:25:04,000
PLM may hold an engineering part and revision. ERP may hold a material master and planning version. MES may hold a production definition tied to an operation. Quality may hold an inspection plan with its own reference.
203
00:25:04,000 --> 00:25:13,000
The model needs to state how these references relate, which one owns the definition and from which date or approval point it applies. That gives people a way to answer a basic but difficult question.
204
00:25:13,000 --> 00:25:26,000
Are we building the right version of the product under the rules that apply today? The product definition gives the factory something precise to build, but it only becomes operational when it connects to the process that tells the factory how that product must move through production.
205
00:25:26,000 --> 00:25:29,000
Process captures, how work should happen.
206
00:25:29,000 --> 00:25:38,000
A product definition tells you what needs to leave the factory. The process definition tells people and systems how it gets there. Most people first think of a root and that's part of it.
207
00:25:38,000 --> 00:25:49,000
A root may list the operations or product needs, the order of those operations, and the areas where the work can happen. But a real process contains more than a chain of steps. It includes setup before production starts.
208
00:25:49,000 --> 00:26:02,000
Inspection points that decide whether work can continue, handoffs between areas, and approved paths for rework when something fails to check. The process also describes rules that may never appear in a simple root number. Take a component that needs coating after machining.
209
00:26:02,000 --> 00:26:14,000
The root can state machining, cleaning, coating and inspection. Yet the process may require the part to stay clean after washing, enter the coating booth within a defined time, cure for a set period, and pass inspection before packing.
210
00:26:14,000 --> 00:26:26,000
Those conditions are part of the work, not background notes. Sequence matters for the same reason. Some operations can move in parallel, others cannot. You may need to complete a heat treatment before final machining. You may need to inspect the critical feature before assembly hides it.
211
00:26:26,000 --> 00:26:32,000
And if a process needs a certain cure time, a plan I can't just compress that delay because a customer date looks uncomfortable.
212
00:26:32,000 --> 00:26:44,000
Infectories also deal with changeovers. A machine might process several product families, but moving from one family to another can require cleaning, new settings, a tool change, first off approval or material purge.
213
00:26:44,000 --> 00:26:50,000
If the root only says both products can run on the same machine, it leaves out the part that determines whether the schedule works in practice.
214
00:26:50,000 --> 00:27:01,000
Approval points belong in the process too. A quality check may release a batch to the next operation. An engineering deviation may permit a rework path. A supervisor may need to approve a setup after an unusual change.
215
00:27:01,000 --> 00:27:15,000
These aren't just administrative stops. They control whether the factory can proceed without creating a bigger issue downstream. The process model should hold those rules in a form that people can trace and systems can use. It doesn't need to replace every work instruction or quality document.
216
00:27:15,000 --> 00:27:27,000
It needs to link the process step to the instructions, criteria, and approval conditions that apply. There's also a distinction that causes confusion in many architecture discussions. A process definition describes how work should happen.
217
00:27:27,000 --> 00:27:39,000
A live production order describes a specific instance of work happening now. Think of the process definition as the approved recipe for a product version. It defines the operations, order, inputs, outputs, controls, and permitted branches.
218
00:27:39,000 --> 00:27:50,000
A production order takes that definition and applies it to a real demand. A quantity, a due date, a material lot, a current production state, and a specific point in time. The MES records that live execution.
219
00:27:50,000 --> 00:27:58,000
It can record that operation 20 started at 0910, paused for a quality hold, restarted after approval, and completed on a given resource.
220
00:27:58,000 --> 00:28:08,000
It can record actual quantities, scrap, operator actions, downtime, and deviations from the expected path. That record matters because the planned process and the actual path aren't always identical.
221
00:28:08,000 --> 00:28:16,000
An order may follow the normal route, or it may take an approved rework loop after inspection. It may wait between steps because a downstream area is full.
222
00:28:16,000 --> 00:28:26,000
An operator may record a setup delay, quality may place material on hold. The MES captures what the plan did, while the process definition provides the controlled frame for what the plan is allowed to do.
223
00:28:26,000 --> 00:28:32,000
You need both. If you only keep the planned process, you can't learn from real execution or trace why an order moved differently.
224
00:28:32,000 --> 00:28:38,000
If you only keep execution records, you lose the reference point that tells you whether the work followed the approved process in the first place.
225
00:28:38,000 --> 00:28:45,000
In practice, process knowledge often spreads across too many places. A routing may sit in ERP. Detailed operations may live in MES configuration.
226
00:28:45,000 --> 00:28:56,000
Set-up steps may live in a PDF, quality gates may sit in a separate quality system. The most useful exception rule may exist only as an instruction passed from an experienced operator to a new colleague during shift handover.
227
00:28:56,000 --> 00:29:04,000
That last part deserves respect. People build local knowledge because production needs to keep moving and formal systems rarely capture every real condition on day one.
228
00:29:04,000 --> 00:29:11,000
Still, when process rules live mainly in documents, memory, and isolated system settings, it becomes hard to ask a joined-up question.
229
00:29:11,000 --> 00:29:17,000
Can this order follow an alternate path? Does that path need extra inspection? Which change over rule applies? Who approved the exception?
230
00:29:17,000 --> 00:29:25,000
A shared industrial model doesn't remove the need for detailed instructions or MES control. It gives those process facts a common structure and links them to the things they govern.
231
00:29:25,000 --> 00:29:34,000
Every process step, though, eventually reaches a practical limit. Someone or something has to perform it. Resource means capability, not just an asset tag.
232
00:29:34,000 --> 00:29:40,000
Here's something that trips up a lot of factory models. Someone or something has to actually perform each process step.
233
00:29:40,000 --> 00:29:48,000
When you hear resource, you usually think of a machine, a machining center, a press, a furnace, a robot or a test rig. Machines absolutely matter.
234
00:29:48,000 --> 00:30:00,000
But production depends on a much wider set. Tools, fixtures, operators, stations, lines, conveyors, automated guided vehicles, and all the equipment that moves material from one operation to the next.
235
00:30:00,000 --> 00:30:10,000
A process can fail to run because any one of those resources is missing. Imagine a machine that looks free for the next job. The schedule sees capacity and maintenance sees a healthy asset.
236
00:30:10,000 --> 00:30:20,000
But the fixture needed for that product is still attached to another machine. The measuring tool has passed its calibration date and the only qualified operator doesn't start until the night shift.
237
00:30:20,000 --> 00:30:27,000
The machine is free, but the operation is not feasible, and that distinction needs to live in the model. An asset register tells you what the plant owns.
238
00:30:27,000 --> 00:30:37,000
Asset number, manufacturer, serial number, location, service history, maintenance plan, and that helps maintenance manage the physical asset over its life.
239
00:30:37,000 --> 00:30:47,000
But production needs a different view. Production needs to know what that asset can do in a specific setting. For example, a machine might support a product family, but only within a certain diameter range.
240
00:30:47,000 --> 00:30:59,000
The machine is a material only within a proof tool set or process a particular product variant only after a set of validation. And it could run the same operation at two different levels of precision with different cycle times and inspection needs.
241
00:30:59,000 --> 00:31:05,000
That is capability. Describing what a resource can perform under stated conditions. Instead of asking is this machine there?
242
00:31:05,000 --> 00:31:11,000
It asks, can this resource do this work for this product under the rules that apply now?
243
00:31:11,000 --> 00:31:26,000
The asset register gives you the identity of the physical thing while the capability model gives you the production meaning of that thing. In practical terms, a production line might appear as one resource for planning, but underneath it includes several physical machines, a robot cell, a fixture set, and a test station.
244
00:31:26,000 --> 00:31:37,000
One failed component may stop the whole line, while another may reduce it to a slower mode. And if the model only holds a single line name with a green or red status, planners can't see which work remains possible. The same applies to people.
245
00:31:37,000 --> 00:31:49,000
An operator is not just labour capacity. They may hold approval for a welding process, a product group, a test method, or a safety controlled area. Qualifications can expire, some tasks need two people and some can only happen under supervision.
246
00:31:49,000 --> 00:31:56,000
Those rules may feel administrative until a late order needs to move to another shift and nobody with the required approval is available.
247
00:31:56,000 --> 00:32:01,000
Then the qualification becomes part of capacity.
248
00:32:01,000 --> 00:32:12,000
Tools and fixtures carry their own constraints. A fixture may fit one machine but not another. A cutting tool may support one material grade and not the next, and a test device may need calibration before it can release a product.
249
00:32:12,000 --> 00:32:20,000
Material handling equipment can matter just as much, especially when a heavy part needs a specific crane, pallet system, or transport route between operations.
250
00:32:20,000 --> 00:32:26,000
Factories often know these facts locally, but the challenge is making them available when a planning or execution decision needs them.
251
00:32:26,000 --> 00:32:42,000
Designed capability and current state also need to stay separate. A machine may have the designed capability to run a certain process, and that remains part of its long term production profile, but today it might be under maintenance, out of calibration, waiting for a safety check, or running with a temporary restriction.
252
00:32:42,000 --> 00:32:48,000
Current state tells you whether the capability is usable now and neither fact overrides the other.
253
00:32:48,000 --> 00:33:02,000
A machine in perfect mechanical condition may still lack the tool required for a product, a calibrated test station may sit idle because the trained operator is absent and a qualified operator may be available, but the product material hasn't reached the right location.
254
00:33:02,000 --> 00:33:08,000
Feasibility comes from all the conditions working together, and this is why raw capacity figures can create false comfort.
255
00:33:08,000 --> 00:33:17,000
Eight free hours on a work centre only matter if the work centre can run the order, the right people and tooling are present, the shift permits the work and safety rules allow the setup.
256
00:33:17,000 --> 00:33:28,000
Rear-source on another site may appear as spare capacity in an enterprise report, but moving work there can require transport, different approvals, material release or a customer agreement.
257
00:33:28,000 --> 00:33:40,000
Even within one plant, the distance between a machine and the material can affect whether a short term plan is realistic, so a resource model leads to described capacity, capability, condition, qualification, tooling, shift, safety and location.
258
00:33:40,000 --> 00:33:49,000
Not every use case needs every detail on day one, but if a missing detail can turn a proposed plan into an impossible plan, it belongs in the scope of the decision.
259
00:33:49,000 --> 00:33:57,000
PPR starts to earn its place when these resource facts connect to the product and process objects around them, the relationships carry the meaning.
260
00:33:57,000 --> 00:34:04,000
PPR becomes useful when the links between product, process and resource carry the same care as the objects themselves.
261
00:34:04,000 --> 00:34:13,000
A product requires a process, that process requires resources and a resource supports a product only under conditions the plant has approved.
262
00:34:13,000 --> 00:34:19,000
Those links turn three lists into a model that can answer a production question. Think of an order for a particular product revision.
263
00:34:19,000 --> 00:34:28,000
The product definition points to the required operation and that operation points to the resources that may perform it, but the link can't simply say "machine B can do operation 20",
264
00:34:28,000 --> 00:34:39,000
it may need to say "machine B can do operation 20 for this product family within this revision range, with fixture F12 installed, after first of approval and with a qualified operator assigned".
265
00:34:39,000 --> 00:34:46,000
That sounds like more detail because it is more detail and it is also the detail people already check when they move, work around the plant.
266
00:34:46,000 --> 00:34:52,000
The difference is whether they check it from memory through a series of calls or through a shared model that records the rule and its owner.
267
00:34:52,000 --> 00:35:04,000
Most factory relationships are many to many. One product may run through several approved process routes, one process operation may run on several resources and one resource may support many products but not every product and not under every condition.
268
00:35:04,000 --> 00:35:16,000
There is really one permanent route that applies in all cases. A standard route may name the preferred work center because it gives the best cycle time or the normal material flow while another resource may act as an approved alternative during a breakdown.
269
00:35:16,000 --> 00:35:26,000
A third may run the same part only after a process engineer signs off on a setup and the model needs to express those distinctions without turning every possible option into a free for all.
270
00:35:26,000 --> 00:35:35,000
That is why simple availability creates bad suggestions and available machine may not carry approval for the product revision and an approved machine may need a tool that is already committed elsewhere.
271
00:35:35,000 --> 00:35:45,000
The tool may be present but the operator qualification could limit the shift and even when all those conditions hold, the process may require an inspection plan, the alternate area can't support.
272
00:35:45,000 --> 00:35:50,000
Each link adds a condition and together they define what the plant may safely do.
273
00:35:50,000 --> 00:35:57,000
Take an approved machine product pairing it should not just connect a machine name to a part number but state which product definition applies.
274
00:35:57,000 --> 00:36:01,000
The operation involved the limits of the approval and when the approval takes effect.
275
00:36:01,000 --> 00:36:06,000
If the product revision changes that pairing may remain valid, need review or become invalid.
276
00:36:06,000 --> 00:36:15,000
The same pattern applies to tools, a milling operation may require a tool type while a specific product variant requires a more precise tool configuration.
277
00:36:15,000 --> 00:36:27,000
The relationship can state that the tool is required for the operation that it fits a resource and that it supports the product under stated process limits so a plan can distinguish between a machine that looks free and a machine that can complete the work.
278
00:36:27,000 --> 00:36:30,000
Worker qualification follows the same logic.
279
00:36:30,000 --> 00:36:42,000
An operator may qualify for a general process but a controlled product family may require extra approval. A model can link the person to the qualification, the qualification to the operation and the operation to the product scope where it applies.
280
00:36:42,000 --> 00:36:47,000
Giving operations a clearer basis for staffing decisions than a generic trained flag.
281
00:36:47,000 --> 00:36:50,000
Inspection plans belong in the relationship layer 2.
282
00:36:50,000 --> 00:36:58,000
A product revision may need a certain check after a certain operation and if an alternate route changes the operational resource, the inspection requirement may change with it.
283
00:36:58,000 --> 00:37:03,000
The model should connect the product, the process step, the inspection rule and the approval state.
284
00:37:03,000 --> 00:37:09,000
Otherwise the order may move successfully through production while the proof of conformance falls behind it.
285
00:37:09,000 --> 00:37:12,000
These relationships change, that is normal.
286
00:37:12,000 --> 00:37:27,000
Engineering releases a revision, quality approves a new inspection method, production engineering validates an alternate machine, maintenance places a temporary limit on equipment, a tool reaches the end of its approved life and none of those events should require someone to rewrite the factory model from scratch.
287
00:37:27,000 --> 00:37:32,000
Instead they should update controlled relationships with dates, versions, conditions and clear ownership.
288
00:37:32,000 --> 00:37:39,000
That is a more useful way to frame data modeling work. Don't begin with a long list of fields for machines, orders and materials.
289
00:37:39,000 --> 00:37:45,000
Begin with the decision question, can this order run there under which rules? That one question forces useful detail into the open.
290
00:37:45,000 --> 00:37:54,000
Which product version, which operation, which resource, what tool, which qualification, what approval and what current condition prevents or permits the move?
291
00:37:54,000 --> 00:38:01,000
Once the model can answer that question, it starts to represent the factory in a way that supports real work rather than just better records.
292
00:38:01,000 --> 00:38:09,000
So let's take those relationships back to the failed work center, because that is where the difference between a list of data and an industrial model becomes very practical.
293
00:38:09,000 --> 00:38:11,000
Replanning with a PPR model.
294
00:38:11,000 --> 00:38:13,000
Let's go back to that stopped work center.
295
00:38:13,000 --> 00:38:16,000
With a PPR model in place, you skip the hunting and the phone calls.
296
00:38:16,000 --> 00:38:25,000
The work center already knows exactly which operations it can run, which product, families and revisions it supports, and which live orders are waiting next.
297
00:38:25,000 --> 00:38:27,000
That changes the first question you ask.
298
00:38:27,000 --> 00:38:35,000
Instead of wondering who knows what this machine runs, the team can check which open operations currently need that capability, and which orders will miss their due dates if the resource stays down.
299
00:38:35,000 --> 00:38:45,000
Say the model finds six open operations tied to that work center, two belong to product families that only run there, so those orders may have to wait for repair or go through an approved exception process.
300
00:38:45,000 --> 00:38:49,000
The other four have alternate paths, but each path comes with its own conditions.
301
00:38:49,000 --> 00:38:52,000
One alternative machine might support the operation, but only for the older revision.
302
00:38:52,000 --> 00:38:57,000
Another supports the current revision, but the required fixture is still sitting on the failed work center.
303
00:38:57,000 --> 00:39:02,000
A third resource might have the tool and the approval, but no qualified operator is scheduled for the rest of the shift.
304
00:39:02,000 --> 00:39:07,000
These aren't edge cases, they're the conditions that decide whether a re-planning option actually exists.
305
00:39:07,000 --> 00:39:10,000
The model can pull all of that into one decision view.
306
00:39:10,000 --> 00:39:22,000
The affected order, the product revision, the next operation, the approved alternate resources, required tooling, current tool location, operator skills, material state, and customer due date.
307
00:39:22,000 --> 00:39:28,000
A planner still needs to weigh those facts, but at least they don't have to rediscover every link while the clock is running.
308
00:39:28,000 --> 00:39:30,000
Now availability alone doesn't solve the problem.
309
00:39:30,000 --> 00:39:38,000
A capacity report might show two machines with open time, one idle because it's waiting for material, the other busy but ready for a change over.
310
00:39:38,000 --> 00:39:43,000
Neither answer tells you whether that machine can legally and safely perform the next operation on this order.
311
00:39:43,000 --> 00:39:48,000
Feasibility comes first. A feasible alternative meets the product, process, and resource conditions.
312
00:39:48,000 --> 00:39:54,000
It supports the right revision, can perform the required operation, and has the tool available and movable if needed.
313
00:39:54,000 --> 00:40:01,000
The machine is in an allowed state, the operator qualification covers the work, and any quality or engineering approval is already in place.
314
00:40:01,000 --> 00:40:08,000
Only then does the planner start comparing capacity, setup time, order priority, transport time, and the effect on other customer commitments.
315
00:40:08,000 --> 00:40:11,000
That sequence prevents a common failure in automated planning.
316
00:40:11,000 --> 00:40:20,000
The tool finds an empty slot, and then someone discovers later that the proposed assignment only worked in the model because the model ignored a constraint that production treats as non-negotiable.
317
00:40:20,000 --> 00:40:24,000
A PPR model doesn't turn a difficult choice into an automatic one.
318
00:40:24,000 --> 00:40:36,000
Sometimes every option creates a problem. You might protect one late order by delaying another, choose a longer setup to avoid a missed customer date, all decide that repair is less disruptive than moving the work.
319
00:40:36,000 --> 00:40:42,000
The planner owns that decision. What the model does is reduce search time and cut the risk that a hidden constraint slips through.
320
00:40:42,000 --> 00:40:47,000
It gives the planner a clearer set of options, plus the conditions and consequences behind each one.
321
00:40:47,000 --> 00:40:51,000
That's decision support, not an excuse to hand production control to a black box.
322
00:40:51,000 --> 00:40:59,000
There's also a useful distinction between ERP, an enterprise resource planning system, and APS, which stands for Advanced Planning and Scheduling.
323
00:40:59,000 --> 00:41:05,000
ERP records the business plan. It holds demand, order dates, materials, plans, supply, and the commercial commitments around production.
324
00:41:05,000 --> 00:41:15,000
Depending on the system and configuration, it might support rough scheduling and basic capacity planning, but ERP wasn't built to continuously test detailed shop floor constraints during a disruption.
325
00:41:15,000 --> 00:41:26,000
APS tools focus more directly on finite capacity, sequencing, setup rules, alternative resources, and schedule trade-offs. They can calculate possible schedules faster than a human team working from separate lists.
326
00:41:26,000 --> 00:41:30,000
Still, an APS can only plan against the rules and facts it receives.
327
00:41:30,000 --> 00:41:44,000
Feeded generic work centers and broad capacity numbers, and you get a very tidy plan that operators cannot run, feed it a maintained PPR structure, and the planning engine can test routes against real resource capability, tooling, qualifications, product revisions, and approved alternatives.
328
00:41:44,000 --> 00:41:50,000
That same structure also gives MS the context it needs during execution when a schedule meets the actual conditions of a shift.
329
00:41:50,000 --> 00:41:54,000
So PPR links planning and execution without pretending they're the same activity.
330
00:41:54,000 --> 00:42:01,000
ERP records commitments, APS evaluates schedules, MS records and controls work on the floor, and maintenance manages asset condition.
331
00:42:01,000 --> 00:42:05,000
The industrial model connects the decision context across those boundaries.
332
00:42:05,000 --> 00:42:11,000
At this point, the relationships become too numerous for people to follow as a chain of table joins in one off-mappings.
333
00:42:11,000 --> 00:42:17,000
You've got orders connected to products, revisions, operations, resources, tools, people, approvals, and current events.
334
00:42:17,000 --> 00:42:22,000
That's where a knowledge graph becomes practical, from PPR to an industrial knowledge graph.
335
00:42:22,000 --> 00:42:28,000
Once you need to follow all those links together, an industrial knowledge graph becomes a useful way to represent the model.
336
00:42:28,000 --> 00:42:32,000
A knowledge graph is a connected model of factory entities and the relationships between them.
337
00:42:32,000 --> 00:42:37,000
Each entity gets its own identity, and the graph records how it relates to others.
338
00:42:37,000 --> 00:42:43,000
The point isn't to create a clever picture of the plant, it's to let people and software follow the links that explain a production situation.
339
00:42:43,000 --> 00:42:46,000
Picture one order that needs a decision after a work center stops.
340
00:42:46,000 --> 00:42:54,000
The order connects to a product which connects to the revision approved for production, that revision connects to a process definition, and the process contains operations.
341
00:42:54,000 --> 00:43:03,000
Each operation connects to resources that can perform it, along with the tools, worker approvals, documents, inspections, and current conditions that apply.
342
00:43:03,000 --> 00:43:08,000
A graph keeps those connections explicit. In graph language, the entities are often called nodes.
343
00:43:08,000 --> 00:43:16,000
For a factory, a node might represent a product and operation a machine, a tool and order, a material batch, a worker, a document, or an event from the shop floor.
344
00:43:16,000 --> 00:43:20,000
That part is fairly simple. The useful part sits in the links between the nodes.
345
00:43:20,000 --> 00:43:25,000
A product requires an operation, and that operation produces a semi-finished part.
346
00:43:25,000 --> 00:43:28,000
A machine can perform an operation, and a tool supports that machine.
347
00:43:28,000 --> 00:43:33,000
An order depends on a material batch, a product revision gets inspected by a specific plan.
348
00:43:33,000 --> 00:43:38,000
A maintenance event affects a resource. Each link has a name, and each name carries meaning.
349
00:43:38,000 --> 00:43:42,000
That may sound like a small design choice, but it changes what the model can answer.
350
00:43:42,000 --> 00:43:45,000
If you only store an object list, you can find a machine or an order.
351
00:43:45,000 --> 00:43:53,000
Once the model records that an order depends on a process step, and that step can run on certain machines, you can trace the impact of a failure through actual work.
352
00:43:53,000 --> 00:43:59,000
You no longer have to ask someone to remember the chain. Let's make that concrete, say a maintenance event records that a machine cannot run.
353
00:43:59,000 --> 00:44:05,000
The graph follows from that machine to the operations affected by its loss, then from those operations to open orders.
354
00:44:05,000 --> 00:44:11,000
From each order, it finds the product revision, required documents, material batches, and possible alternatives.
355
00:44:11,000 --> 00:44:17,000
The answer won't always be simple. It might show that an alternate machine exists, but a required tool remains unavailable.
356
00:44:17,000 --> 00:44:22,000
Or it might show that an order can move, while another order on the alternate machine now faces a date risk.
357
00:44:22,000 --> 00:44:25,000
That's exactly the kind of connected consequence a plan needs to see.
358
00:44:25,000 --> 00:44:29,000
A graph doesn't claim that every linked item belongs in one source system.
359
00:44:29,000 --> 00:44:37,000
The MES should still record execution, ERP should still manage demand and supply records, maintenance should still own maintenance work, and quality should still control quality records.
360
00:44:37,000 --> 00:44:40,000
A knowledge graph doesn't replace those systems.
361
00:44:40,000 --> 00:44:47,000
Trying to make it replace them would just create a second less trusted version of each system, instead it connects the facts those systems own.
362
00:44:47,000 --> 00:44:51,000
This matters because a factory question rarely respects application boundaries.
363
00:44:51,000 --> 00:44:58,000
A question like which customer orders face risk from this machine stop, crosses maintenance, production, planning, quality, and product data.
364
00:44:58,000 --> 00:45:04,000
Each system holds part of the answer. The graph provides a shared way to follow the relationships between those parts.
365
00:45:04,000 --> 00:45:07,000
PPR gives that graph a strong starting structure.
366
00:45:07,000 --> 00:45:09,000
Product tells the graph what the factory needs to build.
367
00:45:09,000 --> 00:45:13,000
Process tells it how the work must happen. Resource tells it what can perform the work.
368
00:45:13,000 --> 00:45:17,000
From there, the graph can extend outward, wherever a real use case needs more context.
369
00:45:17,000 --> 00:45:25,000
You might connect batches to products for traceability, link documents to operations so people can find the right instruction, and tie events to machines in orders.
370
00:45:25,000 --> 00:45:28,000
So a production interruption carries business context.
371
00:45:28,000 --> 00:45:32,000
You might also connect workers to approvals where staffing affects feasibility.
372
00:45:32,000 --> 00:45:38,000
That's broader factory context, built around an operational question rather than copied in because a source table exists.
373
00:45:38,000 --> 00:45:42,000
A graph approach also handles the fact that relationships can carry their own details.
374
00:45:42,000 --> 00:45:49,000
An approved relationship between a resource and an operation may apply only to certain product revisions, locations, date ranges, or operating conditions.
375
00:45:49,000 --> 00:45:52,000
The relationship isn't just a line between two names.
376
00:45:52,000 --> 00:45:55,000
It records the rule that governs whether the connection applies.
377
00:45:55,000 --> 00:46:09,000
That gives teams a clearer way to ask questions across domains, which open orders depend on this tool, which products use material from this batch, which machines can perform this operation under the current revision, which work instructions apply to the orders now waiting at inspection.
378
00:46:09,000 --> 00:46:13,000
Those questions feel natural because people already think in connected relationships.
379
00:46:13,000 --> 00:46:17,000
The graph gives that thinking a formal structure that software can query and reuse.
380
00:46:17,000 --> 00:46:19,000
Still, keep the distinction clear.
381
00:46:19,000 --> 00:46:23,000
A knowledge graph describes a model and a way of working with connected facts.
382
00:46:23,000 --> 00:46:27,000
It doesn't dictate one database product, one semantic standard, or one architecture pattern.
383
00:46:27,000 --> 00:46:32,000
So next, we need to separate the industrial model from the graph technology that makes it underneath it.
384
00:46:32,000 --> 00:46:35,000
A knowledge graph is a model not a magic database.
385
00:46:35,000 --> 00:46:41,000
Here's what most teams get wrong. A knowledge graph can use a graph database, but those aren't the same decision.
386
00:46:41,000 --> 00:46:45,000
Graph databases store entities and their links in a way built for connected queries.
387
00:46:45,000 --> 00:46:50,000
So if you regularly trace from one object out with through relationships, the query patterns feel natural.
388
00:46:50,000 --> 00:46:56,000
Start with a machine, find its operations, then the affected orders and product definitions behind them.
389
00:46:56,000 --> 00:47:03,000
A graph database can be a good technical fit, but you can also build a semantic layer while keeping most of your data in relational databases,
390
00:47:03,000 --> 00:47:06,000
lake houses, document stores, or source applications.
391
00:47:06,000 --> 00:47:10,000
Your industrial model doesn't manage just because the data sits in SQL tables.
392
00:47:10,000 --> 00:47:15,000
What really matters is whether relationships, identities, rules, and ownership are clearly defined, so teams can reuse them.
393
00:47:15,000 --> 00:47:22,000
Storage comes after meaning not before. For some use cases, a well-governed relational model with managed views answers the question perfectly.
394
00:47:22,000 --> 00:47:28,000
For others, a graph engine simplifies impact analysis, traceability, or search across many connected objects.
395
00:47:28,000 --> 00:47:36,000
The choice depends on the decision you need to support, the volume and change rate of your data, what your team already knows, and how your existing systems work.
396
00:47:36,000 --> 00:47:44,000
Don't begin with which graph database should we buy? Start with which factory question keeps forcing people to stitch together facts from five places.
397
00:47:44,000 --> 00:47:48,000
Then ask what the model needs to represent so that question gets a reliable answer.
398
00:47:48,000 --> 00:47:55,000
Once you know that you can judge whether a graph store helps or whether another approach does the job with less operational overhead.
399
00:47:55,000 --> 00:48:00,000
Now the word ontology tends to make a useful conversation sound like it needs a philosophy degree.
400
00:48:00,000 --> 00:48:04,000
In practical terms, an ontology is just a formal set of shared definitions.
401
00:48:04,000 --> 00:48:11,000
It defines the types of things in a domain and the relationships that connect them, for example, that a process operation differs from a physical machine,
402
00:48:11,000 --> 00:48:18,000
that an inspection result relates to an inspection activity, and that resource capability is not the same as current resource state.
403
00:48:18,000 --> 00:48:23,000
That precision helps when several teams and systems need to exchange meaning without quietly changing it.
404
00:48:23,000 --> 00:48:26,000
An ontology also catches nonsense relationships.
405
00:48:26,000 --> 00:48:38,000
If your model says a product revision requires an operation that follows industrial logic, but if someone tries to link a machine directly as the revision of a product, the model can flag the error before it slips into downstream reports.
406
00:48:38,000 --> 00:48:41,000
You don't need an ontology for every small reporting task.
407
00:48:41,000 --> 00:48:59,000
Formal definitions bring effort. People have to agree on terms, manage versions and maintain the model as the plant changes. That work pays off when the same concepts travel across engineering, production, quality, maintenance, and enterprise data, especially when several applications need to reason from the same definitions.
408
00:48:59,000 --> 00:49:02,000
RDF and OWL sit further along that formal path.
409
00:49:02,000 --> 00:49:09,000
RDF represents facts as simple statements, subject, relationship, object, like a product revision requires an operation.
410
00:49:09,000 --> 00:49:13,000
AudioL adds formal rules about classes, properties, and logical constraints.
411
00:49:13,000 --> 00:49:20,000
These standards help where semantic precision, data exchange, and automated reasoning justify the learning curve. They aren't a badge of maturity.
412
00:49:20,000 --> 00:49:30,000
If the plant just needs to answer a focused scheduling question and your team has no experience with semantic technologies, starting with a large RDF and OWL program can delay the work by months.
413
00:49:30,000 --> 00:49:36,000
You may end up with elegant definitions and no answer for the planner who needs to move and order before shift change.
414
00:49:36,000 --> 00:49:48,000
Formal semantics should earn their place. Use them when you need shared meaning across complex domains, controlled interoperability, with outside parties, or rule-based reasoning that simpler data structures can't handle well.
415
00:49:48,000 --> 00:49:56,000
Keep the representation lighter when the use case is narrow, stable, and well served by existing tools. There's no award for picking the most academic option.
416
00:49:56,000 --> 00:50:07,000
I've seen teams treat a knowledge graph as a destination. They pull master data from every system, create nodes for every asset, material, order, and document, then link records just enough to call it a graph.
417
00:50:07,000 --> 00:50:13,000
Soon they have a graph museum. Copies of everything, ownership of nothing, and answers to very few real questions.
418
00:50:13,000 --> 00:50:18,000
The data looks connected, but the links lack conditions, version control, or an owner keeping them current.
419
00:50:18,000 --> 00:50:27,000
Copying a machine record doesn't create production knowledge, and copying a product record doesn't create a usable relationship to work. So keep the work tied to a decision people already struggle with.
420
00:50:27,000 --> 00:50:40,000
Add objects only when they explain that decision. Add relationships only when they change what the factory can safely do, and give each relationship an owner and a way to change it when engineering, quality, or operations changes the rule. That keeps the model grounded.
421
00:50:40,000 --> 00:50:49,000
And you don't have to invent all its vocabulary from scratch. Manufacturing already has standards that provide useful building blocks for describing equipment, materials, people, and production operations.
422
00:50:49,000 --> 00:50:53,000
ISA95 gives a common industrial frame.
423
00:50:53,000 --> 00:51:03,000
ISA95 helps because it gives manufacturing teams a shared frame for talking about information across the enterprise and the control system. That sounds dry, but the problem it addresses is familiar.
424
00:51:03,000 --> 00:51:15,000
ERP teams talk about materials, orders, and plan supply. MES teams talk about operations, execution, and production records, and OT teams work with equipment, control signals, states, and alarms.
425
00:51:15,000 --> 00:51:19,000
All of them describe the same factory event using different words and levels of detail.
426
00:51:19,000 --> 00:51:24,000
ISA95 doesn't remove those differences. It gives a reference point so teams can translate with less guesswork.
427
00:51:24,000 --> 00:51:33,000
The standard sits at the boundary between business planning and manufacturing operations, helping distinguish enterprise activities like demand planning from production activities on the shop floor.
428
00:51:33,000 --> 00:51:42,000
That boundary matters because an ERP order isn't a PLC command, and a machine state isn't automatically a business status. Each system still does its own job.
429
00:51:42,000 --> 00:51:47,000
Within that frame, ISA95 includes concepts that fit naturally into an industrial data model.
430
00:51:47,000 --> 00:51:54,000
Material describes what enters, moves through, or leaves production, equipment describes physical and logical resources.
431
00:51:54,000 --> 00:52:04,000
Personnel covers people in their roles, process segments describe parts of work that transform material or carry out production, and production operations connect the work to real execution.
432
00:52:04,000 --> 00:52:11,000
A process segment might describe machining, mixing, assembly, or inspection. It doesn't need to map to one exact machine or order.
433
00:52:11,000 --> 00:52:17,000
It describes a repeatable piece of production work that later connects to product needs, resource capability, and actual performance.
434
00:52:17,000 --> 00:52:27,000
At that fits well with PPR, the product side connects to material definitions and requirements, the process side to process segments and production operations, and the resource side to equipment and personnel with their roles.
435
00:52:27,000 --> 00:52:29,000
You don't need a perfect one-to-one mapping.
436
00:52:29,000 --> 00:52:35,000
A real plant uses work centers, cells, lines, stations, and assets in ways that don't fit textbook terms.
437
00:52:35,000 --> 00:52:44,000
One side treats a packaging line as a planning resource while maintenance tracks each motor beneath it, another uses one machine for several logical units in MES.
438
00:52:44,000 --> 00:52:47,000
Your model should preserve that real operating structure.
439
00:52:47,000 --> 00:52:50,000
ISA95 gives you a vocabulary for asking clear questions.
440
00:52:50,000 --> 00:52:54,000
Is this a material definition, a lot, or material available at a location?
441
00:52:54,000 --> 00:52:58,000
Is this an equipment class, a physical asset, or a work unit for scheduling?
442
00:52:58,000 --> 00:53:02,000
Is this a planned operation, a production request, or a production response?
443
00:53:02,000 --> 00:53:07,000
These distinctions prevent confusion before data reaches a report or planning tool. Consider a status conflict.
444
00:53:07,000 --> 00:53:15,000
ERP shows an order as released, MES shows the first operation not started, and the equipment system shows the machine in maintenance.
445
00:53:15,000 --> 00:53:18,000
Each status can be correct because they refer to different things.
446
00:53:18,000 --> 00:53:21,000
Without clear definitions, someone sees three conflicting answers.
447
00:53:21,000 --> 00:53:30,000
With a shared frame, the team identifies what each status describes and how they relate, much more useful than forcing one status field to describe the whole factory.
448
00:53:30,000 --> 00:53:36,000
Isa95 also helps during integration because it gives IT, OT, and operations teams terms to use in workshops.
449
00:53:36,000 --> 00:53:40,000
Instead of arguing over field names, they discuss the object behind the field.
450
00:53:40,000 --> 00:53:46,000
What counts as equipment? Which system owns the current state? Where does a process segment begin and end?
451
00:53:46,000 --> 00:53:48,000
Which event records actual production performance?
452
00:53:48,000 --> 00:53:52,000
The conversation shifts from interface mapping to factory meaning.
453
00:53:52,000 --> 00:53:56,000
Still, ISA95 is a reference model, not an implementation blueprint.
454
00:53:56,000 --> 00:54:05,000
It won't tell you how to name every table or structure every API. Treating it as a rigid template creates a model that looks correct on paper, but feels foreign to the people running the plant.
455
00:54:05,000 --> 00:54:10,000
Standards should reduce translation work. Not create a second language. Only the architecture team understands.
456
00:54:10,000 --> 00:54:21,000
Use the parts that help your decision scope. Map PPR concepts into ISA95, whether vocabulary clarifies ownership and relationships, but keep local terms where they carry real operational meaning and document the mapping.
457
00:54:21,000 --> 00:54:30,000
The goal is a model people can use during a disruption, not an audit of how closely the plant matches a reference book. Isa95 gives us the enterprise to operations frame.
458
00:54:30,000 --> 00:54:36,000
Next we need to bring machine side semantics into that same model because a raw tag value still doesn't explain what equipment is doing.
459
00:54:36,000 --> 00:54:39,000
OPC-UA connects signals to industrial meaning.
460
00:54:39,000 --> 00:54:46,000
Here's the thing. You already have Isa95 as a framework above the machine, but that model still needs a way to pull meaning up from the machine side.
461
00:54:46,000 --> 00:54:59,000
Without reducing everything to anonymous tags, that's where OPC-UA does more than just connect signals. A lot of plants already use some form of OPC-UA to read data from equipment, connect SCADA systems, or pass signals through an edge gateway, and that's a good start.
462
00:54:59,000 --> 00:55:05,000
But moving raw values from a PLC into a historian or the cloud doesn't tell anyone downstream what those values actually mean.
463
00:55:05,000 --> 00:55:10,000
Consider a tag called MCH-L-Z-Z-11ST-S-M-12 that carries a value of 1.
464
00:55:10,000 --> 00:55:20,000
The person close to that PLC knows it means the machine is running in automatic mode, another team sees it as available, and a data engineer just gets an integer every few seconds.
465
00:55:20,000 --> 00:55:25,000
None of those views creates shared meaning on its own. OPC-UA can carry more structure with the signal.
466
00:55:25,000 --> 00:55:32,000
Instead of exposing a loose pile of tag names, an OPC-UA server can describe objects, their properties, methods, events, and relationships.
467
00:55:32,000 --> 00:55:35,000
A machine appears as a name piece of equipment with a defined state.
468
00:55:35,000 --> 00:55:42,000
An alarm carries type, severity, time, source, and acknowledgement state. A measurement comes with its engineering unit, range, and source context.
469
00:55:42,000 --> 00:55:46,000
That makes a real difference. A temperature value without a unit is just a number.
470
00:55:46,000 --> 00:55:53,000
But when you link it to a named zone, a sensor, a unit of measure, and a time, the receiving system knows exactly what it can safely do.
471
00:55:53,000 --> 00:55:59,000
Store it, compare it against limits connected to the right resource, or show it to the person responsible for that equipment.
472
00:55:59,000 --> 00:56:06,000
That structure comes from OPC-UA information models, which define common ways to describe industrial things and their data.
473
00:56:06,000 --> 00:56:14,000
Companion specifications extend that for specific domains, equipment types, or industries, so vendors and users can describe familiar concepts in a consistent way.
474
00:56:14,000 --> 00:56:18,000
Not every machine exposes a full semantic model, the quality varies.
475
00:56:18,000 --> 00:56:28,000
And that's okay. A modern machine might give you structured objects, events, and condition data, while an older PLC only exposes addresses and bits that the control team understands.
476
00:56:28,000 --> 00:56:42,000
The plant still needs both. Legacy PLCs control equipment that runs perfectly well and earns its place every day, so replacing them, just because their data arrives with confusing names, would be a poor use of capital, and could create more production risk than it removes.
477
00:56:42,000 --> 00:56:52,000
Instead, an adapter or edge gateway maps those raw PLC signals to a cleaner equipment model, stating that this bit means running, that bit means fault, and these values belong to one asset.
478
00:56:52,000 --> 00:57:02,000
Patches the identity that maintenance, MES, and the wider industrial model use. That mapping is not glamorous work. It's where IT and OT convergence becomes real.
479
00:57:02,000 --> 00:57:13,000
The edge layer stays close to the equipment, respecting timing, network, and control limits, collecting what the approved use case needs, applying mappings where needed, and sending data upward through controlled channels.
480
00:57:13,000 --> 00:57:28,000
Then the cloud or enterprise layer can use that data for history, analysis, planning context, or governed access. Identity needs to survive that journey. A machine might have a PLC name, an OPC, UA Node Identifier, an asset number, and maintenance, a work center code in ERP, and a resource ID in MES.
481
00:57:28,000 --> 00:57:35,000
Each of those references is useful locally, but the industrial model has to say whether they refer to the same physical resource or explain where they differ.
482
00:57:35,000 --> 00:57:46,000
Without that identity mapping, a cloud event may report a fault under one name while planning sees capacity under another, so the systems look connected, but the factory still can't connect the event to the work at effects.
483
00:57:46,000 --> 00:57:59,000
Security and ownership matter just as much as semantics. OT teams own the control environment because equipment availability, safe operation, and predictable response come first, so a data project can't treat a PLC network like an ordinary office data source.
484
00:57:59,000 --> 00:58:04,000
You can't scan it freely or add polling load without understanding the operational impact.
485
00:58:04,000 --> 00:58:14,000
Data collection needs agreed boundaries. You need to decide which signals can leave the cell at what rate, who approves mapping changes, where credentials live, and what happens if the connection to the cloud fails.
486
00:58:14,000 --> 00:58:30,000
The equipment must keep running safely even when the data path disappears. That means the data architecture should read from production without taking control by accident using segmented networks, managed identities, least privileged access, and change control that includes OT, not just a cloud deployment checklist.
487
00:58:30,000 --> 00:58:42,000
When this works, machine data arrives with enough context to become part of a wider factory model. A fault connects to a known resource, a measurement ties to the right process area, and an alarm carries a source that both people and systems recognize.
488
00:58:42,000 --> 00:58:50,000
But machine context alone still doesn't define a digital twin, asset administration shell and the digital asset view.
489
00:58:50,000 --> 00:59:03,000
Now that a machine signal can carry known identity and clear a meaning, the next question is how to describe the asset itself. It needs to travel between systems, suppliers, engineering tools, and operations without each party inventing a new profile for the same physical thing.
490
00:59:03,000 --> 00:59:11,000
The asset administration shell usually shortened to AAS comes from the German industry 4.0 work on standard digital representations of industrial assets.
491
00:59:11,000 --> 00:59:25,000
It's a structured digital envelope for an asset, a machine, a tool, a production cell, or even a product. The physical asset stays where it is, while the AAS gives it a digital representation with a stable identity and organized information that other systems can reference.
492
00:59:25,000 --> 00:59:34,000
That sounds like an asset record in a maintenance system, and yes, there's overlap. A maintenance record holds manufacturer, serial number, location, service history, and plans.
493
00:59:34,000 --> 00:59:43,000
AAS can reference those same kinds of facts, but its purpose goes beyond a single application. It provides a common way to package and exchange asset information across system boundaries.
494
00:59:43,000 --> 00:59:53,000
The structure uses submodels. Each submodel groups one type of information about the asset. One might contain technical details like dimensions, rated power, interfaces, or configuration data.
495
00:59:53,000 --> 01:00:05,000
Another links to manuals, certificates, drawings, and service documents, a condition submodel holds or references condition data, while a capability submodel describes the work the asset can perform under defined limits.
496
01:00:05,000 --> 01:00:17,000
Life cycle information can sit in the same wider structure, including commissioning details, maintenance starters, approved changes, ownership, or the current stage in the asset's life, but you don't need to put every fact inside one AAS instance.
497
01:00:17,000 --> 01:00:28,000
In many cases, the AAS points to information that remains in the system responsible for it. That distinction keeps the architecture sane. The AAS is not a demand to copy every source record into a second place.
498
01:00:28,000 --> 01:00:39,000
It gives systems a shared structure for finding and interpreting asset information, while the maintenance system, MES, engineering repository, or historian can continue to own the records they manage.
499
01:00:39,000 --> 01:00:55,000
For a resource in a PPR model, this becomes useful quickly. PPR tells us a resource needs more than just an asset tag. It needs production meaning. That means knowing whether it can perform a certain operation, which product versions it supports, and what tooling, process limits, or approval conditions apply.
500
01:00:55,000 --> 01:01:04,000
An AAS can hold or link to the technical and capability details that support those relationships, and the PPR model then connects that resource to product definitions and process steps.
501
01:01:04,000 --> 01:01:11,000
In practical terms, the AAS helps describe the resource, while PPR helps explain where that resource fits in production.
502
01:01:11,000 --> 01:01:21,000
Take a pressure test rig. Its AAS may identify the actual rig, its serial number, technical limits, current configuration, calibration information, and the documents that describe approved use.
503
01:01:21,000 --> 01:01:28,000
The industrial model can then link that test rig to the process operation it supports, the product revisions that require that test, and the inspection rules that apply.
504
01:01:28,000 --> 01:01:45,000
Those are separate concerns, but they belong together when someone needs to decide whether an order can proceed. AAS can also help when equipment comes from different suppliers. If each supplier provides asset data in a compatible structure, the plant spends less time translating manuals, technical properties, and equipment details into a private format.
505
01:01:45,000 --> 01:01:52,000
That can improve data exchange during commissioning, service, engineering, changes, and integration work, but the word "can" does some work there.
506
01:01:52,000 --> 01:02:00,000
A standard gives you a common format, but it doesn't force a supplier to expose complete data, keep it current, or map it to your plant's product and process rules.
507
01:02:00,000 --> 01:02:07,000
Two AAS implementations may both follow the same broad standard and still differ in the submodels they use, the quality of their data, and the detail they provide.
508
01:02:07,000 --> 01:02:11,000
Standards reduce some friction, but they don't remove the need for modeling decisions.
509
01:02:11,000 --> 01:02:20,000
The German industry 4.0 context matters, because AAS grew from a serious effort to make industrial assets more interoperable across company and system boundaries.
510
01:02:20,000 --> 01:02:30,000
That work has shaped a useful set of concepts and specifications, but no plant becomes integrated because somebody downloads a standard document and creates a folder called "Digital Twin".
511
01:02:30,000 --> 01:02:36,000
Integration starts with a real asset, a clear identity, a defined owner, and a decision that needs trust with the information.
512
01:02:36,000 --> 01:02:47,000
If a machine's AAS says it supports a process, the plant still needs to govern who approves that claim, what product scope it covers, when it applies, and how a temporary restriction changes the current production decision.
513
01:02:47,000 --> 01:02:57,000
The standard supports a shared form, but operations still applies the operating truth, so treat AAS as a structured digital asset view that can make equipment information easier to exchange, find and connect.
514
01:02:57,000 --> 01:03:06,000
It can support a wider industrial model, especially on the resource side, but it doesn't schedule orders, release batches, or decide whether a late customer order should take an alternate route.
515
01:03:06,000 --> 01:03:12,000
Those decisions need the asset view, connected to the product, and process context around it.
516
01:03:12,000 --> 01:03:22,000
Which leads us beyond one machine or one asset, toward the chain of information that connects engineering intent, production work, quality evidence, and later, life cycle decisions.
517
01:03:22,000 --> 01:03:25,000
The digital thread links life cycle decisions.
518
01:03:25,000 --> 01:03:35,000
Start with the asset view. It gives you a clean way to describe a machine or a tool, but a product story doesn't begin when it hits the first work center, and it doesn't end when it leaves the loading dock.
519
01:03:35,000 --> 01:03:45,000
Every function along the way holds a piece of that story. Engineering defines the product and releases revisions. Planning turns demand into production work. Production records, what actually happened.
520
01:03:45,000 --> 01:03:51,000
Quality records, whether the work met the conditions required. Maintenance tracks the state of the resources used along the way.
521
01:03:51,000 --> 01:03:58,000
And service may later need to know what the customer received, which configuration applied, and whether a field issue connects back to a production batch.
522
01:03:58,000 --> 01:04:08,000
That's where the digital thread comes in, the connector across the entire product life cycle. Context flows from engineering through planning and execution, then into quality, maintenance, and service.
523
01:04:08,000 --> 01:04:13,000
Each system keeps responsibility for the records it owns. That doesn't mean one giant application with a screen for every department.
524
01:04:13,000 --> 01:04:19,000
Most manufacturers already have systems that do specific jobs well. Engineering needs its own control design data.
525
01:04:19,000 --> 01:04:26,000
Production tools have to run at shift speed. Maintenance needs asset and work records. Quality needs controlled evidence. Service needs product and customer history.
526
01:04:26,000 --> 01:04:36,000
Force all of that into one system, and you usually create a new problem. Just one with a larger implementation budget. In practical terms, the digital thread is the connected context between those systems.
527
01:04:36,000 --> 01:04:47,000
You start with one fact in one domain, and trace the related facts that sit elsewhere. That depends on shared identity, controlled relationships, and clear rules about which definition applies at a given time.
528
01:04:47,000 --> 01:04:58,000
A product revision shows why this matters. Say engineering approves a revised material specification for a component. The part number may still look familiar to sales and planning. But the revision reaches far beyond a document in the engineering system.
529
01:04:58,000 --> 01:05:05,000
Production planning may need a new routing or a changed operation time. The work instruction might have to walk operators through a new handling rule.
530
01:05:05,000 --> 01:05:18,000
Resource approvals could need another look because only certain machines can process the revised material. Quality may need a different inspection plan or tighter acceptance limits. Every one of those changes travels. When those systems don't connect, the plan can end up in a dangerous middle state.
531
01:05:18,000 --> 01:05:32,000
Engineering believes the new revision is released. ERP plans the order. MES runs an order instruction. Quality applies a prior inspection rule. Nobody intended that mismatch, but the links between the decisions were missing or unclear. The digital thread makes those dependencies visible.
532
01:05:32,000 --> 01:05:43,000
It connects a product revision to the process definition approved for it. That process connects to the work instructions used on the floor, the resource approvals that permit work, and the inspection rules that prove conformance.
533
01:05:43,000 --> 01:05:51,000
When a revision changes, teams can trace every downstream definition that needs review before production starts. That doesn't remove change control, and it doesn't mean the paperwork goes away.
534
01:05:51,000 --> 01:06:02,000
What it does is give change control a map of everything a revision actually touches. The part most plants are missing. Traceability runs the other way too. Suppose quality finds a defect in a finished product.
535
01:06:02,000 --> 01:06:17,000
The question starts with a customer return, a serial number, or a batch identifier. From there the business traces back through the inspection evidence, production order, actual operations, operator or equipment records where relevant, material lots, and the product revision that governs the build.
536
01:06:17,000 --> 01:06:32,000
Maintenance may then ask whether a resource condition or recent intervention is involved. Engineering may need to check whether a revision introduced a new risk. Service may need to identify other units that share the same configuration or production history. That's life cycle traceability, and it does more than satisfy an audit.
537
01:06:32,000 --> 01:06:42,000
It lets your team investigate a real issue without rebuilding the product story from email threads, exported files, and conversations with whoever happens to remember the week in question.
538
01:06:42,000 --> 01:06:48,000
Those people still matter of course, a model can't replace their judgment, but the factory shouldn't have to rely on memory for basic relationships.
539
01:06:48,000 --> 01:06:59,000
PPR gives the digital thread a practical backbone. PPR stands for product process resource. Product carries the engineering definition the factory must build. Process translates that definition into approved work.
540
01:06:59,000 --> 01:07:11,000
Resource connects that work to the people, equipment, tools, and conditions that perform it as execution happens, quality and maintenance information connect back to those same relationships. This is where engineering intent meets shop floor execution.
541
01:07:11,000 --> 01:07:28,000
Without that structure, a digital thread becomes a loose collection of links between documents and records. With PPR underneath it, the thread can follow the actual production logic, which version of the product required which process, which resource performed it, under which approved conditions, and what evidence the plant recorded.
542
01:07:28,000 --> 01:07:38,000
That gives you a more useful foundation for the next term, people reach for way too early. The digital twin. A digital twin needs a model before it needs live data.
543
01:07:38,000 --> 01:07:48,000
Let's cut through the hype for a second. A digital twin is simply a representation tied to something real. One machine, a production line, a process step, or a wider production system.
544
01:07:48,000 --> 01:08:05,000
The word gets thrown around loosely and that creates confusion fast. A stream of sensor values from a machine is useful, but it's not automatically a twin. It becomes part of a twin once the system knows which physical asset, produce those values, what the asset does, where it sits in the production flow and which rules shape its normal operation.
545
01:08:05,000 --> 01:08:15,000
Take a packaging machine as an example. Its twin includes a stable structure, identity, location, equipment type, connected stations, supported operations, and an approved operating range.
546
01:08:15,000 --> 01:08:27,000
That structure doesn't change every second. It just gives the asset a place in the factory model. Then you have live state. It tells you whether the machine is running, stopped, blocked, starved, insetup, or under maintenance.
547
01:08:27,000 --> 01:08:35,000
Plus the current speed, the active alarm, and the job sitting at the machine right now. Live state changes often, and it tells you what's happening in this exact moment.
548
01:08:35,000 --> 01:08:47,000
Then there's historical behavior, how that machine performed across prior shifts, which fault patterns came before a stop, how long particular changeovers actually take, and whether the real cycle time has drifted from the planned one.
549
01:08:47,000 --> 01:08:53,000
Historical behavior gives the twin memory. Now there are rules. A machine may only run a product with a certain format set.
550
01:08:53,000 --> 01:08:59,000
A line may need a cleaning step between product groups, a process may require a quality release before material moves to the next area.
551
01:08:59,000 --> 01:09:07,000
Those rules tell the model what should happen, what may happen, and what should trigger attention. A usable twin brings all of those parts together.
552
01:09:07,000 --> 01:09:14,000
Structure, live state, history, and rules. They don't need to sit in one physical database, and they don't need to update at the same rate.
553
01:09:14,000 --> 01:09:22,000
A machine name and serial number may change rarely. A status signal may update every few seconds. Quality evidence may only appear when an operation ends.
554
01:09:22,000 --> 01:09:32,000
The twin connects those facts around one defined object or process. Without that structure, live telemetry becomes just another signal feed. You can collect thousands of points from a line and still struggle with a basic question.
555
01:09:32,000 --> 01:09:42,000
Does this stop affect the customer order due tomorrow, or only work that can wait? The answer isn't inside, the vibration reading or the alarm code, it lives in the relationships around that data.
556
01:09:42,000 --> 01:09:59,000
Which leads to the real point. A digital twin needs an industrial model before it needs more live data. The model gives the twin its identity and boundaries. It can state that this temperature belongs to a particular oven zone that the oven supports a defined process that the process applies to a product family, and that specific orders currently depend on it.
557
01:09:59,000 --> 01:10:18,000
Now a live event carries operational meaning, scope matters too. A machine twin may focus on asset condition, technical state, and supported capability. A line twin includes buffers, handoffs, material flow, and the effect one station has on the rest of the line. A process twin may focus less on one asset and more on sequence, timing, quality conditions, and permitted routes.
558
01:10:18,000 --> 01:10:26,000
A production system twin can reach even further. Connecting multiple lines, shared tools, labor constraints, warehouse state, and production commitments.
559
01:10:26,000 --> 01:10:37,000
That scope gets useful really fast. It also expands the amount of structure ownership and upkeep required. So don't begin by claiming a factory wide digital twin start with the decision somebody actually needs to make.
560
01:10:37,000 --> 01:10:45,000
A maintenance lead might need to judge whether a fault calls for an immediate stop. A plan may need to see whether a constrained resource puts open orders at risk.
561
01:10:45,000 --> 01:10:55,000
A process engineer could need to test a changed operating rule. The decision defines the twin. That decision tells you which assets, process rules, relationships, life signals, and history belong in scope.
562
01:10:55,000 --> 01:11:03,000
And just as important, what you can leave out for now. A twin that supports one hard decision with trusted context beats a broad virtual factory nobody uses.
563
01:11:03,000 --> 01:11:08,000
That's usually because the model can't keep pace with production changes. This keeps the discussion honest too.
564
01:11:08,000 --> 01:11:17,000
A digital twin doesn't need to copy every aspect of the factory. It has to represent enough of the real system to support a defined purpose, while staying tied to the people and systems that maintain the facts.
565
01:11:17,000 --> 01:11:27,000
Once you start asking whether the model can predict the impact of a change before the plant ever commits to it, the next requirement becomes clear. Simulation needs the same kind of structure and it needs constraints it can trust.
566
01:11:27,000 --> 01:11:31,000
Simulation needs constraints it can trust.
567
01:11:31,000 --> 01:11:45,000
When you want to test a change before you commit to it on the floor simulation is what you use. It takes a model of your production and simulates how the system would behave if a condition changes, like a station slowing down, a buffer filling up or a change overtaking longer than planned.
568
01:11:45,000 --> 01:11:53,000
For a schedule that could mean testing whether moving in order to an alternate resource actually protects a customer date without creating a worst delay somewhere else.
569
01:11:53,000 --> 01:12:03,000
The answer you get depends on what the model knows. A useful line simulation needs the root, the material follows, the time each operation takes, the buffers between operations and the resources that do the work.
570
01:12:03,000 --> 01:12:09,000
It also needs shift patterns, planned downtime, setup rules and the constraints that control when work can move.
571
01:12:09,000 --> 01:12:17,000
If you want to test those rules and the simulation still produces an answer just not one the plant can use. Take a line with a heat treatment stage between two machining operations.
572
01:12:17,000 --> 01:12:25,000
The simulation knows the oven cycle time and the nominal speed of both cells. It predicts the line can recover from a delay by running the first cell faster.
573
01:12:25,000 --> 01:12:36,000
But the model doesn't include the curing time after heat treatment or the limited buffer space before final machining, material piles up where it can't wait and the proposed recovery plan falls apart.
574
01:12:36,000 --> 01:12:44,000
But it looks precise, that doesn't make it safe. Badmaster data creates a unique problem in simulation because the results can look believable.
575
01:12:44,000 --> 01:12:52,000
If a cycle time is outdated, a root is wrong or a resource capability no longer applies, the simulation produces clean numbers and need schedules.
576
01:12:52,000 --> 01:12:58,000
People trust it because it looks more formal than a spreadsheet. But the plant runs on current conditions, not need output.
577
01:12:58,000 --> 01:13:08,000
It differs from live monitoring, monitoring tells you what the factory is doing now or what it did a few minutes ago. A queue building, a machine stop, a drop in throughput that helps people see a problem.
578
01:13:08,000 --> 01:13:15,000
Simulation asks about possible futures. It creates a controlled model of the system then tests a change against the rules inside that model.
579
01:13:15,000 --> 01:13:22,000
You might simulate a different batch size, a lost shift, a new routing rule or a resource outage. The point isn't to replay the past.
580
01:13:22,000 --> 01:13:34,000
It's to explore consequences before production commits. Schedule optimization is a different activity. An optimization engine searches for a schedule that hits objectives, due dates, capacity limits, setup rules, material availability.
581
01:13:34,000 --> 01:13:42,000
Simulation can test how that proposed schedule behaves when variability, queues and operational rules come into play. In some architectures, the two work together.
582
01:13:42,000 --> 01:13:56,000
Optimization proposes a plan, then simulation tests whether the plan behaves acceptably under more realistic conditions. Neither tool can compensate for an unclear model. This brings us to PPR, where the architecture discussion turns into practical simulation input.
583
01:13:56,000 --> 01:14:04,000
The product definition tells the model what needs built and which version applies. The process definition gives the root, operation sequence, timings and process rules.
584
01:14:04,000 --> 01:14:16,000
The resource definition provides capacity, capability, availability and the conditions under which work can run. That gives simulation a structure it can actually use, say a planner wants to test whether an order can move to another work center after breakdown.
585
01:14:16,000 --> 01:14:27,000
PPR tells the simulation which alternate resource has approval for the required operation, which product revision it supports, what setup it needs and whether its shift pattern provides usable time.
586
01:14:27,000 --> 01:14:46,000
The simulation then tests the operational effect, instead of assuming every free hour is equal. The model also needs regular upkeep, a process engineer changes a root, a new fix jack spans what a machine can do, a quality rule adds an inspection hold, a maintenance restriction reduces usable capacity for a period. Each change can alter the simulation outcome.
587
01:14:46,000 --> 01:15:01,000
If those changes stay in a document, an email or one local system, the simulation gradually drifts away from the factory it claims to represent. Model governance keeps that drift in check. Someone needs to own the root definition resource capability, cycle time assumptions and the rule for when a change becomes active.
588
01:15:01,000 --> 01:15:10,000
That doesn't mean every update needs a committee meeting, it means the model needs a controlled path from a real production change to the simulation input that depends on it.
589
01:15:10,000 --> 01:15:22,000
Otherwise you get a virtual production system that performs beautifully because it no longer describes the real one, and AI puts even more pressure on this explicit context because AI can sound confident even when the rules it needs were never captured.
590
01:15:22,000 --> 01:15:25,000
AI cannot infer every factory rule.
591
01:15:25,000 --> 01:15:41,000
AI can help in a factory, but let's be precise about which help we mean. Industrial AI can classify images from a quality check, predict failures from condition data, search through approved manuals, summarize maintenance notes, compare production patterns and bring relevant facts to a planner faster than manual search.
592
01:15:41,000 --> 01:15:46,000
Those are useful jobs, but none of them mean the AI understands every rule that governs production.
593
01:15:46,000 --> 01:15:54,000
A model can detect an unusual bearing condition and estimate an increased chance of fault. That's a prediction about asset condition. Choosing the response is a different job.
594
01:15:54,000 --> 01:16:12,000
What would maintenance stop the machine now? Can the current order finish first? Which orders would move if production stops? Is there an approved alternate resource? Does the alternate route require a different inspection step? Can the work move without breaking safety, quality or customer commitments? A prediction alone doesn't answer those questions. This becomes even more important with generative AI.
595
01:16:12,000 --> 01:16:22,000
A chat interface can make a complex answer sound simple and sometimes that's helpful. A planner might ask which open orders are exposed if this work center stays down until tomorrow morning.
596
01:16:22,000 --> 01:16:30,000
The question could gather facts from the production plan, maintenance status, product definition, approved routes and order dates, then explain the situation in plain language.
597
01:16:30,000 --> 01:16:38,000
That only works when the AI has grounded access to approved facts and relationships. Grounded means the answer traces back to information the organization controls.
598
01:16:38,000 --> 01:16:45,000
The AI should know which product revision applies, which route is approved, which resources qualify and which constraints remain active.
599
01:16:45,000 --> 01:17:01,000
And also know where the information came from and whether it's current enough for the question. Otherwise the system fills gaps with language that sounds plausible. That's a real risk in manufacturing. A casual answer that invents an alternate route assumes a machine capability or ignores a quality hold can push a team toward a bad decision.
600
01:17:01,000 --> 01:17:08,000
The more fluent the response sounds, the easier it becomes to miss the missing fact underneath it. So AI needs a clear boundary around its role.
601
01:17:08,000 --> 01:17:16,000
A relevant context, rank options against stated rules, point out a dependency a person might miss under time pressure or draft a shift hand over note.
602
01:17:16,000 --> 01:17:26,000
It should not quietly become the authority that releases production. Safety approvals, quality release decisions and operational sign of belong in controlled workflows with named people, records and clear responsibility.
603
01:17:26,000 --> 01:17:35,000
A chat prompt is not a change control process. It doesn't replace an engineering approval and it doesn't turn an unverified suggestion into a safe instruction.
604
01:17:35,000 --> 01:17:40,000
It sounds obvious, but AI projects often blur the line because the conversation interface feels so natural.
605
01:17:40,000 --> 01:17:52,000
Someone asks, can we run this batch online too? The assistant answers confidently. Then the answer gets treated as knowledge. Even though the system never checked the current tooling, product specific approval or inspection requirement.
606
01:17:52,000 --> 01:17:59,000
The real question is what the AI actually knows, not whether it can generate a sentence. Ask what facts it can access, which source owns those facts?
607
01:17:59,000 --> 01:18:06,000
Does the system understand the relationships between the order, product, process, resource and current plant condition, which constraints can it not see?
608
01:18:06,000 --> 01:18:13,000
Then ask how a person checks the answer before anyone acts on it. Those questions turn AI from a demo into a controlled decision aid.
609
01:18:13,000 --> 01:18:20,000
There's a natural division of work here. Predictive models estimate likelihoods, optimization tools, test options against defined constraints.
610
01:18:20,000 --> 01:18:30,000
Predictive AI helps people find, explain and compare information around those tools. Human roles still approve work where safety, quality or commercial trade-offs require accountability.
611
01:18:30,000 --> 01:18:35,000
Each part does a different job. The industrial data model gives all of them a shared basis for reasoning.
612
01:18:35,000 --> 01:18:42,000
Without that basis, an AI assistant may have broad access to factory data and still lack the context needed to answer a simple operational question safely.
613
01:18:42,000 --> 01:18:51,000
Let's connect that to the Microsoft stack. This is where platforms like Microsoft Fabric can support the data flow and governance without pretending to create the factory model for you.
614
01:18:51,000 --> 01:19:00,000
Where Microsoft Fabric fits. Let's be clear about Fabric's role. It sits as the shared, data and analytics layer around your factory systems, not as a replacement for them.
615
01:19:00,000 --> 01:19:09,000
You already have ERP, MES, quality, maintenance and IoT sources, and Fabric can bring that data together so teams work from a governed view across those boundaries.
616
01:19:09,000 --> 01:19:16,000
It handles historical analysis, near real-time data, reporting and controlled access for different roles, all in one place.
617
01:19:16,000 --> 01:19:33,000
That matters because factory data never arrives from one clean source. Your ERP holds the order and the promised date, MES tracks the live operation status, the quality system records a hold against the material, maintenance reports that a resource can't run, and IoT data shows the event or condition that caused the stop.
618
01:19:33,000 --> 01:19:41,000
Fabric can ingest and organize those inputs without asking every team to abandon the systems they already depend on. That's a win nobody argues with, but the source still matters.
619
01:19:41,000 --> 01:19:48,000
When a planner sees a status in a report, they need to know where it came from. MES, ERP, quality or maintenance.
620
01:19:48,000 --> 01:19:54,000
They also need to know when it arrived, whether the source system still owns it and how it was changed on the way into the analytical layer.
621
01:19:54,000 --> 01:20:03,000
That's source lineage, and it's not an optional detail. Fabric can help teams keep that trail through the data flow, instead of treating every copied record like it just became a new master record.
622
01:20:03,000 --> 01:20:12,000
If an MES event feeds an operation report, that report should trace back to the execution record. If ERP supplies the due date, that relationship should stay clear too.
623
01:20:12,000 --> 01:20:22,000
Otherwise, your lakehouse becomes just another system people argue about. Here's the practical benefit. A data platform creates a controlled place to apply checks, map identifiers, manage access and prepare information for analysis.
624
01:20:22,000 --> 01:20:31,000
You can spot that one resource appears under different IDs across MES, maintenance and ERP. You can test whether a product revision shows up in the expected source.
625
01:20:31,000 --> 01:20:36,000
You can separate trusted data from data that still needs review. Fabric supports that work at scale.
626
01:20:36,000 --> 01:20:49,000
It's semantic models and Power BI help teams use common reporting definitions. A semantic model gives report builders a shared business layer, so they don't each write their own version of production order, good quantity, downtime or on time delivery.
627
01:20:49,000 --> 01:20:59,000
That reduces the kind of disagreement you've seen before, where one dashboard calculates output based on completed operations, while another uses posted goods receipts. Both look reasonable.
628
01:20:59,000 --> 01:21:06,000
But if nobody states which definition applies to which purpose production meetings turn into debates about the report instead of the factory.
629
01:21:06,000 --> 01:21:18,000
Shared definitions help, but they don't solve every operational question. A Power BI report can show that a work center stopped, how long it stopped and which orders sit behind it. That's exactly what a production manager needs for situational awareness.
630
01:21:18,000 --> 01:21:25,000
But when the question shifts to which alternate resource can run this operation for this product revision with the approved tool and qualified worker.
631
01:21:25,000 --> 01:21:36,000
The report needs a model that carries those relationships and conditions. Fabric doesn't create those PPR semantics automatically. It can store data, process it, govern access and present it through common analytics tools.
632
01:21:36,000 --> 01:21:44,000
It supports a semantic model for business reporting. It brings real time events together with operational and historical data. Those are real capabilities.
633
01:21:44,000 --> 01:22:04,000
Fabric cannot decide what a resource capability means in your plant. It can't know whether a machine can process a particular product revision unless somebody defines that relationship. It can't infer whether a tool approvals buyers after calibration, whether a route changed after an engineering release, or whether a local work center code refers to the same thing as an asset ID in another system.
634
01:22:04,000 --> 01:22:17,000
The plant teams need to define that meaning that work belongs to the people who own product definitions, process rules, resource capability, quality requirements and operational states. It can help turn those definitions into governed data structures and usable services.
635
01:22:17,000 --> 01:22:26,000
Data engineers build the pipelines, architects keep the parts connected. But the factory cannot outsource its own operating logic to a platform configuration. That's where many programs lose momentum.
636
01:22:26,000 --> 01:22:37,000
They load data into fabric, build polished reports, then discover the hard questions, still require calls, exports and the planner who knows which machine can really run the job. The platform did its job. The model didn't exist yet.
637
01:22:37,000 --> 01:22:45,000
Where relationship reasoning becomes central, you might add graph capable or semantic tools beside fabric. That could mean a graph database for connected impact analysis.
638
01:22:45,000 --> 01:22:54,000
A formal ontology where shared definitions need tighter control or a relationship service that exposes PPR rules to planning, simulation and AI tools.
639
01:22:54,000 --> 01:23:06,000
The technical choice depends on the question. Some factories get far with governed relational structures and carefully managed views. Others need to trace deeper chains across assets, orders, revisions, materials, documents and constraints.
640
01:23:06,000 --> 01:23:14,000
Fabric can remain the data and analytics foundation in either case, while the industrial model gives those facts the meaning needed for decisions.
641
01:23:14,000 --> 01:23:21,000
So let's follow that path in practical terms from a machine event at the edge through the systems and model that turn it into an informed production decision.
642
01:23:21,000 --> 01:23:31,000
A practical eye-to-art architecture journey. Let's follow a production event through the architecture because this is where the model stops being a design exercise and starts helping people deal with a real disruption.
643
01:23:31,000 --> 01:23:38,000
Start at the edge, close to the equipment, a PLC controls the machine, scatter gives operators a view of the cell or line.
644
01:23:38,000 --> 01:23:55,000
The historian records time series data for later review. OPC-UA provides a structured path for selected equipment data to move beyond the control network. Control stays local. The PLC must keep running the machine safely, even if an upstream system, a network link or a cloud service becomes unavailable.
645
01:23:55,000 --> 01:24:00,000
Safety functions, control timing and operator response do not belong in an analytics platform.
646
01:24:00,000 --> 01:24:16,000
That boundary isn't old fashioned caution, it's because a production line has physical consequences. You can't buffer a safety stop through a dashboard. Above that sits the operational layer. The MES records execution. It knows which order entered an operation, which quantity completed and which status applies on the shop floor.
647
01:24:16,000 --> 01:24:20,000
Maintenance systems manage asset work, service plans and equipment restrictions.
648
01:24:20,000 --> 01:24:36,000
Quality systems record inspections, holds and release decisions, warehouse systems track material movement and stock positions, planning systems hold demand, plan work and capacity assumptions. Each system deals with a different part of the plant. A machine stop can appear in several places, each for a valid reason.
649
01:24:36,000 --> 01:24:50,000
The controls layer sees a fault, MES sees interrupted execution, maintenance sees a work request or an unavailable asset, planning sees a capacity problem, quality sees material waiting for a decision. Nobody needs one system to replace all the others.
650
01:24:50,000 --> 01:25:01,000
Instead, the data platform collects the facts needed across those boundaries. It ingests events and records from approved sources, keeps history and applies checks before downstream, uses treat data as trusted.
651
01:25:01,000 --> 01:25:18,000
And also map identities so the equipment name from SCADA, the asset ID from maintenance and the work center from MES connect to the right resource in the shared model. That mapping work needs care. Some IDs describe the same physical machine, others describe different levels of the same equipment, a line, a station or a motor inside a station.
652
01:25:18,000 --> 01:25:25,000
The platform shouldn't flatten those differences just because a report needs one label. It should retain the source reference and make the relationship explicit.
653
01:25:25,000 --> 01:25:41,000
It's a government access sits here too. A planner may need to see an equipment restriction and its production impact. That doesn't mean every planner needs control network access or every raw signal. Data access should fit the job with clear source lineage and permissions that respect both operational and enterprise security needs.
654
01:25:41,000 --> 01:25:53,000
This link comes the industrial model layer. This layer connects the resource to its capabilities, the process to its rules and the product to the revision that applies. It also carries the links that turn a live event into an operational question.
655
01:25:53,000 --> 01:26:05,000
Which open operations use this resource? Which routes remain approved? Which tool must be available? Which trace links connect the affected work to material, quality records or engineering definitions? This layer contains relationships not just copies.
656
01:26:05,000 --> 01:26:21,000
Resource capability may change after a qualification expires. A product revision may change the allowed route, a quality restriction may block one path while another remains possible. The model needs effective dates, rules and ownership because a relationship without those details can create a false answer with great confidence.
657
01:26:21,000 --> 01:26:27,000
You've seen that dashboard. The one that says everything is fine while the plant is stopped. The decision layer sits above that connected context.
658
01:26:27,000 --> 01:26:39,000
An advanced planning and scheduling system often called APS can use the approved constraints to test feasible schedules. A simulation tool can test the knock on effect of a proposed move. Power BI gives production and management a shared operational view.
659
01:26:39,000 --> 01:26:51,000
Power Platform workflows root in exception to the right people, record approval and keep a trace of the decision. AI can support the same layer by finding context explaining dependencies or helping a person compare approved options.
660
01:26:51,000 --> 01:27:09,000
But none of these tools should invent the rules they use. A dashboard needs agreed definitions. APS needs current constraints. A workflow needs named approval conditions. AI needs sourceback relationships. If the layers underneath disagree, the decision layer just presents the disagreement faster. Which is not quite the kind of real time visibility anybody asked for.
661
01:27:09,000 --> 01:27:25,000
This is the architecture view simplified data starts near the equipment moves through the systems that run the business and the plant reaches a governed platform then connects through an industrial model before it supports a decision. And that architecture only works when people agree who owns each definition data ownership and model governance.
662
01:27:25,000 --> 01:27:53,000
Here's the truth most teams miss a data model only stays useful when someone actually owns what each piece of it means that ownership can't live solely in it even when it runs the platform builds the interfaces and manages access product definitions belong with the people who control engineering and product data process definitions need ownership from the folks responsible for how work actually runs day to day resource capability takes input from production maintenance and often quality because an asset register alone can't tell you whether a machine is a good thing.
663
01:27:53,000 --> 01:28:09,000
Every definition needs a named business owner that doesn't mean one person types every update themselves it means people know who decides when there's a dispute who approves a change and who accepts the ripple effect on planning reporting or production execution.
664
01:28:09,000 --> 01:28:22,000
If nobody owns what qualified resource means every system quietly builds its own version and the model starts drifting before you notice now here's where source of record rules make this practical for each fact the team agrees which system owns it.
665
01:28:22,000 --> 01:28:35,000
ERP owns the commercial order and required date engineering owns the released product revision MES owns the life execution status maintenance owns whether an asset is under restriction the shared model can connect those facts but it shouldn't casually override.




