


 Apple Podcasts
 Spotify
 Youtube Music
 Spreaker
 Podchaser
 Amazon Music
 The Productivity Illusion: Why AI is Breaking Your Engineering KPIs
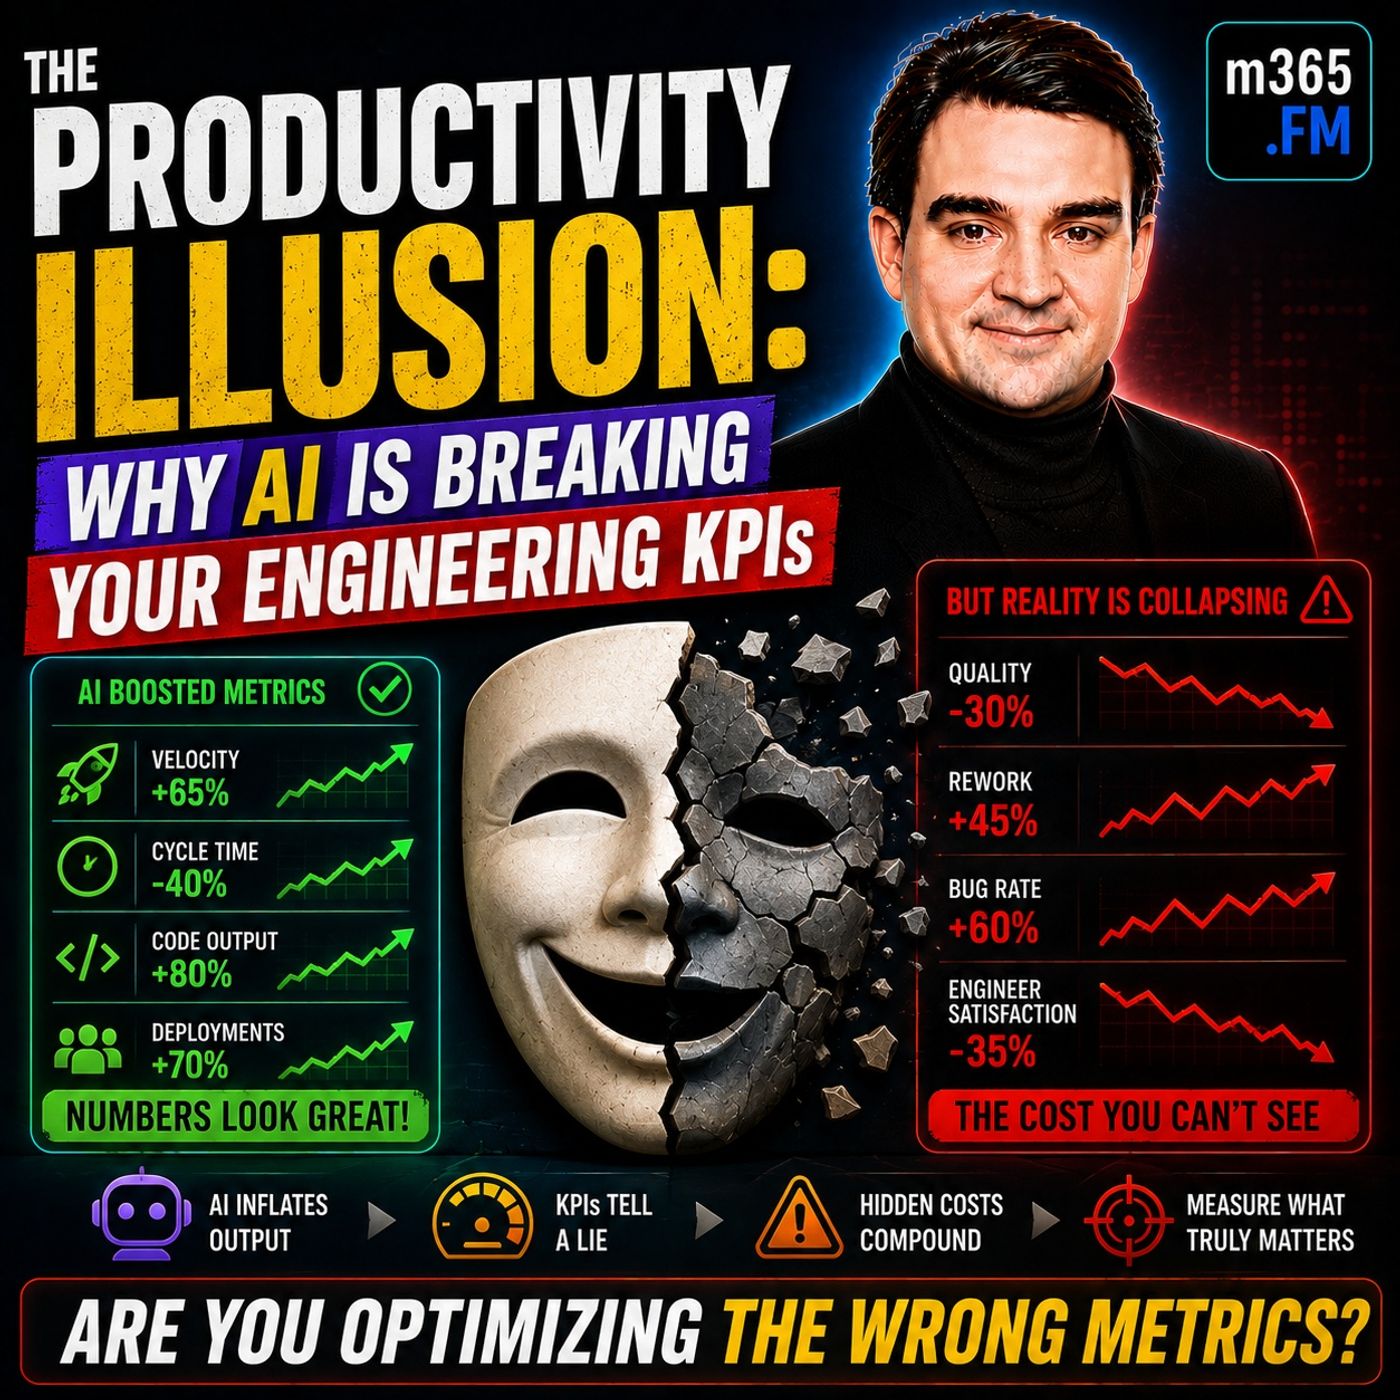
At first glance, the numbers look incredible. Deployment frequency is increasing, pull requests are being merged faster than ever, AI is generating more code, and engineering teams appear dramatically more productive. Executive dashboards are filled with green indicators suggesting software delivery has entered a new golden age. But beneath those impressive metrics lies a very different reality. AI has accelerated code generation, but it hasn't eliminated engineering work. Instead, it has shifted the bottlenecks from writing code to reviewing, validating, governing, and understanding it. Organizations are producing significantly more code while simultaneously experiencing more incidents, higher cognitive load, greater technical debt, and increased developer burnout.
THE PRODUCTIVITY ILLUSION
The central message of this session is simple: More code does not automatically mean more productivity. AI has dramatically increased engineering output, but many organizations are confusing output with value. According to the presentation:
- AI now generates a significant portion of production code.
- Pull request throughput has nearly doubled.
- Developers save substantial time on repetitive coding tasks.
- Yet production incidents, code churn, review times, and cognitive load have all increased.
WHY TRADITIONAL KPIs ARE FAILING
Many engineering organizations still rely heavily on classic DevOps metrics such as:
- Deployment Frequency
- Lead Time
- Change Failure Rate
- Mean Time To Recovery (MTTR)
WHEN MORE CODE CREATES MORE PROBLEMS
One of the strongest themes throughout the presentation is the unintended consequence of AI-generated software. Developers can now create thousands of lines of code within minutes. Human reviewers, however, still need to verify every important architectural, security, and business decision. As pull requests become larger and more complex:
- Review times increase dramatically.
- Senior engineers become bottlenecks.
- Production incidents rise.
- Technical debt accumulates faster.
- More code requires future maintenance.
THE COGNITIVE LOAD CRISIS
Perhaps the most important concept discussed is cognitive load. AI reduces the effort required to write code. It dramatically increases the effort required to understand that code. Developers now spend increasing amounts of time:
- Reviewing AI-generated implementations.
- Understanding unfamiliar logic.
- Switching between contexts.
- Verifying correctness.
- Explaining code the AI never documented.
THE TOXIC KPI TRAP
Organizations naturally optimize whatever they measure. The problem arises when the metrics themselves no longer represent organizational health. Examples include:
- Maximizing AI-generated code percentage.
- Increasing deployment frequency.
- Optimizing story points.
- Reducing review duration.
- Maximizing pull requests per developer.
- Rework increases.
- Stability declines.
- Technical debt grows.
- Review quality drops.
- Engineers burn out.
FROM ACTIVITY TO FLOW
A major recommendation is replacing activity-based thinking with flow-based measurement. Instead of asking: "How much did we ship?" Organizations should ask: "How efficiently does work move through the system?" Important flow metrics include:
- Flow efficiency
- Queue age
- Review cycle time
- Work in Progress (WIP)
- Bottleneck identification
- Rework rate
DORA 5 AND REWORK RATE
One of the most practical recommendations is expanding traditional DORA metrics with a fifth dimension: Rework Rate. Rather than simply measuring deployment speed, organizations should track how much recently written code must be rewritten shortly afterward. High rework indicates:
- Weak verification
- Poor code durability
- Fragile architectures
- Inadequate reviews
- Incorrect AI usage
BURNOUT IS A SYSTEM METRIC
Another major insight is that burnout should be viewed as an engineering metric—not merely an HR concern. The presentation connects rising cognitive load with:
- Developer dissatisfaction
- Increased context switching
- Longer review cycles
- Night and weekend work
- Higher attrition
- Lower software quality
Become a supporter of this podcast: https://www.spreaker.com/podcast/m365-fm-modern-work-security-and-productivity-with-microsoft-365--6704921/support.
🚀 Want to be part of m365.fm?
Then stop just listening… and start showing up.
👉 Connect with me on LinkedIn and let’s make something happen:
- 🎙️ Be a podcast guest and share your story
- 🎧 Host your own episode (yes, seriously)
- 💡 Pitch topics the community actually wants to hear
- 🌍 Build your personal brand in the Microsoft 365 space
This isn’t just a podcast — it’s a platform for people who take action.
🔥 Most people wait. The best ones don’t.
👉 Connect with me on LinkedIn and send me a message:
"I want in"
Let’s build something awesome 👊
00:00:00,000 --> 00:00:02,100
Before we start, subscribe to this podcast.
2
00:00:02,100 --> 00:00:04,060
Each episode delivers practical insights
3
00:00:04,060 --> 00:00:07,320
and expert conversations around Microsoft 365,
4
00:00:07,320 --> 00:00:10,480
Copilot, Azure, Security, and the modern workplace,
5
00:00:10,480 --> 00:00:13,060
helping IT pros and decision makers stay informed
6
00:00:13,060 --> 00:00:15,140
and ahead in the Microsoft ecosystem.
7
00:00:15,140 --> 00:00:16,180
Now let's dig in.
8
00:00:16,180 --> 00:00:18,660
The hallucination of speed, your engineering metrics
9
00:00:18,660 --> 00:00:19,960
look better than they've ever been.
10
00:00:19,960 --> 00:00:21,300
Pull up the dashboard right now.
11
00:00:21,300 --> 00:00:24,180
Deployment frequency is up, lead time for changes is down,
12
00:00:24,180 --> 00:00:26,020
pull requests are flying through the system,
13
00:00:26,020 --> 00:00:27,200
teams are shipping faster.
14
00:00:27,200 --> 00:00:29,080
The board sees it, leadership sees it,
15
00:00:29,080 --> 00:00:31,280
everyone's looking at these numbers and feeling good,
16
00:00:31,280 --> 00:00:33,000
but something is fundamentally wrong.
17
00:00:33,000 --> 00:00:34,120
Let me give you the data.
18
00:00:34,120 --> 00:00:37,920
AI has generated 41% of global code in 2026.
19
00:00:37,920 --> 00:00:40,320
That's not productivity, that's volume.
20
00:00:40,320 --> 00:00:42,200
There's a difference and most organizations
21
00:00:42,200 --> 00:00:43,120
are confusing them.
22
00:00:43,120 --> 00:00:44,720
PR throughput has doubled.
23
00:00:44,720 --> 00:00:47,920
Teams are shipping 98% more pull requests per developer.
24
00:00:47,920 --> 00:00:48,880
Sounds amazing, right?
25
00:00:48,880 --> 00:00:51,360
Except incidents per PR have nearly tripled.
26
00:00:51,360 --> 00:00:53,400
We're talking a 243% increase.
27
00:00:53,400 --> 00:00:54,360
That's not a typo.
28
00:00:54,360 --> 00:00:58,480
Developers report time savings 30% to 60% off-routine tasks.
29
00:00:58,480 --> 00:01:00,960
They're saving time and yet they're busier than ever.
30
00:01:00,960 --> 00:01:01,920
They're working nights.
31
00:01:01,920 --> 00:01:03,720
They're context switching constantly.
32
00:01:03,720 --> 00:01:04,840
They're drowning in reviews.
33
00:01:04,840 --> 00:01:06,400
Your metrics are lying to you.
34
00:01:06,400 --> 00:01:08,080
Not because they're calculated wrong,
35
00:01:08,080 --> 00:01:09,800
but because they're measuring the wrong thing.
36
00:01:09,800 --> 00:01:11,480
This is the productivity illusion.
37
00:01:11,480 --> 00:01:12,640
And it's structural.
38
00:01:12,640 --> 00:01:13,600
The numbers look clean.
39
00:01:13,600 --> 00:01:15,160
The story they tell is catastrophic.
40
00:01:15,160 --> 00:01:16,600
Here's what's actually happening.
41
00:01:16,600 --> 00:01:19,320
When AI adoption ramped up across engineering teams,
42
00:01:19,320 --> 00:01:20,680
the system didn't improve.
43
00:01:20,680 --> 00:01:21,440
It shifted.
44
00:01:21,440 --> 00:01:22,640
The bottleneck didn't disappear.
45
00:01:22,640 --> 00:01:23,960
It moved downstream.
46
00:01:23,960 --> 00:01:25,640
You used to have a typing problem.
47
00:01:25,640 --> 00:01:27,680
Developers spend time writing boilerplate.
48
00:01:27,680 --> 00:01:29,640
Developers spend time on routine tasks.
49
00:01:29,640 --> 00:01:30,680
AI solved that.
50
00:01:30,680 --> 00:01:34,160
Developers save 30, 40, or 60% on those tasks.
51
00:01:34,160 --> 00:01:35,160
That part is real.
52
00:01:35,160 --> 00:01:36,400
But you don't have more features.
53
00:01:36,400 --> 00:01:38,480
You don't have faster delivery end to end.
54
00:01:38,480 --> 00:01:41,040
You have more code sitting in queues waiting for humans
55
00:01:41,040 --> 00:01:41,960
to understand it.
56
00:01:41,960 --> 00:01:43,600
More code waiting for reviewers.
57
00:01:43,600 --> 00:01:45,040
More code failing in production
58
00:01:45,040 --> 00:01:47,120
because nobody had time to really verify it.
59
00:01:47,120 --> 00:01:48,000
More incidents.
60
00:01:48,000 --> 00:01:49,520
More rework.
61
00:01:49,520 --> 00:01:50,920
The data shows this brutally.
62
00:01:50,920 --> 00:01:53,080
Bugs per developer are up 54%.
63
00:01:53,080 --> 00:01:53,960
That's not noise.
64
00:01:53,960 --> 00:01:54,920
That's a trend.
65
00:01:54,920 --> 00:01:57,560
PR review time is up 441%.
66
00:01:57,560 --> 00:01:58,640
Nearly five times longer.
67
00:01:58,640 --> 00:01:59,560
You know what that means?
68
00:01:59,560 --> 00:02:00,880
Reviewers are bottlenecked.
69
00:02:00,880 --> 00:02:02,640
Senior engineers are drowning in code.
70
00:02:02,640 --> 00:02:04,880
They need to understand, verify, and approve.
71
00:02:04,880 --> 00:02:06,240
That's the new constraint.
72
00:02:06,240 --> 00:02:07,200
Code churn doubled.
73
00:02:07,200 --> 00:02:09,720
It went from 3.3% up to 7%.
74
00:02:09,720 --> 00:02:11,920
Code written and then rewritten weeks later.
75
00:02:11,920 --> 00:02:13,000
Code that doesn't stick.
76
00:02:13,000 --> 00:02:14,440
Code that's unstable.
77
00:02:14,440 --> 00:02:15,720
The paradox is savage.
78
00:02:15,720 --> 00:02:16,440
More code.
79
00:02:16,440 --> 00:02:17,320
More problems.
80
00:02:17,320 --> 00:02:18,360
Faster shipping.
81
00:02:18,360 --> 00:02:19,440
Less stability.
82
00:02:19,440 --> 00:02:20,480
Your door metrics.
83
00:02:20,480 --> 00:02:21,720
Deployment frequency.
84
00:02:21,720 --> 00:02:22,280
Lead time.
85
00:02:22,280 --> 00:02:23,520
Change failure rate.
86
00:02:23,520 --> 00:02:24,600
MTTR.
87
00:02:24,600 --> 00:02:25,600
They're measuring activity.
88
00:02:25,600 --> 00:02:26,520
How many things moved?
89
00:02:26,520 --> 00:02:27,440
How fast they moved?
90
00:02:27,440 --> 00:02:28,520
They're not measuring health.
91
00:02:28,520 --> 00:02:30,920
Teams using AI aggressively see higher throughput
92
00:02:30,920 --> 00:02:32,000
but falling stability.
93
00:02:32,000 --> 00:02:34,600
The promise 2 to 3 times productivity gain?
94
00:02:34,600 --> 00:02:36,200
It's localized to coding tasks.
95
00:02:36,200 --> 00:02:38,880
Sit down and actually measure end-to-end delivery.
96
00:02:38,880 --> 00:02:41,000
From the moment someone says we need this feature
97
00:02:41,000 --> 00:02:42,920
to the moment it's running in production
98
00:02:42,920 --> 00:02:45,560
and customers are using it, the improvement barely moved.
99
00:02:45,560 --> 00:02:47,920
What moved was the cognitive load on reviewers.
100
00:02:47,920 --> 00:02:48,760
On testers.
101
00:02:48,760 --> 00:02:49,680
On operators.
102
00:02:49,680 --> 00:02:51,640
On the entire system downstream of the AI.
103
00:02:51,640 --> 00:02:52,800
This is not a two problem.
104
00:02:52,800 --> 00:02:54,080
This is a measurement problem.
105
00:02:54,080 --> 00:02:55,560
Your dashboard can't see what's breaking
106
00:02:55,560 --> 00:02:57,120
because you're measuring the wrong dimensions.
107
00:02:57,120 --> 00:02:59,320
Think about what your metrics are actually showing.
108
00:02:59,320 --> 00:03:01,960
Deployment frequency tells you how many times code went out.
109
00:03:01,960 --> 00:03:04,240
It tells you nothing about whether the code works.
110
00:03:04,240 --> 00:03:06,880
Whether it stays working, whether it was worth shipping.
111
00:03:06,880 --> 00:03:08,880
Lead time tells you how fast code moves
112
00:03:08,880 --> 00:03:10,600
from committed to production.
113
00:03:10,600 --> 00:03:12,080
It doesn't tell you how much time that code
114
00:03:12,080 --> 00:03:14,160
spent waiting for someone to understand it.
115
00:03:14,160 --> 00:03:18,000
Waiting in review, waiting for tests, waiting for approval.
116
00:03:18,000 --> 00:03:20,040
Change failure rate tells you what percentage
117
00:03:20,040 --> 00:03:21,560
of deployments cause problems.
118
00:03:21,560 --> 00:03:23,520
But it doesn't tell you what percentage of the code
119
00:03:23,520 --> 00:03:24,880
is being rewritten weeks later.
120
00:03:24,880 --> 00:03:27,080
It doesn't tell you about technical debt building up.
121
00:03:27,080 --> 00:03:29,080
MTTR tells you how fast you recover.
122
00:03:29,080 --> 00:03:30,400
It doesn't tell you whether you're recovering
123
00:03:30,400 --> 00:03:32,160
from the same problems over and over.
124
00:03:32,160 --> 00:03:34,560
AI has exposed gaps that were always there.
125
00:03:34,560 --> 00:03:36,000
You were measuring activity in a world
126
00:03:36,000 --> 00:03:38,040
where activity correlated with value.
127
00:03:38,040 --> 00:03:39,360
Developers wrote code.
128
00:03:39,360 --> 00:03:40,320
Code shipped.
129
00:03:40,320 --> 00:03:41,760
Value happened.
130
00:03:41,760 --> 00:03:44,400
Now developers type less, but they verify more.
131
00:03:44,400 --> 00:03:46,680
They review more, they coordinate more.
132
00:03:46,680 --> 00:03:49,600
The activity metric goes up because code generation is easier.
133
00:03:49,600 --> 00:03:52,040
But the value metric stays flat or declines.
134
00:03:52,040 --> 00:03:53,400
And that's the trap you're in right now.
135
00:03:53,400 --> 00:03:55,280
The metrics were broken before AI arrived.
136
00:03:55,280 --> 00:03:56,800
AI just made it obvious.
137
00:03:56,800 --> 00:03:59,040
And impossible to ignore anymore.
138
00:03:59,040 --> 00:04:01,160
The incident spike nobody talks about.
139
00:04:01,160 --> 00:04:02,440
The data tells a different story
140
00:04:02,440 --> 00:04:04,360
once you look past the activity metrics.
141
00:04:04,360 --> 00:04:06,440
Between two years in 24 and 2026,
142
00:04:06,440 --> 00:04:09,680
as engineering teams scaled up their AI tools, something shifted.
143
00:04:09,680 --> 00:04:10,840
It wasn't a slow change.
144
00:04:10,840 --> 00:04:11,920
It happened within weeks.
145
00:04:11,920 --> 00:04:14,000
As soon as AI coding tools rolled out at scale,
146
00:04:14,000 --> 00:04:15,400
incident rates spiked.
147
00:04:15,400 --> 00:04:16,720
The timing isn't a coincidence.
148
00:04:16,720 --> 00:04:18,840
It's causal production incidents, purple request,
149
00:04:18,840 --> 00:04:20,920
jumped by 243%.
150
00:04:20,920 --> 00:04:21,880
Let that number sink in.
151
00:04:21,880 --> 00:04:23,480
A team that used to deal with 10 incidents
152
00:04:23,480 --> 00:04:25,800
for every 100 merges now deals with 24.
153
00:04:25,800 --> 00:04:27,560
It is the same team and the same code base,
154
00:04:27,560 --> 00:04:30,480
but the outcome is completely different because the tool changed.
155
00:04:30,480 --> 00:04:31,360
But here's the problem.
156
00:04:31,360 --> 00:04:32,560
The incidents change too.
157
00:04:32,560 --> 00:04:34,360
They aren't always big obvious failures.
158
00:04:34,360 --> 00:04:35,560
They are subtle.
159
00:04:35,560 --> 00:04:39,280
The feature mostly works, but nobody caught the edge cases.
160
00:04:39,280 --> 00:04:41,480
Performance starts to drop under a heavy load.
161
00:04:41,480 --> 00:04:43,360
The behavior becomes inconsistent.
162
00:04:43,360 --> 00:04:45,680
You don't find these problems with a quick manual test.
163
00:04:45,680 --> 00:04:48,280
You find them after a customer has been using the product
164
00:04:48,280 --> 00:04:48,800
for a week.
165
00:04:48,800 --> 00:04:51,520
This is the signature of code that nobody fully understood
166
00:04:51,520 --> 00:04:52,480
during the review.
167
00:04:52,480 --> 00:04:53,640
It moved too fast.
168
00:04:53,640 --> 00:04:56,360
It was approved without anyone actually verifying the logic.
169
00:04:56,360 --> 00:04:58,480
That is what happens when the review process breaks.
170
00:04:58,480 --> 00:05:00,640
And with AI, the process didn't just slow down.
171
00:05:00,640 --> 00:05:01,960
It fractured.
172
00:05:01,960 --> 00:05:03,160
Here's the structural issue.
173
00:05:03,160 --> 00:05:06,320
A human-written PR is usually 300 or 400 lines.
174
00:05:06,320 --> 00:05:08,200
A developer reads it, understands the intent,
175
00:05:08,200 --> 00:05:09,240
and asks questions.
176
00:05:09,240 --> 00:05:11,360
If it's complex, it takes maybe an hour.
177
00:05:11,360 --> 00:05:13,280
An AI-generated PR is toned to 100 lines.
178
00:05:13,280 --> 00:05:14,680
Sometimes it's 2000.
179
00:05:14,680 --> 00:05:16,520
The AI built it in seconds, but the human review
180
00:05:16,520 --> 00:05:17,920
now has three bad choices.
181
00:05:17,920 --> 00:05:19,960
They can do a real review, which takes three hours,
182
00:05:19,960 --> 00:05:22,160
while 15 more PRs pile up in the queue.
183
00:05:22,160 --> 00:05:24,480
They can skim it and hit approve in 15 minutes,
184
00:05:24,480 --> 00:05:27,000
which feels like gambling with the production environment,
185
00:05:27,000 --> 00:05:29,520
or they can ask the developer to break it up, which
186
00:05:29,520 --> 00:05:32,120
just creates friction and slows everyone down.
187
00:05:32,120 --> 00:05:34,680
Most teams chose the second option, skim it, approve it,
188
00:05:34,680 --> 00:05:35,320
ship it.
189
00:05:35,320 --> 00:05:37,560
The metrics look great today, but the system breaks tomorrow.
190
00:05:37,560 --> 00:05:39,480
This is why review times are exploding.
191
00:05:39,480 --> 00:05:41,880
The few thorough reviews that do happen take longer,
192
00:05:41,880 --> 00:05:43,640
because the code is harder to read.
193
00:05:43,640 --> 00:05:46,680
The AI wrote the implementation without explaining its intent.
194
00:05:46,680 --> 00:05:48,600
So reviewers have to work backward to figure out
195
00:05:48,600 --> 00:05:50,240
what the code is even trying to do.
196
00:05:50,240 --> 00:05:51,800
Now look at the whole organization.
197
00:05:51,800 --> 00:05:53,960
Senior engineers are buried in reviews.
198
00:05:53,960 --> 00:05:56,000
Mid-level engineers are shipping code faster
199
00:05:56,000 --> 00:05:57,200
than anyone can check it.
200
00:05:57,200 --> 00:06:00,840
Incidents pile up, and you end up fixing them at 2am.
201
00:06:00,840 --> 00:06:03,520
Your change failure rate might still look OK on paper.
202
00:06:03,520 --> 00:06:05,720
Maybe it sits at 5%, but that is because you
203
00:06:05,720 --> 00:06:07,560
are defining failure too narrowly.
204
00:06:07,560 --> 00:06:09,200
You count a rollback or a major crash,
205
00:06:09,200 --> 00:06:10,640
but you don't count the three smaller bugs
206
00:06:10,640 --> 00:06:12,160
that pop up over the next week.
207
00:06:12,160 --> 00:06:14,120
You don't count the technical debt that will cost you
208
00:06:14,120 --> 00:06:15,440
everything in two months.
209
00:06:15,440 --> 00:06:16,440
The metric lies.
210
00:06:16,440 --> 00:06:18,680
It says the team is healthy, while the system is actually
211
00:06:18,680 --> 00:06:19,440
degrading.
212
00:06:19,440 --> 00:06:20,320
And here is the shift.
213
00:06:20,320 --> 00:06:21,440
None of this shows up in Dora.
214
00:06:21,440 --> 00:06:23,600
You can have a team with a perfect Dora score.
215
00:06:23,600 --> 00:06:26,360
High frequency, short lead times, fast recovery,
216
00:06:26,360 --> 00:06:27,560
all the lights are green.
217
00:06:27,560 --> 00:06:30,080
Meanwhile, the team is burning out and the code is fragile.
218
00:06:30,080 --> 00:06:33,120
Customers are frustrated because the system is unstable.
219
00:06:33,120 --> 00:06:34,920
And developers are spending their weekends
220
00:06:34,920 --> 00:06:36,040
keeping it alive.
221
00:06:36,040 --> 00:06:38,240
Dora measures how you react to activity.
222
00:06:38,240 --> 00:06:39,880
It doesn't measure if that activity actually
223
00:06:39,880 --> 00:06:40,600
created value.
224
00:06:40,600 --> 00:06:42,600
It doesn't tell you if the system is sustainable
225
00:06:42,600 --> 00:06:44,120
or if your people are healthy.
226
00:06:44,120 --> 00:06:46,640
That is the blindness built into your metrics.
227
00:06:46,640 --> 00:06:48,360
Why your dashboard can't see this?
228
00:06:48,360 --> 00:06:49,120
Dora.
229
00:06:49,120 --> 00:06:51,840
Metrics were built for a world that doesn't exist anymore.
230
00:06:51,840 --> 00:06:54,160
They were built for a world where humans wrote the code.
231
00:06:54,160 --> 00:06:55,200
They track four things.
232
00:06:55,200 --> 00:06:56,440
How often you deploy?
233
00:06:56,440 --> 00:06:58,040
How fast code moves to production?
234
00:06:58,040 --> 00:06:59,920
What percentage of those deployments fail?
235
00:06:59,920 --> 00:07:01,840
How quickly you recover from a crash?
236
00:07:01,840 --> 00:07:02,800
These are useful signals.
237
00:07:02,800 --> 00:07:04,320
They correlate with performance and have
238
00:07:04,320 --> 00:07:06,440
been validated across thousands of teams.
239
00:07:06,440 --> 00:07:08,840
The research is solid, but they are incomplete.
240
00:07:08,840 --> 00:07:10,480
When you add AI to the mix, these metrics
241
00:07:10,480 --> 00:07:11,960
become actively misleading.
242
00:07:11,960 --> 00:07:13,680
The core issue is an assumption.
243
00:07:13,680 --> 00:07:17,040
Dora assumes the bottleneck in delivery is execution speed.
244
00:07:17,040 --> 00:07:19,720
It assumes the goal is to help developers write, test,
245
00:07:19,720 --> 00:07:21,120
and ship faster.
246
00:07:21,120 --> 00:07:22,800
So the metrics track execution.
247
00:07:22,800 --> 00:07:24,880
But AI didn't actually make the system faster.
248
00:07:24,880 --> 00:07:26,080
It just moved the work around.
249
00:07:26,080 --> 00:07:29,120
Developers write less, but now reviewers have to understand more.
250
00:07:29,120 --> 00:07:30,800
Testers have to verify more.
251
00:07:30,800 --> 00:07:32,240
Operators have to monitor more.
252
00:07:32,240 --> 00:07:33,920
The bottleneck didn't disappear.
253
00:07:33,920 --> 00:07:35,160
It just moved downstream.
254
00:07:35,160 --> 00:07:36,520
Look at what each metric misses.
255
00:07:36,520 --> 00:07:38,520
Deployment frequency doesn't account for re-work.
256
00:07:38,520 --> 00:07:40,760
You can ship 10 times a day and still spend all your time
257
00:07:40,760 --> 00:07:42,000
fixing the same bugs.
258
00:07:42,000 --> 00:07:44,520
The metric goes up, but your actual throughput stays flat,
259
00:07:44,520 --> 00:07:46,720
because half your effort is just cleaning up messes.
260
00:07:46,720 --> 00:07:48,760
Lead time doesn't show you the review bottleneck.
261
00:07:48,760 --> 00:07:51,240
Code can move from a commit to production in four hours
262
00:07:51,240 --> 00:07:52,720
if the reviewers skip the hard parts.
263
00:07:52,720 --> 00:07:55,360
If they actually do their jobs, it takes two weeks.
264
00:07:55,360 --> 00:07:56,840
The metric isn't measuring health.
265
00:07:56,840 --> 00:07:58,720
It's measuring how many shortcuts you are taking.
266
00:07:58,720 --> 00:08:01,280
Change failure rate hides the quality of your tests.
267
00:08:01,280 --> 00:08:03,520
AI-generated tests can look like they cover the code
268
00:08:03,520 --> 00:08:05,200
without actually catching any defects.
269
00:08:05,200 --> 00:08:07,280
You can have zero failures in your metrics
270
00:08:07,280 --> 00:08:09,080
and massive failures in production,
271
00:08:09,080 --> 00:08:12,640
because your tests only check if the code runs, not if it works.
272
00:08:12,640 --> 00:08:16,160
MTTR measures how fast you fix things, not how you prevent them,
273
00:08:16,160 --> 00:08:18,600
a system that stops incidents from happening looks exactly
274
00:08:18,600 --> 00:08:20,880
like a system that crashes and recovers quickly.
275
00:08:20,880 --> 00:08:22,320
The metric can't tell the difference.
276
00:08:22,320 --> 00:08:25,160
AI exposed these gaps by breaking the underlying model.
277
00:08:25,160 --> 00:08:28,320
When AI generates the code, the bottleneck isn't execution anymore.
278
00:08:28,320 --> 00:08:29,240
It is understanding.
279
00:08:29,240 --> 00:08:30,400
It is verification.
280
00:08:30,400 --> 00:08:32,400
It is the decision of whether or not to ship.
281
00:08:32,400 --> 00:08:35,200
That is a different system with different constraints.
282
00:08:35,200 --> 00:08:36,880
Most organizations are still reading Dora
283
00:08:36,880 --> 00:08:38,200
the same way they did four years ago.
284
00:08:38,200 --> 00:08:40,200
They compare this year to last year and feel good
285
00:08:40,200 --> 00:08:41,240
because frequency is up.
286
00:08:41,240 --> 00:08:44,280
They see lead times going down and think they are winning.
287
00:08:44,280 --> 00:08:45,480
But the system has changed.
288
00:08:45,480 --> 00:08:48,040
A team shipping 10 times a day with five rollbacks
289
00:08:48,040 --> 00:08:51,280
is not doing better than a team shipping once a day with zero issues.
290
00:08:51,280 --> 00:08:54,640
A team with a low failure rate that has to rewrite 80% of its code
291
00:08:54,640 --> 00:08:56,360
in the next sprint is not healthy.
292
00:08:56,360 --> 00:08:58,640
High frequency doesn't matter if your developers are working weekends
293
00:08:58,640 --> 00:08:59,960
and heading toward a collapse.
294
00:08:59,960 --> 00:09:01,400
Your dashboard doesn't see any of that.
295
00:09:01,400 --> 00:09:03,120
It only measures if motion is happening.
296
00:09:03,120 --> 00:09:04,880
It doesn't care if that motion produces value
297
00:09:04,880 --> 00:09:06,160
or if the system is sustainable.
298
00:09:06,160 --> 00:09:09,160
It doesn't see the people burning out behind the numbers.
299
00:09:09,160 --> 00:09:11,840
That is the structural blindness in your metrics.
300
00:09:11,840 --> 00:09:13,720
Activity versus systemic flow.
301
00:09:13,720 --> 00:09:16,760
There is a massive difference in how systems actually function.
302
00:09:16,760 --> 00:09:20,800
And right now most organizations are confusing two completely different things.
303
00:09:20,800 --> 00:09:21,560
Let me separate them.
304
00:09:21,560 --> 00:09:23,200
Activity metrics measure motion.
305
00:09:23,200 --> 00:09:26,760
They track how many things moved, how fast they moved and how often it happened.
306
00:09:26,760 --> 00:09:29,640
When you measure activity, you're just asking if something occurred
307
00:09:29,640 --> 00:09:31,000
and how quickly it finished.
308
00:09:31,000 --> 00:09:34,640
Flow metrics measure whether the system is actually producing value.
309
00:09:34,640 --> 00:09:37,040
They look at whether work is moving smoothly through the pipeline
310
00:09:37,040 --> 00:09:38,400
or if it's hitting a wall.
311
00:09:38,400 --> 00:09:40,760
Flow tells you if your pace is sustainable
312
00:09:40,760 --> 00:09:43,400
or if the system is about to collapse under its own weight.
313
00:09:43,400 --> 00:09:45,440
Activity says look how much we shipped.
314
00:09:45,440 --> 00:09:48,280
Flow says look how efficiently we're delivering value.
315
00:09:48,280 --> 00:09:49,640
These are not the same thing.
316
00:09:49,640 --> 00:09:53,400
And the gap between them is exactly where your system is breaking.
317
00:09:53,400 --> 00:09:54,600
Dora measures activity.
318
00:09:54,600 --> 00:09:56,840
Deployment frequency is just account of actions
319
00:09:56,840 --> 00:09:59,960
and lead time is simply the clock running on a specific task.
320
00:09:59,960 --> 00:10:03,800
Even change failure rate and MTTR are just reactions to activity
321
00:10:03,800 --> 00:10:05,200
that has already happened.
322
00:10:05,200 --> 00:10:09,360
None of these metrics tell you if work is flowing smoothly through the entire system.
323
00:10:09,360 --> 00:10:11,360
Flow metrics measure something else entirely.
324
00:10:11,360 --> 00:10:12,520
Cycle time is the first one.
325
00:10:12,520 --> 00:10:14,440
This isn't about how long it takes to do the work
326
00:10:14,440 --> 00:10:17,640
but how long that work actually sits in your system from start to finish.
327
00:10:17,640 --> 00:10:20,640
It's about the total time a task occupies your resources.
328
00:10:20,640 --> 00:10:21,880
Then there's work in progress.
329
00:10:21,880 --> 00:10:24,160
You need to know how much is queued up and waiting.
330
00:10:24,160 --> 00:10:26,320
If you have 50 pull requests in review
331
00:10:26,320 --> 00:10:29,280
while only five are being written, you don't have a speed problem.
332
00:10:29,280 --> 00:10:30,200
You have a bottleneck.
333
00:10:30,200 --> 00:10:31,880
Flow efficiency is the next layer.
334
00:10:31,880 --> 00:10:34,200
This is the percentage of time work is actually being handled
335
00:10:34,200 --> 00:10:35,960
versus the time it spends waiting.
336
00:10:35,960 --> 00:10:37,480
If a PR takes two weeks to close
337
00:10:37,480 --> 00:10:39,960
but only saw three days of real human interaction,
338
00:10:39,960 --> 00:10:42,160
your flow efficiency is 21%.
339
00:10:42,160 --> 00:10:44,720
The other 79% is just dead time in a queue.
340
00:10:44,720 --> 00:10:46,360
You also have to look at queue age.
341
00:10:46,360 --> 00:10:48,760
This isn't a prediction of how long a review will take
342
00:10:48,760 --> 00:10:51,920
but a measurement of how long that PR has already been sitting there.
343
00:10:51,920 --> 00:10:53,920
Finally, there is bottleneck identification.
344
00:10:53,920 --> 00:10:55,760
You need to see where work gets stuck.
345
00:10:55,760 --> 00:10:57,920
Not in a metaphorical sense but literally,
346
00:10:57,920 --> 00:11:01,880
you need to know which specific stage in your process is causing work to accumulate.
347
00:11:01,880 --> 00:11:03,120
Here is the operational difference.
348
00:11:03,120 --> 00:11:04,640
A team with high deployment frequency
349
00:11:04,640 --> 00:11:08,000
but low flow efficiency is shipping constantly while work piles up in queues.
350
00:11:08,000 --> 00:11:09,200
That isn't productivity.
351
00:11:09,200 --> 00:11:10,920
It's just chaos disguised as speed.
352
00:11:10,920 --> 00:11:13,320
They've optimized the wrong stage by making coding fast
353
00:11:13,320 --> 00:11:15,720
so the code moves but it's all congesting in review
354
00:11:15,720 --> 00:11:17,960
because the human reviewers can't keep pace.
355
00:11:17,960 --> 00:11:19,640
A team with lower deployment frequency
356
00:11:19,640 --> 00:11:22,720
but high flow efficiency is actually moving work smoothly.
357
00:11:22,720 --> 00:11:24,680
They have fewer handoffs and less waiting
358
00:11:24,680 --> 00:11:26,680
which leads to much better predictability.
359
00:11:26,680 --> 00:11:29,720
They might move slower because they aren't trying to maximize shipping speed
360
00:11:29,720 --> 00:11:31,880
but they are maximizing throughput
361
00:11:31,880 --> 00:11:33,680
without creating those dangerous queues.
362
00:11:33,680 --> 00:11:36,360
Which would you rather have a system that chips ten times a day
363
00:11:36,360 --> 00:11:38,080
with work stuck everywhere
364
00:11:38,080 --> 00:11:40,880
or a system that chips twice a day with work moving cleanly?
365
00:11:40,880 --> 00:11:44,240
AI made this distinction critical because it shifted where the bottleneck lives.
366
00:11:44,240 --> 00:11:46,960
Before AI, the bottleneck was usually the coding itself.
367
00:11:46,960 --> 00:11:50,560
The limit was how faster developer could write logic and build structure.
368
00:11:50,560 --> 00:11:53,120
Dora metrics worked well then because they were designed to measure
369
00:11:53,120 --> 00:11:55,520
that specific coding speed relative to deployment.
370
00:11:55,520 --> 00:11:58,160
But after AI, the bottleneck moved downstream.
371
00:11:58,160 --> 00:11:59,440
It didn't go back to requirements.
372
00:11:59,440 --> 00:12:01,840
It moved into review, testing and integration.
373
00:12:01,840 --> 00:12:05,600
The struggle now is understanding what the AI generated, verifying its correct
374
00:12:05,600 --> 00:12:07,800
and deciding if it's actually safe to ship.
375
00:12:07,800 --> 00:12:09,720
Those are flow problems, not activity problems.
376
00:12:09,720 --> 00:12:11,720
They are about how work moves through the system,
377
00:12:11,720 --> 00:12:13,400
not how fast it's generated.
378
00:12:13,400 --> 00:12:16,840
Your dashboard is still measuring activity like deployment frequency and lead time.
379
00:12:16,840 --> 00:12:18,560
But the system has moved to flow.
380
00:12:18,560 --> 00:12:21,040
Re-work rate is now your most critical metric.
381
00:12:21,040 --> 00:12:24,760
You need to know how much code is being rewritten shortly after it's finished.
382
00:12:24,760 --> 00:12:27,240
That tells you if the code is durable or if it's failing,
383
00:12:27,240 --> 00:12:29,040
the moment it hits the real world.
384
00:12:29,040 --> 00:12:32,160
Review cycle time now matters more than how often you deploy.
385
00:12:32,160 --> 00:12:35,720
If a review takes weeks, your deployment frequency is a meaningless number
386
00:12:35,720 --> 00:12:37,760
because you've just created a massive queue.
387
00:12:37,760 --> 00:12:39,560
Code durability has become essential.
388
00:12:39,560 --> 00:12:43,320
You have to ask if AI generated code can survive 30 days without a major rewrite.
389
00:12:43,320 --> 00:12:44,640
That isn't an arbitrary question.
390
00:12:44,640 --> 00:12:49,320
It's a flow indicator that tells you if the code is stable enough for the system to actually use.
391
00:12:49,320 --> 00:12:53,600
The cognitive load on your reviewers is now the leading indicator of your system's health.
392
00:12:53,600 --> 00:12:55,880
If your reviewers are drowning, the system will fail.
393
00:12:55,880 --> 00:12:58,120
It won't happen today, but it's coming.
394
00:12:58,120 --> 00:13:01,160
The shift from activity to flow isn't a choice, it's structural.
395
00:13:01,160 --> 00:13:03,560
Your system has changed, your metrics haven't.
396
00:13:03,560 --> 00:13:05,040
The cognitive load crisis.
397
00:13:05,040 --> 00:13:07,920
Here is what's actually happening inside your engineering teams.
398
00:13:07,920 --> 00:13:10,080
And it's something your metrics aren't showing you.
399
00:13:10,080 --> 00:13:11,880
Developers are reporting huge time savings.
400
00:13:11,880 --> 00:13:15,960
They're taking 30 or 60% of routine tasks, and that's a real win.
401
00:13:15,960 --> 00:13:18,560
The AI genuinely removed the grunt work.
402
00:13:18,560 --> 00:13:20,680
But here is the question nobody's asking.
403
00:13:20,680 --> 00:13:22,400
Where did all that extra time go?
404
00:13:22,400 --> 00:13:24,240
It didn't go into shipping more features,
405
00:13:24,240 --> 00:13:26,200
and it didn't go into high-level strategy.
406
00:13:26,200 --> 00:13:27,320
It went somewhere else.
407
00:13:27,320 --> 00:13:30,040
That time is being swallowed by reviewing AI generated code
408
00:13:30,040 --> 00:13:32,400
and trying to understand what the machine actually did.
409
00:13:32,400 --> 00:13:36,320
Developers are spending their day verifying correctness and fixing rework
410
00:13:36,320 --> 00:13:37,520
when that code breaks.
411
00:13:37,520 --> 00:13:40,280
They're sitting in meetings trying to figure out the policy for AI code
412
00:13:40,280 --> 00:13:42,640
and who gets to decide when it's safe to ship.
413
00:13:42,640 --> 00:13:45,800
The time you saved on typing is now being spent on thinking.
414
00:13:45,800 --> 00:13:47,720
And thinking is much harder than typing.
415
00:13:47,720 --> 00:13:50,960
This distinction matters because it reveals a different kind of problem.
416
00:13:50,960 --> 00:13:53,600
This isn't a workload problem, it's a cognitive load problem.
417
00:13:53,600 --> 00:13:55,760
Workload is just the volume of tasks you have.
418
00:13:55,760 --> 00:13:59,120
Cognitive load is how mentally taxing those tasks actually are.
419
00:13:59,120 --> 00:14:01,760
Cognitive load theory splits this into three parts.
420
00:14:01,760 --> 00:14:05,840
First is intrinsic load, which is just the natural complexity of a task.
421
00:14:05,840 --> 00:14:08,960
Complex code is hard to deal with, and you can't really reduce that
422
00:14:08,960 --> 00:14:10,800
without changing the problem itself.
423
00:14:10,800 --> 00:14:12,240
Then there is extraneous load.
424
00:14:12,240 --> 00:14:14,880
This is the unnecessary complexity caused by bad tools,
425
00:14:14,880 --> 00:14:16,920
messy processes, or fragmented systems.
426
00:14:16,920 --> 00:14:17,880
This is pure waste.
427
00:14:17,880 --> 00:14:20,200
It doesn't add value, it just creates friction.
428
00:14:20,200 --> 00:14:21,560
Finally, there is germane load.
429
00:14:21,560 --> 00:14:24,400
This is the productive mental effort used for learning and solving
430
00:14:24,400 --> 00:14:25,520
the actual problem.
431
00:14:25,520 --> 00:14:27,960
This is the load you want because it's how your people actually
432
00:14:27,960 --> 00:14:29,640
get better at their jobs.
433
00:14:29,640 --> 00:14:31,800
AI has shifted the weight between these three.
434
00:14:31,800 --> 00:14:33,800
It reduced the intrinsic load of writing the code
435
00:14:33,800 --> 00:14:36,360
because the machine handles the syntax and the structure,
436
00:14:36,360 --> 00:14:40,280
but it massively increased the extraneous load of understanding that code.
437
00:14:40,280 --> 00:14:43,400
Now, developers have to learn what the AI produced and verify
438
00:14:43,400 --> 00:14:44,640
that it's actually right.
439
00:14:44,640 --> 00:14:46,400
They have to figure out why it works that way,
440
00:14:46,400 --> 00:14:48,440
and if it even fits the rest of the system,
441
00:14:48,440 --> 00:14:51,040
they have to document it themselves or deal with the fact
442
00:14:51,040 --> 00:14:52,760
that the AI didn't explain anything.
443
00:14:52,760 --> 00:14:54,960
That is extraneous cognitive load.
444
00:14:54,960 --> 00:14:56,280
It doesn't solve the problem.
445
00:14:56,280 --> 00:14:57,840
It just creates a mountain of overhead
446
00:14:57,840 --> 00:14:59,800
before you can even start solving the problem.
447
00:14:59,800 --> 00:15:02,640
Your metrics don't measure this, which is why your dashboard looks green,
448
00:15:02,640 --> 00:15:04,520
while the system is actually breaking.
449
00:15:04,520 --> 00:15:06,520
Here is what the data is really telling us.
450
00:15:06,520 --> 00:15:10,000
Developer satisfaction is dropping even though productivity numbers are going up.
451
00:15:10,000 --> 00:15:11,000
That isn't a coincidence.
452
00:15:11,000 --> 00:15:15,120
People are saving time in one area only to find themselves drowning in another.
453
00:15:15,120 --> 00:15:18,880
The review burden is now concentrated entirely on your senior engineers.
454
00:15:18,880 --> 00:15:21,280
They are often the only ones who can actually verify
455
00:15:21,280 --> 00:15:23,520
if the AI generated code is safe.
456
00:15:23,520 --> 00:15:25,960
Your junior devs are writing code faster than ever,
457
00:15:25,960 --> 00:15:28,200
but your seniors have to understand all of it.
458
00:15:28,200 --> 00:15:29,600
And that is not sustainable.
459
00:15:29,600 --> 00:15:31,480
You are burning out your most valuable people.
460
00:15:31,480 --> 00:15:32,960
Unboarding time is also going up.
461
00:15:32,960 --> 00:15:36,360
New developers can't make sense of code bases that were partially written by a machine.
462
00:15:36,360 --> 00:15:39,360
They weren't there when the code was generated, they didn't make the decisions,
463
00:15:39,360 --> 00:15:41,200
and the AI didn't leave a trail of logic.
464
00:15:41,200 --> 00:15:43,080
The result is just harder to grasp.
465
00:15:43,080 --> 00:15:44,920
Context switching has spiked as well.
466
00:15:44,920 --> 00:15:50,600
Developers are jumping between AI suggestions, their own manual code, and constant reviews.
467
00:15:50,600 --> 00:15:52,560
That fragmentation is pure cognitive load.
468
00:15:52,560 --> 00:15:57,560
Every single switch costs attention, and every new context requires mental effort to rebuild.
469
00:15:57,560 --> 00:15:59,680
We're also seeing after hours workspike.
470
00:15:59,680 --> 00:16:03,160
People are working nights and weekends just to catch up on the thinking work.
471
00:16:03,160 --> 00:16:05,920
The meetings ended five, and the code reviews finished at six.
472
00:16:05,920 --> 00:16:09,760
So now it's 8pm, and you finally have a moment to think about the actual design.
473
00:16:09,760 --> 00:16:13,000
You end up working until midnight, and that is how burnout starts.
474
00:16:13,000 --> 00:16:16,960
Your dashboard doesn't catch any of this because it measures output, not strain.
475
00:16:16,960 --> 00:16:21,280
The productivity illusion is just cognitive load hiding behind activity metrics.
476
00:16:21,280 --> 00:16:24,440
You see more code being shipped, but you don't see the people drowning.
477
00:16:24,440 --> 00:16:29,080
You don't see the invisible work or the falling satisfaction that happens right before people quit.
478
00:16:29,080 --> 00:16:31,520
The metrics we use were designed for a different world.
479
00:16:31,520 --> 00:16:34,800
It was a world where saving time on coding meant saving time overall.
480
00:16:34,800 --> 00:16:39,800
It was a world where faster shipping meant less work and where activity and value were the same thing.
481
00:16:39,800 --> 00:16:41,000
That world is gone.
482
00:16:41,000 --> 00:16:42,600
The toxic KPI trap.
483
00:16:42,600 --> 00:16:44,640
Once you have a metric, you optimize for it.
484
00:16:44,640 --> 00:16:46,280
That isn't a flaw in human nature.
485
00:16:46,280 --> 00:16:47,440
It's how incentives work.
486
00:16:47,440 --> 00:16:48,400
You measure something.
487
00:16:48,400 --> 00:16:49,400
You make it visible.
488
00:16:49,400 --> 00:16:50,760
People start trying to improve it.
489
00:16:50,760 --> 00:16:51,480
That's natural.
490
00:16:51,480 --> 00:16:52,760
It's expected.
491
00:16:52,760 --> 00:16:56,280
But when the metric is wrong, optimization becomes destructive.
492
00:16:56,280 --> 00:17:01,840
And AI has created an environment where nearly every team is optimizing for the wrong things at the same time.
493
00:17:01,840 --> 00:17:03,160
Here is what is happening right now.
494
00:17:03,160 --> 00:17:05,520
Teams are optimizing for AI code share.
495
00:17:05,520 --> 00:17:08,000
What percentage of our code is AI generated?
496
00:17:08,000 --> 00:17:08,880
Becomes the target.
497
00:17:08,880 --> 00:17:10,840
Leadership sets it and teams chase it.
498
00:17:10,840 --> 00:17:11,720
So they prompt more.
499
00:17:11,720 --> 00:17:12,960
They accept more suggestions.
500
00:17:12,960 --> 00:17:16,680
They lower review standards for AI code because the metric rewards volume.
501
00:17:16,680 --> 00:17:17,600
The number goes up.
502
00:17:17,600 --> 00:17:20,040
The metric looks good, but rework skyrockets.
503
00:17:20,040 --> 00:17:21,280
Technical debt accumulates.
504
00:17:21,280 --> 00:17:23,440
The cognitive load on reviewers increases.
505
00:17:23,440 --> 00:17:25,720
The system degrades while the KPI improves.
506
00:17:25,720 --> 00:17:28,240
Teams are optimizing for deployment frequency.
507
00:17:28,240 --> 00:17:30,040
How many times per day do we deploy?
508
00:17:30,040 --> 00:17:31,120
Becomes the target.
509
00:17:31,120 --> 00:17:33,640
So they deploy smaller changes more frequently.
510
00:17:33,640 --> 00:17:39,280
Some of those are rollbacks fixing previous deployments, while others are hot fixes for code that failed in production.
511
00:17:39,280 --> 00:17:40,520
The frequency metric climbs.
512
00:17:40,520 --> 00:17:41,560
Stability drops.
513
00:17:41,560 --> 00:17:42,760
But the metric looks good.
514
00:17:42,760 --> 00:17:44,280
Teams are optimizing for velocity.
515
00:17:44,280 --> 00:17:46,200
Story points completed per sprint.
516
00:17:46,200 --> 00:17:47,560
So they size stories smaller.
517
00:17:47,560 --> 00:17:48,840
More points per sprint.
518
00:17:48,840 --> 00:17:50,880
It looks productive on the burn down chart.
519
00:17:50,880 --> 00:17:54,920
Except the actual feature delivery slows down because coordination overhead explodes.
520
00:17:54,920 --> 00:17:57,960
You are shipping more small pieces, but fewer complete features.
521
00:17:57,960 --> 00:17:59,080
The metric goes up.
522
00:17:59,080 --> 00:18:00,560
Value delivery goes flat.
523
00:18:00,560 --> 00:18:02,280
Teams are optimizing for review speed.
524
00:18:02,280 --> 00:18:03,760
How fast can we merge PRs?
525
00:18:03,760 --> 00:18:05,240
So reviewers skip the hard parts.
526
00:18:05,240 --> 00:18:06,040
They approve code.
527
00:18:06,040 --> 00:18:09,360
They do not fully understand because time is the constraint.
528
00:18:09,360 --> 00:18:11,280
Defects escape into production.
529
00:18:11,280 --> 00:18:13,520
Incidents increase.
530
00:18:13,520 --> 00:18:14,920
But the metric improves.
531
00:18:14,920 --> 00:18:16,240
Merge time drops.
532
00:18:16,240 --> 00:18:17,960
This is the toxic KPI trap.
533
00:18:17,960 --> 00:18:19,600
You measure something that seems reasonable.
534
00:18:19,600 --> 00:18:21,160
People naturally try to improve it.
535
00:18:21,160 --> 00:18:23,480
The system gets worse while the metric gets better.
536
00:18:23,480 --> 00:18:26,960
You have created a misalignment between the measurement and the outcome.
537
00:18:26,960 --> 00:18:29,360
And I have seen the consequences directly.
538
00:18:29,360 --> 00:18:33,520
Organizations measuring AI adoption percentage end up with teams using AI for everything.
539
00:18:33,520 --> 00:18:36,840
They use it for code where understanding matters more than speed.
540
00:18:36,840 --> 00:18:37,680
Business logic.
541
00:18:37,680 --> 00:18:39,040
Authentication layers.
542
00:18:39,040 --> 00:18:40,440
Data handling.
543
00:18:40,440 --> 00:18:43,040
These are places where correctness is non-negotiable.
544
00:18:43,040 --> 00:18:47,360
But the organization is chasing the KPI, so teams generate AI code there too.
545
00:18:47,360 --> 00:18:51,920
Organizations measuring PRs per developer end up with fragmented changes that are hard to review.
546
00:18:51,920 --> 00:18:55,080
This increases the very cognitive load we are trying to manage.
547
00:18:55,080 --> 00:18:59,040
A developer could write one coherent PR with three related features, or they could write
548
00:18:59,040 --> 00:19:02,720
five tiny PRs that are technically separate, but actually interdependent.
549
00:19:02,720 --> 00:19:05,160
The metric rewards fragmentation.
550
00:19:05,160 --> 00:19:08,040
Organizations measuring time saved end up with developers feeling busier.
551
00:19:08,040 --> 00:19:11,840
This happens because the save time is being spent on coordination and verification.
552
00:19:11,840 --> 00:19:13,240
You did not actually reduce work.
553
00:19:13,240 --> 00:19:14,480
You redistributed it.
554
00:19:14,480 --> 00:19:19,320
And you redistributed it toward the harder, more invisible work that nobody is measuring.
555
00:19:19,320 --> 00:19:23,480
This measuring code coverage end up with AI generated tests that look comprehensive but do not catch
556
00:19:23,480 --> 00:19:24,720
real defects.
557
00:19:24,720 --> 00:19:27,440
These tests pass the coverage metric but fail in production.
558
00:19:27,440 --> 00:19:28,760
You have optimized the metric.
559
00:19:28,760 --> 00:19:29,880
You have broken the system.
560
00:19:29,880 --> 00:19:31,600
The pattern is consistent.
561
00:19:31,600 --> 00:19:32,800
The metric becomes the goal.
562
00:19:32,800 --> 00:19:34,960
The goal becomes disconnected from reality.
563
00:19:34,960 --> 00:19:37,400
The system deteriorates while the metric improves.
564
00:19:37,400 --> 00:19:38,920
And the worst part is this.
565
00:19:38,920 --> 00:19:40,800
Nobody is gaming the system maliciously.
566
00:19:40,800 --> 00:19:42,280
Teams are not trying to hurt outcomes.
567
00:19:42,280 --> 00:19:44,600
They are trying to hit targets that leadership set.
568
00:19:44,600 --> 00:19:46,640
They are responding rationally to incentives.
569
00:19:46,640 --> 00:19:48,880
The toxicity is baked into the measurement itself.
570
00:19:48,880 --> 00:19:52,440
This is fixable but it requires rethinking what you measure and why.
571
00:19:52,440 --> 00:19:56,080
It requires acknowledging that the metrics you have been using do not actually measure
572
00:19:56,080 --> 00:19:57,200
system health.
573
00:19:57,200 --> 00:19:59,440
They measure motion and motion isn't health.
574
00:19:59,440 --> 00:20:01,080
From door or four to door or five.
575
00:20:01,080 --> 00:20:02,640
Door or metrics are not going away.
576
00:20:02,640 --> 00:20:04,760
The original four are still useful signals.
577
00:20:04,760 --> 00:20:08,440
But they are incomplete and the research community has finally acknowledged what has been
578
00:20:08,440 --> 00:20:11,360
broken since AI adoption accelerated.
579
00:20:11,360 --> 00:20:14,200
In 2025 and 2026, door are evolved.
580
00:20:14,200 --> 00:20:16,840
It did not replace the original metrics that added a fifth.
581
00:20:16,840 --> 00:20:17,840
Re-work rate.
582
00:20:17,840 --> 00:20:21,160
This is the metric that tells the truth about AI assisted development.
583
00:20:21,160 --> 00:20:26,280
It is the metric that cuts through the illusion and shows you what is actually happening.
584
00:20:26,280 --> 00:20:27,920
Re-work rate measures a simple thing.
585
00:20:27,920 --> 00:20:31,600
What percentage of code written in the last two weeks is being re-written, deleted or rolled
586
00:20:31,600 --> 00:20:32,360
back?
587
00:20:32,360 --> 00:20:34,400
Think about the implications.
588
00:20:34,400 --> 00:20:37,560
Code written last week is being re-written only 14 days later.
589
00:20:37,560 --> 00:20:39,040
That means something failed.
590
00:20:39,040 --> 00:20:43,280
Either the code was wrong or was right but fragile or it was right but created problems
591
00:20:43,280 --> 00:20:45,520
when it integrated with the rest of the system.
592
00:20:45,520 --> 00:20:49,200
In traditional software development, the re-work rate was typically 3-5%.
593
00:20:49,200 --> 00:20:52,000
You write code, it works, it stays, you move on.
594
00:20:52,000 --> 00:20:55,880
There are occasional bugs and occasional refactors but the system stays mostly stable.
595
00:20:55,880 --> 00:21:02,280
With AI adoption, the re-work rate has climbed to between 5.7 and 7.1% in many organizations.
596
00:21:02,280 --> 00:21:06,960
Some teams report even higher numbers, that is a 70-100% increase in code instability,
597
00:21:06,960 --> 00:21:09,400
that is the signal, that is what is actually happening.
598
00:21:09,400 --> 00:21:12,240
A high re-work rate tells you something specific.
599
00:21:12,240 --> 00:21:15,480
Code is not durable, it does not survive contact with the rest of the system.
600
00:21:15,480 --> 00:21:20,080
Quality gates are weak, bad code is getting through, verification is insufficient, people
601
00:21:20,080 --> 00:21:22,320
are approving code they do not understand.
602
00:21:22,320 --> 00:21:26,080
And AI is being used for the wrong things, it is being used in places where understanding
603
00:21:26,080 --> 00:21:28,320
matters more than speed.
604
00:21:28,320 --> 00:21:30,720
Re-work rate is the truth teller that Dora 4 was missing.
605
00:21:30,720 --> 00:21:34,480
It is the metric that shows whether your activity metrics are producing real value or just
606
00:21:34,480 --> 00:21:35,480
creating work.
607
00:21:35,480 --> 00:21:38,080
Here is how Dora 5 works in practice.
608
00:21:38,080 --> 00:21:41,880
Deployment frequency still matters but now it is contextualized by rework rate.
609
00:21:41,880 --> 00:21:47,080
A team shipping 5 times per day with 80% of code being rewritten is not performing better
610
00:21:47,080 --> 00:21:50,400
than a team shipping once per day with code that stays stable.
611
00:21:50,400 --> 00:21:53,680
The frequency metric is now a warning sign instead of a success signal.
612
00:21:53,680 --> 00:21:57,560
Lead time still matters but now it is decomposed into specific stages.
613
00:21:57,560 --> 00:22:02,040
Time to first review, how long does code wait before someone looks at it, review duration?
614
00:22:02,040 --> 00:22:03,880
How long does the review itself take?
615
00:22:03,880 --> 00:22:05,320
Time from approval to merge?
616
00:22:05,320 --> 00:22:07,320
That gap reveals uncertainty.
617
00:22:07,320 --> 00:22:10,600
Code is approved but reviewers are not confident enough to merge immediately.
618
00:22:10,600 --> 00:22:13,800
This decomposition shows you exactly where the bottleneck lives.
619
00:22:13,800 --> 00:22:17,640
Before AI lead time was mostly coding time and now it is mostly review time, that difference
620
00:22:17,640 --> 00:22:18,640
is structural.
621
00:22:18,640 --> 00:22:20,280
It tells you what to fix.
622
00:22:20,280 --> 00:22:24,200
Change failure rate still matters but now it is paired with test quality metrics.
623
00:22:24,200 --> 00:22:26,200
Did the test actually catch defects?
624
00:22:26,200 --> 00:22:28,120
Or are they just generating false confidence?
625
00:22:28,120 --> 00:22:31,400
You can have a low change failure rate with high incident rates in production.
626
00:22:31,400 --> 00:22:35,800
The metric lies, the tests are weak, mean time to recovery still matters but now it is segmented
627
00:22:35,800 --> 00:22:38,960
by AI assisted code versus human written code.
628
00:22:38,960 --> 00:22:43,160
Are AI generated changes recovering faster or slower than human code?
629
00:22:43,160 --> 00:22:45,040
The answer reveals something crucial.
630
00:22:45,040 --> 00:22:47,520
Are we shipping AI code that is harder to fix?
631
00:22:47,520 --> 00:22:51,640
Or is the recovery just taking longer because the cognitive load on operators is higher?
632
00:22:51,640 --> 00:22:53,760
Dora 5 tells a different story than Dora 4.
633
00:22:53,760 --> 00:22:57,600
A team with high deployment frequency, short lead time, low change failure rate and high
634
00:22:57,600 --> 00:22:59,320
rework rate is not healthy.
635
00:22:59,320 --> 00:23:03,400
They are shipping fast but breaking things constantly and fixing them in a cycle.
636
00:23:03,400 --> 00:23:05,000
That isn't productivity.
637
00:23:05,000 --> 00:23:06,320
That's noise.
638
00:23:06,320 --> 00:23:10,480
A team with lower deployment frequency, longer lead time, low change failure rate and low
639
00:23:10,480 --> 00:23:12,200
rework rate is performing well.
640
00:23:12,200 --> 00:23:14,800
They are shipping slower because they are being deliberate.
641
00:23:14,800 --> 00:23:17,800
Code is durable, quality is real, it stays fixed.
642
00:23:17,800 --> 00:23:21,440
The metrics now align with reality instead of contradicting it but here is the problem.
643
00:23:21,440 --> 00:23:23,680
Most organizations have not adopted Dora 5.
644
00:23:23,680 --> 00:23:27,760
They are still reading Dora 4, still chasing deployment frequency, still celebrating lead
645
00:23:27,760 --> 00:23:32,200
time improvements, still trusting change failure rate and the data is deceiving them.
646
00:23:32,200 --> 00:23:33,680
Your system has evolved.
647
00:23:33,680 --> 00:23:35,880
Your metrics haven't caught up yet.
648
00:23:35,880 --> 00:23:39,520
Decomposing lead time, lead time for changes looks like a single number.
649
00:23:39,520 --> 00:23:40,520
That's the problem.
650
00:23:40,520 --> 00:23:45,640
You look at your dashboard and it says, lead time is two days or four days or eight days.
651
00:23:45,640 --> 00:23:49,640
It's a single metric, it's clean, it's simple and it's misleading.
652
00:23:49,640 --> 00:23:54,040
Lead time is actually a journey with distinct stages and AI has changed where that time
653
00:23:54,040 --> 00:23:55,520
actually accumulates.
654
00:23:55,520 --> 00:23:59,200
You can't see the truth with an aggregate number, you have to break it apart.
655
00:23:59,200 --> 00:24:00,480
Let's walk through the journey.
656
00:24:00,480 --> 00:24:03,680
A piece of code takes from the moment it's committed to the moment it hits production.
657
00:24:03,680 --> 00:24:05,800
The first stage is the time to first review.
658
00:24:05,800 --> 00:24:06,800
It is committed.
659
00:24:06,800 --> 00:24:08,960
How long does it sit before someone actually looks at it?
660
00:24:08,960 --> 00:24:13,320
In traditional development, this was usually a matter of hours or maybe a day at most because
661
00:24:13,320 --> 00:24:15,440
the bottleneck was always somewhere else.
662
00:24:15,440 --> 00:24:18,160
But with AI adoption, this has become a genuine constraint.
663
00:24:18,160 --> 00:24:22,760
AI generates code in seconds, so that code just sits in a queue while reviewers are completely
664
00:24:22,760 --> 00:24:23,760
swamped.
665
00:24:23,760 --> 00:24:27,640
For some teams, the time to first review is now measured in days or even a week.
666
00:24:27,640 --> 00:24:31,400
This happens because AI generated code requires a much more careful review.
667
00:24:31,400 --> 00:24:32,960
You can't just skim it.
668
00:24:32,960 --> 00:24:36,440
This can't do a 15 minute scan and move on because they have to actually understand what
669
00:24:36,440 --> 00:24:38,640
the machine wrote and that takes time.
670
00:24:38,640 --> 00:24:40,440
The second stage is the review duration.
671
00:24:40,440 --> 00:24:44,200
This is the actual time spent reviewing and this is where you see the real explosion.
672
00:24:44,200 --> 00:24:48,600
Once a reviewer finally sits down with AI generated code, how long does it take to finish?
673
00:24:48,600 --> 00:24:52,920
A human written PR can often be reviewed in 30 minutes or maybe an hour if the logic is
674
00:24:52,920 --> 00:24:54,080
complex.
675
00:24:54,080 --> 00:24:58,320
But an AI generated PR with the same complexity and the same lines of code takes much longer
676
00:24:58,320 --> 00:25:01,280
because the AI didn't explain its design decisions.
677
00:25:01,280 --> 00:25:05,160
The AI didn't document the edge cases, so the reviewer has to reconstruct all of that
678
00:25:05,160 --> 00:25:07,480
context just by reading the implementation.
679
00:25:07,480 --> 00:25:10,840
That takes hours or sometimes days if it's really complex.
680
00:25:10,840 --> 00:25:14,560
Reviewers are trying to verify correctness while reading code they didn't write.
681
00:25:14,560 --> 00:25:17,960
They're asking if this actually does what the business needs if the AI hallucinated a
682
00:25:17,960 --> 00:25:20,800
library or if there are edge cases the model missed.
683
00:25:20,800 --> 00:25:23,880
They have to wonder if this will integrate cleanly with the rest of the system.
684
00:25:23,880 --> 00:25:27,160
That isn't a fast review, that's a thorough review and thorough review on AI code takes
685
00:25:27,160 --> 00:25:28,160
time.
686
00:25:28,160 --> 00:25:30,960
The third stage is the gap from review to merge.
687
00:25:30,960 --> 00:25:32,560
Approval doesn't always mean confidence.
688
00:25:32,560 --> 00:25:36,080
Approval just means the code is acceptable, so even after a reviewer says yes they might
689
00:25:36,080 --> 00:25:37,240
still have concerns.
690
00:25:37,240 --> 00:25:38,520
The merge gets delayed.
691
00:25:38,520 --> 00:25:42,760
Maybe the code is merged but flagged for heavy monitoring or it has to go to a staging environment
692
00:25:42,760 --> 00:25:43,760
first.
693
00:25:43,760 --> 00:25:45,720
That gap exists because uncertainty exists.
694
00:25:45,720 --> 00:25:47,800
The fourth stage is merge to production.
695
00:25:47,800 --> 00:25:51,480
Once the code is merged, how long until it's actually running for users?
696
00:25:51,480 --> 00:25:52,880
That depends on your release process.
697
00:25:52,880 --> 00:25:56,640
It could be hours or days and it's often gated by governance, you might need a security
698
00:25:56,640 --> 00:25:59,440
review or a compliance check before it goes live.
699
00:25:59,440 --> 00:26:01,840
These are new gates that didn't exist in the old model.
700
00:26:01,840 --> 00:26:05,000
Each of these stages tells a different story than your aggregate lead time.
701
00:26:05,000 --> 00:26:09,120
A team with a two day lead time where one full day is spent on review duration is not healthy.
702
00:26:09,120 --> 00:26:13,280
The review process is broken, reviewers are overloaded and code is just waiting but the
703
00:26:13,280 --> 00:26:15,440
one day metric hides that congestion.
704
00:26:15,440 --> 00:26:19,560
On the flip side a team with a four day lead time where only one day's actual work might
705
00:26:19,560 --> 00:26:21,080
be healthier than it looks.
706
00:26:21,080 --> 00:26:22,760
Three days of waiting is intentional.
707
00:26:22,760 --> 00:26:24,040
That's deliberate review.
708
00:26:24,040 --> 00:26:25,760
That's verification.
709
00:26:25,760 --> 00:26:27,720
Here's the crucial insight.
710
00:26:27,720 --> 00:26:31,080
Before AI, most of your lead time was actual work time.
711
00:26:31,080 --> 00:26:34,920
Coding was slow, so lead time was mostly coding time and the metric made sense.
712
00:26:34,920 --> 00:26:36,680
Now lead time is mostly review time.
713
00:26:36,680 --> 00:26:38,800
That's a different system with a different constraint.
714
00:26:38,800 --> 00:26:40,320
It's a different thing you need to fix.
715
00:26:40,320 --> 00:26:44,120
If your lead time is long because of review duration, the answer isn't to ship faster.
716
00:26:44,120 --> 00:26:47,280
The answer is to reduce the cognitive load on your reviewers.
717
00:26:47,280 --> 00:26:51,720
You need better tooling, better documentation from the AI, and clear policies about what
718
00:26:51,720 --> 00:26:53,600
the AI is allowed to generate.
719
00:26:53,600 --> 00:26:56,480
You need training on how to review AI code efficiently.
720
00:26:56,480 --> 00:26:58,520
You can't see that problem with an aggregate lead time.
721
00:26:58,520 --> 00:27:02,400
You need to see the stages decompose your lead time into those four parts and measure
722
00:27:02,400 --> 00:27:03,400
them separately.
723
00:27:03,400 --> 00:27:07,840
Now you can see where the time actually lives and that's where you intervene.
724
00:27:07,840 --> 00:27:09,640
Flow efficiency and system health.
725
00:27:09,640 --> 00:27:12,040
There's a metric most organizations don't track at all.
726
00:27:12,040 --> 00:27:15,440
It's the one that actually shows whether your system is healthy or collapsing.
727
00:27:15,440 --> 00:27:16,840
Flow efficiency.
728
00:27:16,840 --> 00:27:19,280
It measures something simple but revealing.
729
00:27:19,280 --> 00:27:23,360
What percentage of the time is work actually being worked on versus sitting in a queue?
730
00:27:23,360 --> 00:27:25,000
Think about the journey a PR takes.
731
00:27:25,000 --> 00:27:26,640
It gets created in waits for review.
732
00:27:26,640 --> 00:27:28,680
The review happens, then it waits for tests.
733
00:27:28,680 --> 00:27:30,760
The tests run, then it waits for approval.
734
00:27:30,760 --> 00:27:32,920
Approval happens, then it waits to be deployed.
735
00:27:32,920 --> 00:27:36,040
Once it's deployed, you might think it's being actively worked on, but it's actually
736
00:27:36,040 --> 00:27:39,800
just waiting for someone to verify it's not on fire in production.
737
00:27:39,800 --> 00:27:43,080
In each of those waiting periods, the work is consuming resources.
738
00:27:43,080 --> 00:27:47,360
It's occupying a slot in the queue and taking up space in someone's mental model, but nothing
739
00:27:47,360 --> 00:27:48,680
is actually happening.
740
00:27:48,680 --> 00:27:50,520
Time is passing and nothing changes.
741
00:27:50,520 --> 00:27:53,600
Flow efficiency divides the time work is actually being touched.
742
00:27:53,600 --> 00:27:57,720
Reviewed, tested, merged or deployed by the total time from start to finish.
743
00:27:57,720 --> 00:28:01,600
If a feature takes 10 days to go from creation to production, but only three of those days
744
00:28:01,600 --> 00:28:05,360
involved actual work, your flow efficiency is 30%.
745
00:28:05,360 --> 00:28:07,520
The other 70% is just queue time.
746
00:28:07,520 --> 00:28:11,400
In a healthy system, flow efficiency sits around 70 to 80%.
747
00:28:11,400 --> 00:28:14,800
Work moves through with minimal waiting because there are natural handoff points where
748
00:28:14,800 --> 00:28:16,520
work doesn't pile up.
749
00:28:16,520 --> 00:28:19,960
In a broken system, flow efficiency drops to 30 or 40%.
750
00:28:19,960 --> 00:28:22,000
Work is accumulating everywhere.
751
00:28:22,000 --> 00:28:25,280
Cues are forming and waiting dominates the entire timeline.
752
00:28:25,280 --> 00:28:29,560
Most organizations with high AI adoption have dropped into that broken zone.
753
00:28:29,560 --> 00:28:33,520
Work is being generated constantly because AI is churning out code, but that code is backing
754
00:28:33,520 --> 00:28:37,040
up in review, backing up in testing and backing up in approval.
755
00:28:37,040 --> 00:28:38,640
The system is congested.
756
00:28:38,640 --> 00:28:41,880
Your deployment frequency might look fantastic because you're shipping the stuff that finally
757
00:28:41,880 --> 00:28:43,320
made it through the congestion.
758
00:28:43,320 --> 00:28:44,880
The metric shows motion.
759
00:28:44,880 --> 00:28:46,800
The reality is gridlock.
760
00:28:46,800 --> 00:28:48,560
Here's the diagnostic power.
761
00:28:48,560 --> 00:28:51,000
Flow efficiency tells you exactly what's happening.
762
00:28:51,000 --> 00:28:55,320
If flow efficiency is low because of a review queue buildup, you have a review bottleneck.
763
00:28:55,320 --> 00:28:58,040
You need more review capacity or smaller review burden.
764
00:28:58,040 --> 00:29:01,480
Maybe you need better tooling or clearer policies about what needs a deep review and what
765
00:29:01,480 --> 00:29:02,480
doesn't.
766
00:29:02,480 --> 00:29:05,520
If it's low because testing is slow, you have a testing bottleneck.
767
00:29:05,520 --> 00:29:08,640
You need faster test automation or more testing resources.
768
00:29:08,640 --> 00:29:11,880
If it's low because of approval delays, you have a governance bottleneck.
769
00:29:11,880 --> 00:29:14,920
You need clearer approval criteria or fewer approval gates.
770
00:29:14,920 --> 00:29:16,520
Flow efficiency is diagnostic.
771
00:29:16,520 --> 00:29:18,280
It points directly at the problem.
772
00:29:18,280 --> 00:29:20,520
Since AI, the answer is usually review.
773
00:29:20,520 --> 00:29:24,680
Code is being generated faster than humans can verify it, so the review queue grows and
774
00:29:24,680 --> 00:29:26,000
flow efficiency drops.
775
00:29:26,000 --> 00:29:28,760
That's why your three day lead time metric is misleading.
776
00:29:28,760 --> 00:29:31,320
Most of those three days are queue time, not work time.
777
00:29:31,320 --> 00:29:34,520
Here's what healthy flow efficiency actually looks like in practice.
778
00:29:34,520 --> 00:29:37,520
Above 70% work is moving smoothly through the system.
779
00:29:37,520 --> 00:29:40,520
Waiting is minimal, and off's are clean, and the system is sustainable.
780
00:29:40,520 --> 00:29:42,560
You could maintain this pace indefinitely.
781
00:29:42,560 --> 00:29:45,120
Between 50 and 70%, there are bottlenecks.
782
00:29:45,120 --> 00:29:49,680
It's waiting between stages, and while it's not catastrophic yet, the system needs attention.
783
00:29:49,680 --> 00:29:51,640
Intervention would help here.
784
00:29:51,640 --> 00:29:53,960
Below 50% the system is broken.
785
00:29:53,960 --> 00:29:55,200
Work is just sitting in queues.
786
00:29:55,200 --> 00:29:57,640
The organization is busy, but it isn't productive.
787
00:29:57,640 --> 00:30:00,960
You're shipping things eventually, but the path is completely congested.
788
00:30:00,960 --> 00:30:03,760
This is where most high AI adoption teams are sitting right now.
789
00:30:03,760 --> 00:30:06,440
The power of flow efficiency is that it's unambiguous.
790
00:30:06,440 --> 00:30:08,200
You can't game it and you can't spin it.
791
00:30:08,200 --> 00:30:10,880
If flow efficiency is low, your system has a problem.
792
00:30:10,880 --> 00:30:12,960
The metric doesn't care about your narrative.
793
00:30:12,960 --> 00:30:14,760
It just shows you the reality.
794
00:30:14,760 --> 00:30:18,760
A team shipping constantly with 30% flow efficiency is not outperforming a team shipping slower
795
00:30:18,760 --> 00:30:21,080
with 75% flow efficiency.
796
00:30:21,080 --> 00:30:22,560
One team is creating noise.
797
00:30:22,560 --> 00:30:24,040
The other is creating throughput.
798
00:30:24,040 --> 00:30:27,280
Most organizations can't see this distinction with their current metrics.
799
00:30:27,280 --> 00:30:31,200
That's why they keep pushing for more deployment frequency and more AI adoption.
800
00:30:31,200 --> 00:30:32,520
They're optimizing for activity.
801
00:30:32,520 --> 00:30:35,120
They're missing the fact that the system has moved to flow.
802
00:30:35,120 --> 00:30:36,960
Start measuring flow efficiency.
803
00:30:36,960 --> 00:30:39,040
Decomposed by stage.
804
00:30:39,040 --> 00:30:40,360
Find where the work accumulates.
805
00:30:40,360 --> 00:30:42,320
That's where you fix the system.
806
00:30:42,320 --> 00:30:43,520
Cognitive load metrics.
807
00:30:43,520 --> 00:30:45,400
This is where measurement gets practical.
808
00:30:45,400 --> 00:30:46,400
You've seen the problem.
809
00:30:46,400 --> 00:30:48,200
Here's how you actually measure it.
810
00:30:48,200 --> 00:30:50,200
Cognitive load isn't visible in your current system.
811
00:30:50,200 --> 00:30:51,440
It's not on your dashboard.
812
00:30:51,440 --> 00:30:52,800
But it's measurable.
813
00:30:52,800 --> 00:30:54,320
You just have to know where to look.
814
00:30:54,320 --> 00:30:56,400
There are three measurement approaches that work.
815
00:30:56,400 --> 00:30:57,800
None of them alone is enough.
816
00:30:57,800 --> 00:31:01,640
But together, they tell you what's actually happening to your team.
817
00:31:01,640 --> 00:31:02,640
First approach.
818
00:31:02,640 --> 00:31:03,640
Self-report.
819
00:31:03,640 --> 00:31:04,640
Ask developers directly.
820
00:31:04,640 --> 00:31:06,720
How mentally demanding is your work?
821
00:31:06,720 --> 00:31:08,520
It's simple and direct.
822
00:31:08,520 --> 00:31:12,640
But it's also subjective because it's influenced by mood, stress, or even whether they
823
00:31:12,640 --> 00:31:13,640
had coffee.
824
00:31:13,640 --> 00:31:17,760
The inside here is that developers report lower satisfaction and higher mental strain,
825
00:31:17,760 --> 00:31:19,600
even as they're reporting time savings.
826
00:31:19,600 --> 00:31:20,600
That gap is revealing.
827
00:31:20,600 --> 00:31:23,840
They're saving time in one dimension and drowning in another.
828
00:31:23,840 --> 00:31:24,840
Second approach.
829
00:31:24,840 --> 00:31:25,840
Behavioral signals.
830
00:31:25,840 --> 00:31:29,200
You can't measure mental effort directly, but you can measure behaviors that correlate
831
00:31:29,200 --> 00:31:30,680
with cognitive load.
832
00:31:30,680 --> 00:31:32,120
Context switching frequency is a big one.
833
00:31:32,120 --> 00:31:36,280
How many different tools, tasks, and code bases does a developer touch per day?
834
00:31:36,280 --> 00:31:37,320
Then look at meeting load.
835
00:31:37,320 --> 00:31:40,600
How many hours are they in synchronous meetings versus focused work?
836
00:31:40,600 --> 00:31:43,000
Look at after hours work, when is code being committed?
837
00:31:43,000 --> 00:31:46,520
If it's mostly nights and weekends, that's a signal to check support ticket volume.
838
00:31:46,520 --> 00:31:49,880
When developers are blocked, they ask for help, so high support ticket volume indicates
839
00:31:49,880 --> 00:31:51,160
high cognitive load.
840
00:31:51,160 --> 00:31:52,840
Finally, look at onboarding time.
841
00:31:52,840 --> 00:31:56,200
New developers can't understand code bases written partly by AI, so they're starting
842
00:31:56,200 --> 00:31:59,360
slower, and that's cognitive load showing up as onboarding friction.
843
00:31:59,360 --> 00:32:03,680
These are indirect, but they're objective, and they paint a consistent picture.
844
00:32:03,680 --> 00:32:04,680
Third approach.
845
00:32:04,680 --> 00:32:05,680
System outcomes.
846
00:32:05,680 --> 00:32:08,920
When cognitive load is high, the system breaks down in specific ways.
847
00:32:08,920 --> 00:32:14,400
Defect rate goes up, incident rate goes up, turnover increases, developer satisfaction declines,
848
00:32:14,400 --> 00:32:16,360
code quality metrics show degradation.
849
00:32:16,360 --> 00:32:19,760
These are lagging indicators, so by the time you see them, the damage is already done,
850
00:32:19,760 --> 00:32:21,880
but they're undeniable.
851
00:32:21,880 --> 00:32:23,840
Here's what the research shows.
852
00:32:23,840 --> 00:32:26,160
Developers with high cognitive load make more mistakes.
853
00:32:26,160 --> 00:32:27,360
They ship code with defects.
854
00:32:27,360 --> 00:32:28,360
They miss edge cases.
855
00:32:28,360 --> 00:32:29,920
They don't think through implications.
856
00:32:29,920 --> 00:32:31,400
It's not because they're less competent.
857
00:32:31,400 --> 00:32:35,440
It's because their working memory is occupied with overhead instead of with the actual
858
00:32:35,440 --> 00:32:36,440
problem.
859
00:32:36,440 --> 00:32:40,240
They're not just about trying to understand AI generated code, while also writing their
860
00:32:40,240 --> 00:32:44,800
own code, while also reviewing someone else's code, while also sitting in a governance meeting
861
00:32:44,800 --> 00:32:48,520
has no cognitive capacity left for deep thinking about correctness.
862
00:32:48,520 --> 00:32:49,600
They're running on fumes.
863
00:32:49,600 --> 00:32:54,080
The code they produce is less careful, less thoughtful, and less correct.
864
00:32:54,080 --> 00:32:56,440
Developers with sustained high cognitive load burn out.
865
00:32:56,440 --> 00:32:57,440
They leave.
866
00:32:57,440 --> 00:32:58,440
They disengage.
867
00:32:58,440 --> 00:32:59,440
They stop caring.
868
00:32:59,440 --> 00:33:02,280
Organizations with high AI adoption and unchanged measurement approaches are now seeing
869
00:33:02,280 --> 00:33:03,480
attrition spikes.
870
00:33:03,480 --> 00:33:06,040
The best people leave first because they have options.
871
00:33:06,040 --> 00:33:09,760
The remaining people are more burnt out because there's less experience in the room.
872
00:33:09,760 --> 00:33:11,960
Developers with chronic overload are less creative.
873
00:33:11,960 --> 00:33:13,520
They solve the immediate problem.
874
00:33:13,520 --> 00:33:14,960
They don't think about the bigger picture.
875
00:33:14,960 --> 00:33:15,960
They don't re-factor.
876
00:33:15,960 --> 00:33:16,960
They don't improve.
877
00:33:16,960 --> 00:33:18,560
They don't propose innovations.
878
00:33:18,560 --> 00:33:20,080
They're just trying to get through the day.
879
00:33:20,080 --> 00:33:22,160
This is the hidden cost of the productivity illusion.
880
00:33:22,160 --> 00:33:26,160
You're trading long term system health for short term activity metrics.
881
00:33:26,160 --> 00:33:27,480
And the people are paying the price.
882
00:33:27,480 --> 00:33:29,120
Here's what you should actually measure.
883
00:33:29,120 --> 00:33:30,440
Perceived cognitive load.
884
00:33:30,440 --> 00:33:34,440
Run a quarterly survey and ask them to rate their mental burden on a scale of 1 to 10.
885
00:33:34,440 --> 00:33:36,720
Check the trend if it's rising something is wrong.
886
00:33:36,720 --> 00:33:37,720
Context switching.
887
00:33:37,720 --> 00:33:41,960
Count tool switches, task switches and code based switches per developer per day.
888
00:33:41,960 --> 00:33:42,960
Track the trend.
889
00:33:42,960 --> 00:33:45,080
Above 5 switches per day is fragmentation.
890
00:33:45,080 --> 00:33:46,080
Focus time.
891
00:33:46,080 --> 00:33:47,360
Measure uninterrupted blocks of work.
892
00:33:47,360 --> 00:33:51,320
90 minute focus blocks are healthy, but anything below that is fragmentation.
893
00:33:51,320 --> 00:33:52,640
Defect rate by author.
894
00:33:52,640 --> 00:33:55,920
Compare defects in AI generated code versus human written code.
895
00:33:55,920 --> 00:34:00,080
If AI code has higher defect rates, your verification is insufficient.
896
00:34:00,080 --> 00:34:01,240
Rework by author.
897
00:34:01,240 --> 00:34:05,320
Rework rate for AI generated code versus human written code separately.
898
00:34:05,320 --> 00:34:07,200
They're different signals.
899
00:34:07,200 --> 00:34:08,760
Developer satisfaction.
900
00:34:08,760 --> 00:34:10,320
Ask a direct question.
901
00:34:10,320 --> 00:34:12,440
Do you have time to do your best work?
902
00:34:12,440 --> 00:34:13,360
Track the trend.
903
00:34:13,360 --> 00:34:15,280
This is a leading indicator of attrition.
904
00:34:15,280 --> 00:34:16,160
Attrition rate.
905
00:34:16,160 --> 00:34:18,840
Track turnover and compare it to industry benchmarks.
906
00:34:18,840 --> 00:34:20,360
High attrition is system failure.
907
00:34:20,360 --> 00:34:22,840
These metrics together reveal cognitive load.
908
00:34:22,840 --> 00:34:25,560
And once you're measuring it, you can start managing it.
909
00:34:25,560 --> 00:34:26,880
The governance bottleneck.
910
00:34:26,880 --> 00:34:30,520
Here's something nobody talks about because it's quiet and it happens in rooms
911
00:34:30,520 --> 00:34:32,320
that don't show up on your dashboard.
912
00:34:32,320 --> 00:34:36,880
AI has created a new bottleneck in governance and it's slowing down delivery
913
00:34:36,880 --> 00:34:39,040
in ways that don't register as a slowdown.
914
00:34:39,040 --> 00:34:43,400
Before AI, governance was about security, compliance and risk management.
915
00:34:43,400 --> 00:34:46,200
You had policies, you had gates, you had approval processes.
916
00:34:46,200 --> 00:34:48,640
They existed, people followed them and things moved.
917
00:34:48,640 --> 00:34:51,520
With AI, governance became a different question entirely.
918
00:34:51,520 --> 00:34:52,880
Is this AI code safe?
919
00:34:52,880 --> 00:34:53,520
Is it correct?
920
00:34:53,520 --> 00:34:54,320
Is it secure?
921
00:34:54,320 --> 00:34:56,000
Do we even understand what it does?
922
00:34:56,000 --> 00:34:58,320
That's a fundamentally different kind of gate.
923
00:34:58,320 --> 00:35:00,520
And it's forming everywhere simultaneously.
924
00:35:00,520 --> 00:35:03,840
Security teams are reviewing AI-generated code now because they have to.
925
00:35:03,840 --> 00:35:07,760
AI can generate code with subtle security flaws that a human might not write.
926
00:35:07,760 --> 00:35:11,520
A SQL injection vulnerability buried in generated code or a privileged escalation
927
00:35:11,520 --> 00:35:14,440
hidden in layers of abstraction requires careful, deliberate review.
928
00:35:14,440 --> 00:35:15,960
It's not a five minute scan.
929
00:35:15,960 --> 00:35:17,400
Compliance teams have new gates now.
930
00:35:17,400 --> 00:35:20,000
Does this AI code meet our compliance requirements?
931
00:35:20,000 --> 00:35:21,360
In finance, that's critical.
932
00:35:21,360 --> 00:35:22,840
In healthcare, it's non-negotiable.
933
00:35:22,840 --> 00:35:26,160
AI might generate code that doesn't hold audit trails properly,
934
00:35:26,160 --> 00:35:30,440
might violate data retention policies or might not log access correctly.
935
00:35:30,440 --> 00:35:31,720
That requires scrutiny.
936
00:35:31,720 --> 00:35:33,560
Architecture teams are asking new questions.
937
00:35:33,560 --> 00:35:35,720
Is this AI code aligned with our architecture?
938
00:35:35,720 --> 00:35:40,360
AI can generate code that solves the immediate problem while creating technical debt.
939
00:35:40,360 --> 00:35:43,920
It might duplicate logic instead of refactoring or create tight coupling
940
00:35:43,920 --> 00:35:45,320
instead of loose connections.
941
00:35:45,320 --> 00:35:47,280
That needs review.
942
00:35:47,280 --> 00:35:50,280
Risk teams are asking, what's the risk if this code fails?
943
00:35:50,280 --> 00:35:53,280
AI-generated code might have failure modes that aren't obvious.
944
00:35:53,280 --> 00:35:54,360
What happens under load?
945
00:35:54,360 --> 00:35:55,840
What happens with missing data?
946
00:35:55,840 --> 00:35:58,480
What's the cascade effect if this component is down?
947
00:35:58,480 --> 00:35:59,920
That requires analysis.
948
00:35:59,920 --> 00:36:01,200
Each of these is a gate.
949
00:36:01,200 --> 00:36:02,200
Each gate at its time.
950
00:36:02,200 --> 00:36:06,520
Lead time increases because code flows through these gates sequentially instead of in parallel.
951
00:36:06,520 --> 00:36:08,920
Flow efficiency decreases because there's more waiting.
952
00:36:08,920 --> 00:36:10,000
But here's the real problem.
953
00:36:10,000 --> 00:36:11,720
The governance gates are often unclear.
954
00:36:11,720 --> 00:36:13,120
What exactly are we checking for?
955
00:36:13,120 --> 00:36:14,640
What's the criteria for approval?
956
00:36:14,640 --> 00:36:16,120
How much scrutiny is enough?
957
00:36:16,120 --> 00:36:18,640
If you don't know the answer, you overdue the review.
958
00:36:18,640 --> 00:36:21,280
You ask more questions and you wait for more certainty.
959
00:36:21,280 --> 00:36:24,240
Approval takes longer because uncertainty lives in that room.
960
00:36:24,240 --> 00:36:25,720
That ambiguity cascades.
961
00:36:25,720 --> 00:36:27,000
Reviewers are uncertain.
962
00:36:27,000 --> 00:36:31,400
So they ask for more evidence that evidence takes time together and that time delays approval.
963
00:36:31,400 --> 00:36:32,880
That delay backs up the queue.
964
00:36:32,880 --> 00:36:37,320
Mature organizations have figured out how to manage this without completely strangling delivery.
965
00:36:37,320 --> 00:36:38,840
They've made a structural choice.
966
00:36:38,840 --> 00:36:40,360
Governance stops being hidden.
967
00:36:40,360 --> 00:36:41,600
It becomes explicit.
968
00:36:41,600 --> 00:36:43,360
They clarify AI code policies.
969
00:36:43,360 --> 00:36:45,600
What can AI generate without additional review?
970
00:36:45,600 --> 00:36:47,280
What requires deep human scrutiny?
971
00:36:47,280 --> 00:36:48,760
What gets flagged for compliance?
972
00:36:48,760 --> 00:36:53,040
Clear policies reduce ambiguity, so reviewers know what they're checking for and code moves forward.
973
00:36:53,040 --> 00:36:54,600
They automate governance checks.
974
00:36:54,600 --> 00:36:59,920
Security scanning, compliance validation and architecture rule checking should happen in CICD.
975
00:36:59,920 --> 00:37:03,440
Code fails fast if it violates governance and that feedback is immediate.
976
00:37:03,440 --> 00:37:05,840
There's no waiting for a human to notice the problem.
977
00:37:05,840 --> 00:37:08,560
They create AI-specific review criteria.
978
00:37:08,560 --> 00:37:10,360
Don't just ask, is the code correct?
979
00:37:10,360 --> 00:37:12,080
Ask, is this the right approach?
980
00:37:12,080 --> 00:37:14,960
Ask, did the AI understand the requirements?
981
00:37:14,960 --> 00:37:18,000
Ask, is this maintainable by someone who didn't write it?
982
00:37:18,000 --> 00:37:20,760
Those questions are specific, so reviewers can actually answer them.
983
00:37:20,760 --> 00:37:25,080
They distribute review responsibility, train mid-level engineers to review AI code.
984
00:37:25,080 --> 00:37:26,760
They don't need to be experts in every domain.
985
00:37:26,760 --> 00:37:30,040
They just need to understand the AI code reviewing framework.
986
00:37:30,040 --> 00:37:33,240
That spreads cognitive load across the team instead of concentrating it on seniors.
987
00:37:33,240 --> 00:37:34,840
They said expectations about time.
988
00:37:34,840 --> 00:37:37,760
AI code requires more review, so lead time will be longer.
989
00:37:37,760 --> 00:37:38,760
That's not a failure.
990
00:37:38,760 --> 00:37:39,760
That's a choice.
991
00:37:39,760 --> 00:37:41,480
Quality and certainty matter more than speed.
992
00:37:41,480 --> 00:37:45,200
The governance bottleneck is real, but it's fixable when you make it explicit instead
993
00:37:45,200 --> 00:37:46,880
of letting it hide in the system.
994
00:37:46,880 --> 00:37:48,040
The burnout signal.
995
00:37:48,040 --> 00:37:50,000
There is something hidden in your metrics.
996
00:37:50,000 --> 00:37:53,200
It's the thing that happens when cognitive load becomes chronic.
997
00:37:53,200 --> 00:37:55,920
And it's what kills systems from the inside burnout.
998
00:37:55,920 --> 00:37:58,880
We're seeing at spike in engineering teams with high AI adoption.
999
00:37:58,880 --> 00:38:02,400
Not because the AI is bad, but because you change the workflow without changing how you
1000
00:38:02,400 --> 00:38:05,440
measure health, people are drowning and nobody is watching.
1001
00:38:05,440 --> 00:38:07,520
The research is clear.
1002
00:38:07,520 --> 00:38:12,400
92% of workers right now report active mental or cognitive strain.
1003
00:38:12,400 --> 00:38:13,840
That isn't just the status quo.
1004
00:38:13,840 --> 00:38:16,240
That's a crisis.
1005
00:38:16,240 --> 00:38:19,480
When more than nine out of ten people feel strained at work, you aren't looking at a
1006
00:38:19,480 --> 00:38:20,480
personal problem.
1007
00:38:20,480 --> 00:38:22,320
You're looking at a systemic failure.
1008
00:38:22,320 --> 00:38:26,320
37% of those people say the pressure has intensified over the last year.
1009
00:38:26,320 --> 00:38:28,680
As AI adoption went up, cognitive load went up.
1010
00:38:28,680 --> 00:38:30,680
As load went up, strain followed.
1011
00:38:30,680 --> 00:38:31,840
And here is the problem.
1012
00:38:31,840 --> 00:38:36,360
44% of workers say this mental strain has undermined their ability to use good judgment.
1013
00:38:36,360 --> 00:38:39,240
You have people making critical decisions under total overload.
1014
00:38:39,240 --> 00:38:40,520
They aren't thinking clearly.
1015
00:38:40,520 --> 00:38:42,800
They aren't considering the long term implications.
1016
00:38:42,800 --> 00:38:43,800
They aren't catching bugs.
1017
00:38:43,800 --> 00:38:45,760
They're just trying to survive the day.
1018
00:38:45,760 --> 00:38:48,080
This is happening inside your organization right now.
1019
00:38:48,080 --> 00:38:49,440
And your dashboard doesn't show it.
1020
00:38:49,440 --> 00:38:50,440
Burnout isn't an emotion.
1021
00:38:50,440 --> 00:38:51,440
It's a system failure.
1022
00:38:51,440 --> 00:38:55,880
It's what happens when cognitive load stays high for too long without any support.
1023
00:38:55,880 --> 00:38:58,640
And it shows up in specific ways if you know where to look.
1024
00:38:58,640 --> 00:38:59,800
Attrition is the first signal.
1025
00:38:59,800 --> 00:39:00,800
People leave.
1026
00:39:00,800 --> 00:39:02,800
The best people leave first because they have the most options.
1027
00:39:02,800 --> 00:39:06,360
A senior engineer who knows how to work with AI can get a job anywhere.
1028
00:39:06,360 --> 00:39:08,360
So they don't stay on a burned out team.
1029
00:39:08,360 --> 00:39:12,800
When the experts walk out the door, the remaining team is less experienced and less capable.
1030
00:39:12,800 --> 00:39:16,160
That experience gap creates even more load on the survivors.
1031
00:39:16,160 --> 00:39:17,960
This engagement is the second signal.
1032
00:39:17,960 --> 00:39:19,200
People stop caring.
1033
00:39:19,200 --> 00:39:21,360
They show up and do the minimum work required.
1034
00:39:21,360 --> 00:39:23,680
But they don't propose improvements or mentor juniors.
1035
00:39:23,680 --> 00:39:24,920
They stop taking ownership.
1036
00:39:24,920 --> 00:39:26,720
They're just occupying a chair.
1037
00:39:26,720 --> 00:39:29,280
Quality drops because nobody is invested in the outcome anymore.
1038
00:39:29,280 --> 00:39:31,200
Mistakes increase.
1039
00:39:31,200 --> 00:39:35,320
When people are burnt out, they make more errors because cognitive overload destroys working
1040
00:39:35,320 --> 00:39:36,320
memory.
1041
00:39:36,320 --> 00:39:37,320
They miss edge cases.
1042
00:39:37,320 --> 00:39:40,480
They ship code with obvious bugs because they literally don't have the mental capacity
1043
00:39:40,480 --> 00:39:41,480
to see them.
1044
00:39:41,480 --> 00:39:42,480
Resentment builds.
1045
00:39:42,480 --> 00:39:43,480
People start to hate the tools.
1046
00:39:43,480 --> 00:39:44,480
They hate the pace.
1047
00:39:44,480 --> 00:39:45,480
They hate the pressure.
1048
00:39:45,480 --> 00:39:48,120
That resentment creates friction and kills psychological safety.
1049
00:39:48,120 --> 00:39:50,200
People stop helping each other because they're all drowning.
1050
00:39:50,200 --> 00:39:51,920
And sometimes, they're sabotage.
1051
00:39:51,920 --> 00:39:53,440
Not the malicious kind.
1052
00:39:53,440 --> 00:39:57,360
But people stop following best practices because the system already feels broken.
1053
00:39:57,360 --> 00:39:58,360
They cut corners.
1054
00:39:58,360 --> 00:40:01,680
They ship risky code because the environment feels chaotic anyway.
1055
00:40:01,680 --> 00:40:05,680
If everything is going to be fragile, why spend the extra hour making it solid?
1056
00:40:05,680 --> 00:40:08,040
All of this is happening right now in teams using AI.
1057
00:40:08,040 --> 00:40:10,880
The metrics don't show it because they measure output.
1058
00:40:10,880 --> 00:40:11,880
Not strained.
1059
00:40:11,880 --> 00:40:12,880
The connection is simple.
1060
00:40:12,880 --> 00:40:15,160
High cognitive load creates sustained stress.
1061
00:40:15,160 --> 00:40:16,760
Stress creates burn out.
1062
00:40:16,760 --> 00:40:18,920
Burn out leads to attrition and disengagement.
1063
00:40:18,920 --> 00:40:21,120
Disengagement means quality drops.
1064
00:40:21,120 --> 00:40:23,280
Lower quality leads to more incidents.
1065
00:40:23,280 --> 00:40:27,520
More incidents mean more rework and more rework leads right back to higher cognitive load.
1066
00:40:27,520 --> 00:40:28,680
It's a vicious cycle.
1067
00:40:28,680 --> 00:40:30,840
The productivity illusion masks the whole thing.
1068
00:40:30,840 --> 00:40:31,760
Your metrics look good.
1069
00:40:31,760 --> 00:40:32,760
Activity is high.
1070
00:40:32,760 --> 00:40:34,200
Code is shipping.
1071
00:40:34,200 --> 00:40:35,560
But the human system is degrading.
1072
00:40:35,560 --> 00:40:39,480
By the time it shows up in your turnover data, the damage is already done.
1073
00:40:39,480 --> 00:40:42,840
To see burn out before it destroys the team, you have to measure differently.
1074
00:40:42,840 --> 00:40:45,360
Ask developers about their satisfaction every quarter.
1075
00:40:45,360 --> 00:40:47,160
Do they have time to do their best work?
1076
00:40:47,160 --> 00:40:48,640
Do they feel supported?
1077
00:40:48,640 --> 00:40:50,560
Track the trend.
1078
00:40:50,560 --> 00:40:52,120
Monitor your attrition.
1079
00:40:52,120 --> 00:40:56,120
If you're losing more people than the industry average, burn out is the likely reason.
1080
00:40:56,120 --> 00:40:57,480
Watch when code is being committed.
1081
00:40:57,480 --> 00:41:01,120
If it's happening at 2 a.m. or on Sunday afternoon, people are working extra hours just
1082
00:41:01,120 --> 00:41:02,120
to keep up.
1083
00:41:02,120 --> 00:41:04,040
Count the support requests.
1084
00:41:04,040 --> 00:41:06,000
When developers are stuck, they ask for help.
1085
00:41:06,000 --> 00:41:07,640
High volume means high load.
1086
00:41:07,640 --> 00:41:09,760
Read your incident post mortems.
1087
00:41:09,760 --> 00:41:12,840
Look for phrases like "we were rushed" or "overloaded".
1088
00:41:12,840 --> 00:41:14,200
Those are your burnout signals.
1089
00:41:14,200 --> 00:41:17,640
The metrics tell a story if you're actually paying attention.
1090
00:41:17,640 --> 00:41:20,080
Value delivery versus activity delivery.
1091
00:41:20,080 --> 00:41:22,760
Most organizations are missing a fundamental distinction.
1092
00:41:22,760 --> 00:41:26,600
It's the one that determines whether your business survives or collapses from the inside.
1093
00:41:26,600 --> 00:41:28,880
The difference between activity and value.
1094
00:41:28,880 --> 00:41:29,880
Activity is motion.
1095
00:41:29,880 --> 00:41:30,880
How much code you wrote?
1096
00:41:30,880 --> 00:41:32,120
How many features you shipped?
1097
00:41:32,120 --> 00:41:33,360
How many times you deployed?
1098
00:41:33,360 --> 00:41:35,160
Your dashboard measures activity.
1099
00:41:35,160 --> 00:41:37,000
An activity has never looked better.
1100
00:41:37,000 --> 00:41:38,080
Value is the outcome.
1101
00:41:38,080 --> 00:41:40,360
It's what customers can actually do because of your code.
1102
00:41:40,360 --> 00:41:43,040
It's the problems you solved and the revenue you generated.
1103
00:41:43,040 --> 00:41:44,720
This value, these are not the same thing.
1104
00:41:44,720 --> 00:41:48,080
And with AI, the gap between them has become a disaster.
1105
00:41:48,080 --> 00:41:51,280
Think about a team that ships 100 features in a single quarter.
1106
00:41:51,280 --> 00:41:53,560
On paper, they look incredibly productive.
1107
00:41:53,560 --> 00:41:57,680
But if 80 of those features are never used, the activity was high while the value was low.
1108
00:41:57,680 --> 00:41:59,920
They were shipped because they could be shipped.
1109
00:41:59,920 --> 00:42:03,160
The AI could generate them so they went through review and got deployed.
1110
00:42:03,160 --> 00:42:04,840
The activity happened.
1111
00:42:04,840 --> 00:42:08,920
But the value was only in those 20 features people actually touched.
1112
00:42:08,920 --> 00:42:11,120
This is happening at scale right now.
1113
00:42:11,120 --> 00:42:12,760
Organizations are shipping constantly.
1114
00:42:12,760 --> 00:42:15,600
The activity looks fantastic, but adoption is flat.
1115
00:42:15,600 --> 00:42:17,240
Customers aren't using more of your product.
1116
00:42:17,240 --> 00:42:19,480
They're using the same core features they always used.
1117
00:42:19,480 --> 00:42:20,880
The rest is just noise.
1118
00:42:20,880 --> 00:42:21,880
Why?
1119
00:42:21,880 --> 00:42:22,880
Because activity is easy now.
1120
00:42:22,880 --> 00:42:24,320
AI makes motion trivial.
1121
00:42:24,320 --> 00:42:25,480
You prompt a system.
1122
00:42:25,480 --> 00:42:28,320
It generates code and that code flows through to production.
1123
00:42:28,320 --> 00:42:30,240
But nobody asked if anyone actually needed it.
1124
00:42:30,240 --> 00:42:33,680
Nobody validated the idea or checked if it solved a real problem.
1125
00:42:33,680 --> 00:42:35,120
Value requires a different process.
1126
00:42:35,120 --> 00:42:38,400
It requires understanding customer needs and solving real problems.
1127
00:42:38,400 --> 00:42:42,720
It takes time to build features people actually want and even more time to maintain them.
1128
00:42:42,720 --> 00:42:43,720
That's hard.
1129
00:42:43,720 --> 00:42:44,720
It requires thinking and attention.
1130
00:42:44,720 --> 00:42:45,920
Activity requires none of that.
1131
00:42:45,920 --> 00:42:47,680
You just generate, ship and move on.
1132
00:42:47,680 --> 00:42:50,200
So organizations are optimizing for the wrong thing.
1133
00:42:50,200 --> 00:42:54,000
They're shipping more and deploying more and the activity metrics are exploding.
1134
00:42:54,000 --> 00:42:57,560
But value is declining because nobody is checking if the work actually matters.
1135
00:42:57,560 --> 00:42:59,120
The data shows it.
1136
00:42:59,120 --> 00:43:00,520
Feature adoption is dropping.
1137
00:43:00,520 --> 00:43:03,360
We've gone from shipping 10 features where 8 are used.
1138
00:43:03,360 --> 00:43:06,160
To shipping 100 features where only 20 are used.
1139
00:43:06,160 --> 00:43:07,440
The ratio is broken.
1140
00:43:07,440 --> 00:43:10,400
The activity exploded, but the value dropped.
1141
00:43:10,400 --> 00:43:12,640
Technical debt is also piling up faster than ever.
1142
00:43:12,640 --> 00:43:16,120
Your code is being written, which means more code becomes debt because it isn't maintained
1143
00:43:16,120 --> 00:43:18,360
or understood that code still has to be managed.
1144
00:43:18,360 --> 00:43:21,400
It consumes resources and slows down everything it touches.
1145
00:43:21,400 --> 00:43:23,360
Customer satisfaction is flat.
1146
00:43:23,360 --> 00:43:24,360
Why would they be happier?
1147
00:43:24,360 --> 00:43:26,120
They're getting features they don't need.
1148
00:43:26,120 --> 00:43:27,120
That isn't value.
1149
00:43:27,120 --> 00:43:28,360
It's clutter.
1150
00:43:28,360 --> 00:43:31,320
The productivity illusion is confusing motion with progress.
1151
00:43:31,320 --> 00:43:34,560
Activity looks good, but value is invisible because you aren't measuring it.
1152
00:43:34,560 --> 00:43:36,280
Here is what you should track instead.
1153
00:43:36,280 --> 00:43:37,560
Measure feature adoption.
1154
00:43:37,560 --> 00:43:40,120
What percentage of your shipped features are actually used?
1155
00:43:40,120 --> 00:43:42,600
If it's below 50%, you have a value problem.
1156
00:43:42,600 --> 00:43:44,120
Look at customer outcomes.
1157
00:43:44,120 --> 00:43:46,280
What can they do now that they couldn't do last month?
1158
00:43:46,280 --> 00:43:47,520
Check your technical health.
1159
00:43:47,520 --> 00:43:50,360
Is the code base getting easier to work with or harder?
1160
00:43:50,360 --> 00:43:53,040
If debt is accumulating, you won't be able to keep shipping for long.
1161
00:43:53,040 --> 00:43:54,560
Watch your maintenance burden.
1162
00:43:54,560 --> 00:43:57,920
How much time is spent keeping old code alive versus building new things?
1163
00:43:57,920 --> 00:44:01,240
If that number is above 40%, your system is starting to freeze.
1164
00:44:01,240 --> 00:44:04,560
These metrics tell you if you're creating value or just generating noise.
1165
00:44:04,560 --> 00:44:07,720
And with AI, the answer for most companies is clear.
1166
00:44:07,720 --> 00:44:11,560
If you want your organization to actually improve instead of just looking better on paper,
1167
00:44:11,560 --> 00:44:13,600
you have to change how you think about data.
1168
00:44:13,600 --> 00:44:15,600
Stop using metrics as performance sticks.
1169
00:44:15,600 --> 00:44:16,960
Start using them as diagnostic tools.
1170
00:44:16,960 --> 00:44:19,320
A performance stick is something you use to judge people.
1171
00:44:19,320 --> 00:44:23,600
You measure an output, you publish it, and then you hold someone accountable for the
1172
00:44:23,600 --> 00:44:24,600
number.
1173
00:44:24,600 --> 00:44:28,960
You might tell a developer they shipped 50 pull requests this sprint and call that good,
1174
00:44:28,960 --> 00:44:32,000
or point out that their code is not good.
1175
00:44:32,000 --> 00:44:39,000
You might tell a developer they shipped 50 pull requests this sprint and call that good,
1176
00:44:39,000 --> 00:44:40,000
or point out that their code has three defects and call that bad.
1177
00:44:40,000 --> 00:44:41,080
The metric becomes a weapon.
1178
00:44:41,080 --> 00:44:43,600
It becomes a way to evaluate whether someone is doing their job.
1179
00:44:43,600 --> 00:44:45,120
A diagnostic tool is different.
1180
00:44:45,120 --> 00:44:46,680
You use it to understand the system.
1181
00:44:46,680 --> 00:44:49,240
It acts as a lens into how the work is actually flowing.
1182
00:44:49,240 --> 00:44:53,480
You ask why the review cycle time is increasing or where the system has friction.
1183
00:44:53,480 --> 00:44:56,000
You look for the constraint so you can figure out what to fix.
1184
00:44:56,000 --> 00:44:59,520
This is a fundamental shift in mindset and it changes everything about how you use data.
1185
00:44:59,520 --> 00:45:03,720
When you have a performance stick mentality, metrics drive toxic behaviors.
1186
00:45:03,720 --> 00:45:07,360
People stop optimizing for the system and start optimizing for the metric.
1187
00:45:07,360 --> 00:45:10,880
They hide problems, they game the numbers, they blame individuals instead of fixing the
1188
00:45:10,880 --> 00:45:11,880
structure.
1189
00:45:11,880 --> 00:45:15,880
A team might want to look good on a deployment frequency metric so they start deploying smaller
1190
00:45:15,880 --> 00:45:17,160
changes more often.
1191
00:45:17,160 --> 00:45:20,360
Some of these are rollbacks, others are hot fixes for earlier deployments.
1192
00:45:20,360 --> 00:45:24,200
The frequency goes up while stability goes down, but nobody wants to talk about stability
1193
00:45:24,200 --> 00:45:26,840
because the metric is the only target that matters.
1194
00:45:26,840 --> 00:45:30,360
The team might want to look good on code coverage so they generate tests that pass without actually
1195
00:45:30,360 --> 00:45:31,720
catching any bugs.
1196
00:45:31,720 --> 00:45:34,120
The percentage climbs while real defects escape.
1197
00:45:34,120 --> 00:45:36,880
The metric is a lie, but it looks great on a slide.
1198
00:45:36,880 --> 00:45:39,960
With a diagnostic tool mentality, metrics guide improvement.
1199
00:45:39,960 --> 00:45:42,160
You use data to see where the system is breaking.
1200
00:45:42,160 --> 00:45:45,000
You identify root causes instead of just treating symptoms.
1201
00:45:45,000 --> 00:45:48,280
You test to change, you measure the impact, and you improve the system rather than the
1202
00:45:48,280 --> 00:45:49,280
number.
1203
00:45:49,280 --> 00:45:50,600
Here's how that looks in practice.
1204
00:45:50,600 --> 00:45:54,400
The old approach says deployment frequency is low and engineers aren't shipping fast
1205
00:45:54,400 --> 00:45:55,400
enough.
1206
00:45:55,400 --> 00:45:58,280
The target of five deployments per day and holds the teams accountable.
1207
00:45:58,280 --> 00:46:00,160
The result is exactly what we just described.
1208
00:46:00,160 --> 00:46:03,160
Engineers ship constantly while the stability of the product collapses.
1209
00:46:03,160 --> 00:46:06,880
The new approach looks at that same low frequency and asks why it's happening.
1210
00:46:06,880 --> 00:46:10,880
You investigate whether there is a technical constraint, a hidden process gate, or quality
1211
00:46:10,880 --> 00:46:12,800
concern making people cautious.
1212
00:46:12,800 --> 00:46:14,800
You find the actual bottleneck and fix it.
1213
00:46:14,800 --> 00:46:18,320
Then you measure whether the frequency improved as a result of the system getting better.
1214
00:46:18,320 --> 00:46:22,440
The result is that you actually understand what was preventing the work from moving.
1215
00:46:22,440 --> 00:46:27,160
You fix the specific problem and frequency improves because the real constraint is gone.
1216
00:46:27,160 --> 00:46:29,080
Not because people are cheating the system.
1217
00:46:29,080 --> 00:46:33,240
This distinction is critical right now because AI has created brand new bottlenecks.
1218
00:46:33,240 --> 00:46:37,040
If you optimize for old metrics, you will miss these new constraints and likely make them
1219
00:46:37,040 --> 00:46:38,040
worse.
1220
00:46:38,040 --> 00:46:40,600
Here is what diagnostic metrics actually look like.
1221
00:46:40,600 --> 00:46:44,080
Instead of saying deployment frequency should be five per day, you ask what is preventing
1222
00:46:44,080 --> 00:46:45,080
you from deploying.
1223
00:46:45,080 --> 00:46:48,760
You look at testing, reviews, or approval governance to understand the actual constraint.
1224
00:46:48,760 --> 00:46:52,760
Instead of saying lead time should be under one day, you measure where the work is waiting.
1225
00:46:52,760 --> 00:46:56,720
You find out at what stage it sits and for how long so you can see the flow.
1226
00:46:56,720 --> 00:46:59,720
Instead of saying the change failure rate should be under five percent, you look at what
1227
00:46:59,720 --> 00:47:01,280
types of changes are failing.
1228
00:47:01,280 --> 00:47:05,880
You check if it's AI generated code or specific domain so you can understand the pattern.
1229
00:47:05,880 --> 00:47:10,000
Instead of saying developer productivity should be high, you ask if the developers are healthy.
1230
00:47:10,000 --> 00:47:12,640
You look at whether they are learning and creating value.
1231
00:47:12,640 --> 00:47:14,240
You look at their reality.
1232
00:47:14,240 --> 00:47:15,400
Dagnostic metrics are open-ended.
1233
00:47:15,400 --> 00:47:16,520
They ask questions.
1234
00:47:16,520 --> 00:47:17,800
They don't declare answers.
1235
00:47:17,800 --> 00:47:19,360
This requires a different kind of leadership.
1236
00:47:19,360 --> 00:47:21,200
It isn't about hitting a target or else.
1237
00:47:21,200 --> 00:47:25,240
It's about saying let's understand what's happening and let's see if the system got better.
1238
00:47:25,240 --> 00:47:26,240
This is harder.
1239
00:47:26,240 --> 00:47:27,920
It demands thinking and patience.
1240
00:47:27,920 --> 00:47:31,960
It requires the discipline to keep asking why instead of declaring victory the moment
1241
00:47:31,960 --> 00:47:36,240
a number moves, but it is the only way to actually improve engineering systems.
1242
00:47:36,240 --> 00:47:40,320
Metric optimization creates the illusion of progress, but system improvement creates real
1243
00:47:40,320 --> 00:47:41,320
progress.
1244
00:47:41,320 --> 00:47:44,080
With AI accelerating change, you need real improvement.
1245
00:47:44,080 --> 00:47:46,080
You need to see what is actually happening.
1246
00:47:46,080 --> 00:47:48,360
Metric metrics are the only way to see it.
1247
00:47:48,360 --> 00:47:49,680
The diagnostic dashboard.
1248
00:47:49,680 --> 00:47:52,920
A diagnostic dashboard works fundamentally differently from the one you have installed right
1249
00:47:52,920 --> 00:47:53,920
now.
1250
00:47:53,920 --> 00:47:55,840
Your current dashboard is likely a performance dashboard.
1251
00:47:55,840 --> 00:47:57,160
It shows you the scoreboard.
1252
00:47:57,160 --> 00:48:01,160
It tells you how you are doing against targets and uses red, yellow and green lights to show
1253
00:48:01,160 --> 00:48:02,160
status.
1254
00:48:02,160 --> 00:48:05,840
It's simple and declarative and it encourages the exact behaviors that broke the system
1255
00:48:05,840 --> 00:48:07,000
in the first place.
1256
00:48:07,000 --> 00:48:10,000
A diagnostic dashboard asks where the system is breaking.
1257
00:48:10,000 --> 00:48:13,240
It looks for friction and tells you what you should actually focus on.
1258
00:48:13,240 --> 00:48:15,360
The difference is structural, not cosmetic.
1259
00:48:15,360 --> 00:48:20,280
Here is what a diagnostic dashboard for AI augmented engineering looks like.
1260
00:48:20,280 --> 00:48:23,400
The flow section sits at the top because flow is the foundation.
1261
00:48:23,400 --> 00:48:25,680
If the work isn't moving, nothing else matters.
1262
00:48:25,680 --> 00:48:27,560
You don't just look at lead time as one number.
1263
00:48:27,560 --> 00:48:28,880
You break it into three.
1264
00:48:28,880 --> 00:48:33,240
The time to the first review, the duration of the review, and the time from review to merge.
1265
00:48:33,240 --> 00:48:36,200
This decomposition shows you exactly where the time is accumulating.
1266
00:48:36,200 --> 00:48:40,200
You track flow efficiency, which is the percentage of time work is being touched versus sitting
1267
00:48:40,200 --> 00:48:41,200
idle.
1268
00:48:41,200 --> 00:48:44,200
If that number is below 50%, your system is congested.
1269
00:48:44,200 --> 00:48:46,240
You look at work in progress by stage.
1270
00:48:46,240 --> 00:48:49,000
Instead of a total wipe number, you see where the work lives.
1271
00:48:49,000 --> 00:48:51,800
Whether it's waiting for review, testing or approval.
1272
00:48:51,800 --> 00:48:54,320
That granularity shows you where the queue is longest.
1273
00:48:54,320 --> 00:48:57,840
You track queue age to see the oldest work item in each stage.
1274
00:48:57,840 --> 00:49:00,840
If a pull request has been waiting for a week, it becomes visible.
1275
00:49:00,840 --> 00:49:02,920
The system identifies the bottleneck for you.
1276
00:49:02,920 --> 00:49:05,720
It tells you which stage is the slowest based on data.
1277
00:49:05,720 --> 00:49:07,200
Not on a guess or an assumption.
1278
00:49:07,200 --> 00:49:09,360
The quality section measures durability.
1279
00:49:09,360 --> 00:49:11,080
The rework rate is your truth teller.
1280
00:49:11,080 --> 00:49:15,040
It shows you what percentage of code written recently is already being rewritten.
1281
00:49:15,040 --> 00:49:16,920
You segment the defect rate by author.
1282
00:49:16,920 --> 00:49:21,160
You look at AI generated code separately from human written code because you need to see
1283
00:49:21,160 --> 00:49:22,800
if there is a quality divergence.
1284
00:49:22,800 --> 00:49:25,160
You look at test coverage and mutation scores.
1285
00:49:25,160 --> 00:49:26,800
Coverage numbers on their own mean nothing.
1286
00:49:26,800 --> 00:49:30,240
Nutrition testing shows you if the tests actually catch bugs when you introduce them.
1287
00:49:30,240 --> 00:49:32,000
You measure code durability.
1288
00:49:32,000 --> 00:49:36,520
You check if the code survives 30 days or 90 days without a major rewrite, which is a key
1289
00:49:36,520 --> 00:49:37,760
indicator of flow.
1290
00:49:37,760 --> 00:49:40,160
You still track incident rates and recovery times.
1291
00:49:40,160 --> 00:49:44,320
These are trailing indicators, but they show you if your quality system is actually working.
1292
00:49:44,320 --> 00:49:46,880
The cognitive load section measures the human reality.
1293
00:49:46,880 --> 00:49:49,400
You use a quarterly survey to get the perceived load.
1294
00:49:49,400 --> 00:49:52,880
You ask one question about mental burden and track that trend over time.
1295
00:49:52,880 --> 00:49:56,560
You calculate context switching frequency from your work management systems.
1296
00:49:56,560 --> 00:50:00,760
You see how many different code bases or tools a developer has to touch every day.
1297
00:50:00,760 --> 00:50:02,880
You track focus time in 90 minute blocks.
1298
00:50:02,880 --> 00:50:04,240
Those blocks indicate flow.
1299
00:50:04,240 --> 00:50:06,560
While fragmentation below that is just friction.
1300
00:50:06,560 --> 00:50:09,680
You look at how the review burden is distributed across the team.
1301
00:50:09,680 --> 00:50:11,000
You don't look at the aggregate.
1302
00:50:11,000 --> 00:50:13,880
You see if your seniors are drowning while others do nothing.
1303
00:50:13,880 --> 00:50:15,960
You monitor after hours work patterns.
1304
00:50:15,960 --> 00:50:19,400
When code is being committed on nights and weekends, those are burnout signals.
1305
00:50:19,400 --> 00:50:22,640
The value section measures whether all this activity actually matters.
1306
00:50:22,640 --> 00:50:26,880
You track feature adoption to see what percentage of shipped features are used by customers.
1307
00:50:26,880 --> 00:50:30,960
You follow the customer satisfaction trend through NPS or whatever measure you prefer.
1308
00:50:30,960 --> 00:50:32,920
You look at the revenue impact by feature.
1309
00:50:32,920 --> 00:50:36,600
You need to know which items move the needle and which ones are essentially free code.
1310
00:50:36,600 --> 00:50:39,600
You look at the ratio of new feature development versus maintenance.
1311
00:50:39,600 --> 00:50:41,840
Time allocation determines your sustainability.
1312
00:50:41,840 --> 00:50:43,760
You track technical debt accumulation.
1313
00:50:43,760 --> 00:50:46,560
You need to know if it is growing or shrinking over time.
1314
00:50:46,560 --> 00:50:49,720
The AI specific section shows what is actually happening with the new tools.
1315
00:50:49,720 --> 00:50:53,840
You track the AI code share which is the percentage of code generated versus written.
1316
00:50:53,840 --> 00:50:55,200
You look for quality divergence.
1317
00:50:55,200 --> 00:50:58,440
You ask if AI generated changes are delivering better outcomes.
1318
00:50:58,440 --> 00:50:59,520
Or just more output.
1319
00:50:59,520 --> 00:51:01,840
You measure the review overhead for AI code.
1320
00:51:01,840 --> 00:51:04,520
You need to know if it takes longer to review than human code.
1321
00:51:04,520 --> 00:51:07,920
You check the durability of AI code to see if it survives.
1322
00:51:07,920 --> 00:51:10,600
As long as the code your developers write themselves.
1323
00:51:10,600 --> 00:51:14,920
You measure human in the loop effectiveness to see if the review process is actually catching
1324
00:51:14,920 --> 00:51:16,680
the problems AI creates.
1325
00:51:16,680 --> 00:51:18,960
Each of these sections has a narrative, not a target.
1326
00:51:18,960 --> 00:51:20,120
It tells a story.
1327
00:51:20,120 --> 00:51:23,680
The flow section might tell you that lead time is increasing because the bottleneck in review
1328
00:51:23,680 --> 00:51:25,400
time is up 400%.
1329
00:51:25,400 --> 00:51:29,120
It shows the QAG is five days and reviewers report a high cognitive load.
1330
00:51:29,120 --> 00:51:31,280
This tells you exactly where to intervene.
1331
00:51:31,280 --> 00:51:36,120
You can decide to increase capacity, reduce the burden, or clarify what needs a deep review.
1332
00:51:36,120 --> 00:51:37,280
That is diagnostic.
1333
00:51:37,280 --> 00:51:40,360
It points to the problem and suggests where to investigate.
1334
00:51:40,360 --> 00:51:41,880
Compare that to a performance dashboard.
1335
00:51:41,880 --> 00:51:44,760
It would just say lead time is two days while the target is one.
1336
00:51:44,760 --> 00:51:48,800
It says you are missing the target and tells you to push the teams to ship faster.
1337
00:51:48,800 --> 00:51:49,800
That is toxic.
1338
00:51:49,800 --> 00:51:52,200
It optimizes the metric and misses the real constraint.
1339
00:51:52,200 --> 00:51:54,760
The principle underneath all of this is simple.
1340
00:51:54,760 --> 00:51:58,520
Every metric should have a question attached to it, not a target.
1341
00:51:58,520 --> 00:52:00,760
You don't say review time should be under four hours.
1342
00:52:00,760 --> 00:52:02,680
You ask why review time is increasing.
1343
00:52:02,680 --> 00:52:05,320
You don't say the rework rate should be under three percent.
1344
00:52:05,320 --> 00:52:06,800
You ask what is causing the rework.
1345
00:52:06,800 --> 00:52:09,520
You don't say developer satisfaction should be a seven out of ten.
1346
00:52:09,520 --> 00:52:11,480
You ask if the developers are healthy.
1347
00:52:11,480 --> 00:52:14,720
Questions drive investigation, but targets only drive optimization.
1348
00:52:14,720 --> 00:52:16,600
You need investigation.
1349
00:52:16,600 --> 00:52:18,160
Governance without toxicity.
1350
00:52:18,160 --> 00:52:20,360
Most organizations get the hard part wrong.
1351
00:52:20,360 --> 00:52:23,040
They try to use metrics for system improvement.
1352
00:52:23,040 --> 00:52:25,400
But they turn them into performance weapons instead.
1353
00:52:25,400 --> 00:52:27,640
That destroys the culture you are trying to build.
1354
00:52:27,640 --> 00:52:29,760
To fix this, your governance has to be explicit.
1355
00:52:29,760 --> 00:52:31,560
You need clear rules and transparent processes.
1356
00:52:31,560 --> 00:52:34,880
It sounds like more bureaucracy, but in reality, it is liberating.
1357
00:52:34,880 --> 00:52:38,280
Because when the structure is clear, everyone knows what the metrics actually mean.
1358
00:52:38,280 --> 00:52:40,080
And more importantly, what they don't mean.
1359
00:52:40,080 --> 00:52:43,080
Rule one, metrics are never used for individual performance.
1360
00:52:43,080 --> 00:52:45,360
This is non-negotiable.
1361
00:52:45,360 --> 00:52:46,720
Metrics measure the system.
1362
00:52:46,720 --> 00:52:48,880
They measure how work flows through the organization.
1363
00:52:48,880 --> 00:52:50,560
But they don't measure people.
1364
00:52:50,560 --> 00:52:55,440
The moment you attach a metric to a performance review, you've converted it from a diagnostic tool
1365
00:52:55,440 --> 00:52:56,600
into a stick.
1366
00:52:56,600 --> 00:52:59,160
And people will optimize for the stick instead of the system.
1367
00:52:59,160 --> 00:53:00,640
So don't do it.
1368
00:53:00,640 --> 00:53:05,200
Make it explicit in your governance that metrics are off limits for individual evaluation.
1369
00:53:05,200 --> 00:53:07,360
Full stop.
1370
00:53:07,360 --> 00:53:11,560
Rule two, metrics are for understanding systems, not for declaring success.
1371
00:53:11,560 --> 00:53:13,560
A metric improving doesn't mean you succeeded.
1372
00:53:13,560 --> 00:53:15,080
It just means something changed.
1373
00:53:15,080 --> 00:53:18,120
You need to understand what that change was and why it happened.
1374
00:53:18,120 --> 00:53:21,240
Maybe the system got better or maybe you just changed how you measure.
1375
00:53:21,240 --> 00:53:24,440
Maybe people game the number or maybe external factors shifted.
1376
00:53:24,440 --> 00:53:26,560
You don't know until you investigate.
1377
00:53:26,560 --> 00:53:29,920
When a metric moves, the first response shouldn't be celebration.
1378
00:53:29,920 --> 00:53:31,200
It should be investigation.
1379
00:53:31,200 --> 00:53:34,320
Instead of saying, great, we hit our target, try saying interesting.
1380
00:53:34,320 --> 00:53:36,240
Let's figure out if this is real.
1381
00:53:36,240 --> 00:53:40,280
Rule three, metrics are reviewed by teams, not by executives in conference rooms.
1382
00:53:40,280 --> 00:53:43,200
The people doing the work should be the ones interpreting the data.
1383
00:53:43,200 --> 00:53:47,280
Engineers understand the technical constraints and managers understand the people.
1384
00:53:47,280 --> 00:53:51,520
Product teams see the customer impact while operations sees how the system behaves.
1385
00:53:51,520 --> 00:53:54,600
When you bring those perspectives together, you see reality.
1386
00:53:54,600 --> 00:53:57,960
But when executives interpret metrics alone, they see what they want to see.
1387
00:53:57,960 --> 00:54:00,320
You have to include the people living in the system.
1388
00:54:00,320 --> 00:54:03,520
Rule four, metrics drive investigation, not immediate action.
1389
00:54:03,520 --> 00:54:05,480
When a number moves, the instinct is to act.
1390
00:54:05,480 --> 00:54:07,840
You see lead time go up and you want to fix it immediately.
1391
00:54:07,840 --> 00:54:08,840
But what are you actually fixing?
1392
00:54:08,840 --> 00:54:10,240
That's a question, not an action.
1393
00:54:10,240 --> 00:54:12,720
The first response to a change is always why.
1394
00:54:12,720 --> 00:54:13,800
What was the root cause?
1395
00:54:13,800 --> 00:54:16,320
Is the metric even measuring what we think it is?
1396
00:54:16,320 --> 00:54:18,720
Only after you investigate, do you move to action?
1397
00:54:18,720 --> 00:54:22,960
And that action should be a hypothesis, a test, an experiment.
1398
00:54:22,960 --> 00:54:26,240
Rule five, interventions are tested and measured.
1399
00:54:26,240 --> 00:54:29,400
When you change something to improve a metric, you have to measure if it actually worked.
1400
00:54:29,400 --> 00:54:31,640
You don't just change things and hope for the best.
1401
00:54:31,640 --> 00:54:32,840
You watch the numbers.
1402
00:54:32,840 --> 00:54:35,120
You ask if the intervention did what you expected?
1403
00:54:35,120 --> 00:54:36,440
Did it improve the target?
1404
00:54:36,440 --> 00:54:37,680
Did it create new problems?
1405
00:54:37,680 --> 00:54:39,280
Did it affect things you didn't expect?
1406
00:54:39,280 --> 00:54:41,200
This is experimentation, not a decree.
1407
00:54:41,200 --> 00:54:45,480
You stay in learning mode and that requires measuring before, during and after the change.
1408
00:54:45,480 --> 00:54:48,760
Rule six, metrics are retired when they're no longer useful.
1409
00:54:48,760 --> 00:54:52,080
A metric that made sense six months ago might be useless now.
1410
00:54:52,080 --> 00:54:54,320
Your system change and your constraints shifted.
1411
00:54:54,320 --> 00:54:55,800
New problems emerged.
1412
00:54:55,800 --> 00:54:59,400
You have to regularly ask, is this still telling us something useful?
1413
00:54:59,400 --> 00:55:00,920
If the answer is no, retire it.
1414
00:55:00,920 --> 00:55:03,520
Stop measuring it and replace it with something relevant.
1415
00:55:03,520 --> 00:55:09,080
This prevents metric drift where you keep measuring old things even though the system has evolved.
1416
00:55:09,080 --> 00:55:11,480
This model treats metrics as tools for learning.
1417
00:55:11,480 --> 00:55:14,120
Not as weapons for control, they aren't scorecards.
1418
00:55:14,120 --> 00:55:18,560
They are lenses into how the system actually works and it requires a different kind of leadership.
1419
00:55:18,560 --> 00:55:21,560
It needs leaders who are curious instead of declarative.
1420
00:55:21,560 --> 00:55:23,920
Leaders who ask why instead of demanding answers.
1421
00:55:23,920 --> 00:55:28,160
It requires a shift towards supporting investigation instead of just demanding speed.
1422
00:55:28,160 --> 00:55:30,440
This is harder than traditional command and control.
1423
00:55:30,440 --> 00:55:31,600
It takes patience.
1424
00:55:31,600 --> 00:55:35,180
It requires trusting that understanding the system leads to better outcomes than just
1425
00:55:35,180 --> 00:55:36,180
pushing for targets.
1426
00:55:36,180 --> 00:55:39,600
You have to resist the urge to declare victory every time a number goes up.
1427
00:55:39,600 --> 00:55:42,520
But this is how you actually improve systems and that's the whole point.
1428
00:55:42,520 --> 00:55:44,360
The organizational shift.
1429
00:55:44,360 --> 00:55:47,120
Diagnostic metrics require something bigger than a new dashboard.
1430
00:55:47,120 --> 00:55:49,520
They require an organizational transformation.
1431
00:55:49,520 --> 00:55:52,400
Not a change in technology or tools, but a change in structure.
1432
00:55:52,400 --> 00:55:56,480
How decisions get made, where authority lives, what the company actually values.
1433
00:55:56,480 --> 00:55:58,520
This isn't comfortable.
1434
00:55:58,520 --> 00:56:00,600
Most organizations are built for accountability.
1435
00:56:00,600 --> 00:56:03,480
Someone owns the metric and someone is responsible if it doesn't hit.
1436
00:56:03,480 --> 00:56:06,920
That clarity feels good to leadership, but it also drives all the bad behavior we've been
1437
00:56:06,920 --> 00:56:07,920
talking about.
1438
00:56:07,920 --> 00:56:09,440
The shift has to run deeper.
1439
00:56:09,440 --> 00:56:10,440
First shift.
1440
00:56:10,440 --> 00:56:11,440
From accountability to learning.
1441
00:56:11,440 --> 00:56:15,320
Stop asking who's responsible for this metric and start asking what does this tell us
1442
00:56:15,320 --> 00:56:17,120
about the system.
1443
00:56:17,120 --> 00:56:21,200
These sound similar, but in reality, they are opposites.
1444
00:56:21,200 --> 00:56:23,360
It looks backward to assign blame.
1445
00:56:23,360 --> 00:56:24,960
Learning looks forward to ask why.
1446
00:56:24,960 --> 00:56:27,720
In accountability mode, a bad metric means someone failed.
1447
00:56:27,720 --> 00:56:31,360
In learning mode, a bad metric means the system has something to teach you.
1448
00:56:31,360 --> 00:56:32,560
The person didn't fail.
1449
00:56:32,560 --> 00:56:35,040
The system just showed you where it needs attention.
1450
00:56:35,040 --> 00:56:37,960
That's a radical difference and it only works if you make it explicit.
1451
00:56:37,960 --> 00:56:41,640
If you say metrics are for learning, but then use them to judge people.
1452
00:56:41,640 --> 00:56:42,640
You've lied.
1453
00:56:42,640 --> 00:56:44,920
People will just hide problems instead of exposing them.
1454
00:56:44,920 --> 00:56:48,040
This shift has to be real and protected by your governance.
1455
00:56:48,040 --> 00:56:50,040
I can shift from targets to thresholds.
1456
00:56:50,040 --> 00:56:53,280
Stop setting targets like we need to deploy five times a day.
1457
00:56:53,280 --> 00:56:58,800
Start setting thresholds like if flow efficiency drops below 50%, we investigate why.
1458
00:56:58,800 --> 00:57:02,200
Targets create optimization where people just aim for the number.
1459
00:57:02,200 --> 00:57:03,600
Thresholds create guardrails.
1460
00:57:03,600 --> 00:57:05,280
The difference is behavioral.
1461
00:57:05,280 --> 00:57:07,840
With a target, you're saying get to this number.
1462
00:57:07,840 --> 00:57:12,320
With a threshold, you're saying if the system health drops to this level, something is wrong.
1463
00:57:12,320 --> 00:57:16,640
Thresholds are about protecting health, not declaring success.
1464
00:57:16,640 --> 00:57:19,800
Start shifting from individual metrics to system metrics.
1465
00:57:19,800 --> 00:57:23,080
Stop measuring individual productivity and start measuring system health.
1466
00:57:23,080 --> 00:57:25,920
This seems obvious now, but it's structurally radical.
1467
00:57:25,920 --> 00:57:28,040
Most performance systems are built to measure people.
1468
00:57:28,040 --> 00:57:29,360
What did person A do?
1469
00:57:29,360 --> 00:57:31,120
How much did person B contribute?
1470
00:57:31,120 --> 00:57:34,520
Those measurements decide who gets hired, promoted or paid more.
1471
00:57:34,520 --> 00:57:36,840
When you switch to system metrics, those levers disappear.
1472
00:57:36,840 --> 00:57:40,760
You can't use a system level flow metric to decide if one person deserves a raise.
1473
00:57:40,760 --> 00:57:44,200
This shift threatens the entire performance management infrastructure.
1474
00:57:44,200 --> 00:57:48,080
It threatens the ability to make individual distinctions and most organizations aren't
1475
00:57:48,080 --> 00:57:49,080
ready for that.
1476
00:57:49,080 --> 00:57:53,280
They resist it or they say they're doing it while they still secretly measure individuals,
1477
00:57:53,280 --> 00:57:54,720
but half measures don't work.
1478
00:57:54,720 --> 00:57:57,040
Either metrics are system level or they aren't.
1479
00:57:57,040 --> 00:57:58,040
Fourth shift.
1480
00:57:58,040 --> 00:58:02,160
From lagging to leading indicators, stop waiting for an incident to know something is wrong.
1481
00:58:02,160 --> 00:58:05,640
Start measuring leading indicators like cognitive load and flow efficiency.
1482
00:58:05,640 --> 00:58:08,720
Leading indicators give you time to act before the system breaks.
1483
00:58:08,720 --> 00:58:11,480
Lagging indicators just tell you the system already failed.
1484
00:58:11,480 --> 00:58:14,000
If you're measuring a trition, you're already losing people.
1485
00:58:14,000 --> 00:58:17,840
But if you're measuring cognitive load, you can intervene before they ever decide to leave.
1486
00:58:17,840 --> 00:58:19,320
This shift requires patience.
1487
00:58:19,320 --> 00:58:22,920
It requires believing that system health predicts future outcomes.
1488
00:58:22,920 --> 00:58:26,160
Most organizations want to see the outcome before they believe the data.
1489
00:58:26,160 --> 00:58:27,160
They want proof.
1490
00:58:27,160 --> 00:58:29,400
But leading indicators happen before the proof exists.
1491
00:58:29,400 --> 00:58:30,600
You have to act on signals.
1492
00:58:30,600 --> 00:58:33,960
You have to trust the system thinking and be willing to improve things that don't look
1493
00:58:33,960 --> 00:58:34,960
broken yet.
1494
00:58:34,960 --> 00:58:36,000
Fifth shift.
1495
00:58:36,000 --> 00:58:38,320
From dashboards to diagnostic consoles.
1496
00:58:38,320 --> 00:58:42,000
Reports status but a diagnostic console guides an investigation.
1497
00:58:42,000 --> 00:58:44,680
That's a tool difference but it reflects a thinking difference.
1498
00:58:44,680 --> 00:58:47,280
Dashboards answer, how are we doing?
1499
00:58:47,280 --> 00:58:50,080
While consoles ask, what should we pay attention to?
1500
00:58:50,080 --> 00:58:52,160
One is static, the other is active.
1501
00:58:52,160 --> 00:58:55,080
One measures the past, the other guides the future.
1502
00:58:55,080 --> 00:58:56,080
Sixth shift.
1503
00:58:56,080 --> 00:59:00,200
From executives deciding to teams investigating, stop having leadership interpret metrics from
1504
00:59:00,200 --> 00:59:01,520
conference rooms.
1505
00:59:01,520 --> 00:59:05,080
Start having the teams doing the work interpret the metrics within those systems.
1506
00:59:05,080 --> 00:59:06,600
This is how you distribute authority.
1507
00:59:06,600 --> 00:59:09,280
It's how you value expertise and build in skepticism.
1508
00:59:09,280 --> 00:59:13,440
Teams know what's real, they know what's just a measurement artifact or external noise.
1509
00:59:13,440 --> 00:59:14,600
Executives see data points.
1510
00:59:14,600 --> 00:59:17,320
But team see systems, you need both perspectives in the room.
1511
00:59:17,320 --> 00:59:21,120
But if executives are the only ones deciding what the metrics mean, you're missing the reality
1512
00:59:21,120 --> 00:59:22,120
on the ground.
1513
00:59:22,120 --> 00:59:23,720
Each of these shifts is structural.
1514
00:59:23,720 --> 00:59:28,360
Each one requires support in your policies, your processes, and how you evaluate people.
1515
00:59:28,360 --> 00:59:31,760
It changes how time is allocated and how the organization breathes.
1516
00:59:31,760 --> 00:59:33,600
What leading organizations are measuring?
1517
00:59:33,600 --> 00:59:37,600
The organizations actually winning with AI augmented engineering aren't measuring differently
1518
00:59:37,600 --> 00:59:38,600
by accident.
1519
00:59:38,600 --> 00:59:40,960
They made a conscious choice about what matters.
1520
00:59:40,960 --> 00:59:43,840
And once you see what they're tracking, the difference becomes obvious.
1521
00:59:43,840 --> 00:59:47,200
They're not optimizing for deployment frequency or lead time anymore.
1522
00:59:47,200 --> 00:59:48,400
Those metrics are there.
1523
00:59:48,400 --> 00:59:51,480
But they aren't the lens through which the whole system is evaluated.
1524
00:59:51,480 --> 00:59:54,320
Instead, they're measuring across six distinct dimensions.
1525
00:59:54,320 --> 00:59:56,080
Flow health sits at the foundation.
1526
00:59:56,080 --> 00:59:57,800
This isn't just one aggregate number.
1527
00:59:57,800 --> 01:00:02,600
It's lead time decomposed into its actual stages so you can see where time actually lives.
1528
01:00:02,600 --> 01:00:06,800
They look at flow efficiency to see what percentage of time work is actively being touched
1529
01:00:06,800 --> 01:00:08,160
versus sitting in a queue.
1530
01:00:08,160 --> 01:00:10,480
They measure work in progress by stage.
1531
01:00:10,480 --> 01:00:13,760
Not just the total, that breakdown shows exactly where the congestion lives.
1532
01:00:13,760 --> 01:00:17,080
They use queue age to identify the oldest waiting item at each step.
1533
01:00:17,080 --> 01:00:20,600
It's a bottleneck identification system that points directly at the constraint, rather
1534
01:00:20,600 --> 01:00:22,440
than requiring executives to guess.
1535
01:00:22,440 --> 01:00:25,840
Because if work isn't flowing smoothly through the system, nothing else matters.
1536
01:00:25,840 --> 01:00:28,680
You can have perfect quality on code that never ships.
1537
01:00:28,680 --> 01:00:31,280
You can have massive value in features waiting for approval.
1538
01:00:31,280 --> 01:00:32,640
Flow is the container.
1539
01:00:32,640 --> 01:00:34,280
Everything else sits inside.
1540
01:00:34,280 --> 01:00:36,680
Quality health measures durability and real correctness.
1541
01:00:36,680 --> 01:00:39,440
They look at rework rates broken down by author type.
1542
01:00:39,440 --> 01:00:43,320
Is AI generated code being rewritten more frequently than human code?
1543
01:00:43,320 --> 01:00:44,320
If the answer is yes.
1544
01:00:44,320 --> 01:00:47,720
That's a signal about verification quality or whether you're using the tool for the right
1545
01:00:47,720 --> 01:00:48,720
things.
1546
01:00:48,720 --> 01:00:53,160
They pair test coverage with mutation scores because a 90% coverage number means nothing
1547
01:00:53,160 --> 01:00:55,800
if the tests don't actually catch defects.
1548
01:00:55,800 --> 01:00:59,800
They track code durability over 30 and 90 days to see if the code survives.
1549
01:00:59,800 --> 01:01:03,440
If it's constantly being rewritten, they watch incident patterns to see if quality gates
1550
01:01:03,440 --> 01:01:05,640
are actually working or if defects are escaping.
1551
01:01:05,640 --> 01:01:08,840
These organizations don't trust coverage reports or test counts.
1552
01:01:08,840 --> 01:01:11,080
They measure whether tests actually catch bugs.
1553
01:01:11,080 --> 01:01:14,160
And they separate AI generated tests from human written tests.
1554
01:01:14,160 --> 01:01:16,040
Because they've learned they often behave differently.
1555
01:01:16,040 --> 01:01:20,720
Cognitive load health is the dimension, traditional organizations, almost completely ignore.
1556
01:01:20,720 --> 01:01:22,360
Yet, that's where the system fails.
1557
01:01:22,360 --> 01:01:26,040
They use quarterly surveys to ask developers directly about their mental burden.
1558
01:01:26,040 --> 01:01:27,040
One simple question.
1559
01:01:27,040 --> 01:01:28,040
Rate it.
1560
01:01:28,040 --> 01:01:29,040
Track the trend.
1561
01:01:29,040 --> 01:01:33,040
We calculate context switching frequency from work management systems to see how fragmented
1562
01:01:33,040 --> 01:01:34,480
each developer's day is.
1563
01:01:34,480 --> 01:01:37,160
They measure focus time as uninterrupted blocks.
1564
01:01:37,160 --> 01:01:38,840
90 minute chunks indicate flow.
1565
01:01:38,840 --> 01:01:40,960
While fragmented work indicates friction.
1566
01:01:40,960 --> 01:01:44,800
They distribute the review burden across the team rather than aggregating it.
1567
01:01:44,800 --> 01:01:48,960
If three people are doing all the reviews while 20 aren't, you have a concentration problem.
1568
01:01:48,960 --> 01:01:52,960
They watch after hours work patterns to see when code is actually being committed.
1569
01:01:52,960 --> 01:01:54,960
Nights and weekends are burnout signals.
1570
01:01:54,960 --> 01:01:57,880
They're measuring human health because they understand that burned out people build worse
1571
01:01:57,880 --> 01:01:58,880
systems.
1572
01:01:58,880 --> 01:02:01,960
Value health measures, whether activity creates actual outcomes.
1573
01:02:01,960 --> 01:02:05,920
They track feature adoption rates, not shipped features, used features.
1574
01:02:05,920 --> 01:02:10,280
They track customer satisfaction over time and revenue impact by feature so they can see
1575
01:02:10,280 --> 01:02:13,120
which shipped items actually move the needle.
1576
01:02:13,120 --> 01:02:16,800
They look at time allocation to see if the team is building new capabilities or mostly
1577
01:02:16,800 --> 01:02:18,360
maintaining existing code.
1578
01:02:18,360 --> 01:02:22,400
They watch the technical debt accumulation trend to see if it's growing or shrinking.
1579
01:02:22,400 --> 01:02:24,960
That determines how long the system stays healthy.
1580
01:02:24,960 --> 01:02:30,280
They measure value because activity without value is just waste disguised as productivity.
1581
01:02:30,280 --> 01:02:33,360
AI specific health tracks what's actually happening with the tool.
1582
01:02:33,360 --> 01:02:37,360
They look at AI code share to see the percentage of generated versus written code.
1583
01:02:37,360 --> 01:02:41,640
They ask about quality divergence to see if AI generated changes deliver better outcomes.
1584
01:02:41,640 --> 01:02:45,560
They compare review overhead and durability for AI code versus human code.
1585
01:02:45,560 --> 01:02:49,000
They look at human in the loop effectiveness to see if the review process is actually catching
1586
01:02:49,000 --> 01:02:51,200
problems or just creating a ritual.
1587
01:02:51,200 --> 01:02:56,240
They measure AI specifically because general metrics hide whether the tool is helping or creating
1588
01:02:56,240 --> 01:02:57,760
overhead.
1589
01:02:57,760 --> 01:03:00,160
Organizational health measures the system that holds everything else.
1590
01:03:00,160 --> 01:03:02,200
They track attrition and hiring trends.
1591
01:03:02,200 --> 01:03:04,280
Skill development across the team.
1592
01:03:04,280 --> 01:03:06,440
Psychological safety from regular pulse checks.
1593
01:03:06,440 --> 01:03:09,640
They focus on alignment and clarity so people understand where they fit.
1594
01:03:09,640 --> 01:03:14,360
They measure learning velocity to see if the organization itself is improving at a sustainable
1595
01:03:14,360 --> 01:03:15,360
pace.
1596
01:03:15,360 --> 01:03:16,560
The organization itself is the system.
1597
01:03:16,560 --> 01:03:17,600
Everything else depends on it.
1598
01:03:17,600 --> 01:03:19,640
These organizations aren't trying to hit targets.
1599
01:03:19,640 --> 01:03:22,880
They're trying to understand systems, understand constraints, understand where the friction
1600
01:03:22,880 --> 01:03:24,760
lives, then they improve incrementally.
1601
01:03:24,760 --> 01:03:26,120
That's why they're winning.
1602
01:03:26,120 --> 01:03:29,880
Not because they ship more, but because they ship better, they create value, they retain
1603
01:03:29,880 --> 01:03:32,520
people, they build systems that sustain growth.
1604
01:03:32,520 --> 01:03:36,560
They're not chasing the productivity illusion, they're building real productivity, the philosophy
1605
01:03:36,560 --> 01:03:37,560
of measurement.
1606
01:03:37,560 --> 01:03:41,000
Underneath everything we've talked about lives a single idea that changes how you think
1607
01:03:41,000 --> 01:03:42,000
about numbers.
1608
01:03:42,000 --> 01:03:45,320
It's simple and it's almost universally violated.
1609
01:03:45,320 --> 01:03:46,320
Metrics are not truth.
1610
01:03:46,320 --> 01:03:47,480
They're windows into truth.
1611
01:03:47,480 --> 01:03:50,720
When you look through a window you see one angle, one perspective.
1612
01:03:50,720 --> 01:03:54,560
If you stand on the north side of a building, the window shows you the north face.
1613
01:03:54,560 --> 01:03:55,560
Move to the east side.
1614
01:03:55,560 --> 01:03:57,760
The window shows you something completely different.
1615
01:03:57,760 --> 01:04:01,120
Neither view is the complete building, but both are real and you need both to understand
1616
01:04:01,120 --> 01:04:02,480
what you're looking at.
1617
01:04:02,480 --> 01:04:04,040
Metrics work the same way.
1618
01:04:04,040 --> 01:04:06,560
Deployment frequency is a window into one aspect of your system.
1619
01:04:06,560 --> 01:04:09,880
It shows you how often you're putting code into production.
1620
01:04:09,880 --> 01:04:13,360
That's real data, but it doesn't show you whether that code is stable, whether it creates
1621
01:04:13,360 --> 01:04:16,920
value, whether people understand it, whether the review process is sound.
1622
01:04:16,920 --> 01:04:19,280
That's one angle, not the picture.
1623
01:04:19,280 --> 01:04:22,520
The moment you start treating a single metric as the truth, you've stopped seeing the
1624
01:04:22,520 --> 01:04:23,520
building.
1625
01:04:23,520 --> 01:04:26,600
You're just staring at the north wall and if the north wall looks good, you assume the
1626
01:04:26,600 --> 01:04:28,280
entire building is fine.
1627
01:04:28,280 --> 01:04:29,280
Sometimes it is.
1628
01:04:29,280 --> 01:04:30,280
Often it isn't.
1629
01:04:30,280 --> 01:04:34,120
That's why organizations with high activity metrics integrating systems are so confused.
1630
01:04:34,120 --> 01:04:37,520
The metric is telling them one story, but reality is telling them another.
1631
01:04:37,520 --> 01:04:41,120
They can't reconcile it because they're treating the metric like a complete view instead
1632
01:04:41,120 --> 01:04:42,120
of a partial one.
1633
01:04:42,120 --> 01:04:44,480
A metric without context is genuinely misleading.
1634
01:04:44,480 --> 01:04:46,440
It's worse than having no metric at all.
1635
01:04:46,440 --> 01:04:48,440
Because it creates the illusion of understanding.
1636
01:04:48,440 --> 01:04:52,200
A lead time of three days seems good until you learn that 70% of that time is spent waiting
1637
01:04:52,200 --> 01:04:53,200
for a review.
1638
01:04:53,200 --> 01:04:54,200
Then it's not good.
1639
01:04:54,200 --> 01:04:55,560
The metric didn't change.
1640
01:04:55,560 --> 01:04:57,240
But the context changed everything.
1641
01:04:57,240 --> 01:05:01,200
A deployment frequency of five times per day seems impressive until you realize half of
1642
01:05:01,200 --> 01:05:02,520
those are rollbacks.
1643
01:05:02,520 --> 01:05:03,680
Then it's a warning sign.
1644
01:05:03,680 --> 01:05:06,160
The number didn't move, but the meaning flipped.
1645
01:05:06,160 --> 01:05:09,640
This is why leading organizations never read a single metric in isolation.
1646
01:05:09,640 --> 01:05:11,520
They read metrics with context attached.
1647
01:05:11,520 --> 01:05:13,360
They're asking, compared to what?
1648
01:05:13,360 --> 01:05:14,360
Compared to last month?
1649
01:05:14,360 --> 01:05:15,680
Compared to benchmarks?
1650
01:05:15,680 --> 01:05:17,360
Compared to our other metrics?
1651
01:05:17,360 --> 01:05:18,880
Context turns a number into insight.
1652
01:05:18,880 --> 01:05:21,440
And here's the part that matters for your organization.
1653
01:05:21,440 --> 01:05:22,960
Metrics drive behavior.
1654
01:05:22,960 --> 01:05:24,760
Whatever you measure, people will optimize for.
1655
01:05:24,760 --> 01:05:25,760
This isn't cynicism.
1656
01:05:25,760 --> 01:05:27,280
It's how incentives work.
1657
01:05:27,280 --> 01:05:28,720
You make something visible.
1658
01:05:28,720 --> 01:05:30,120
You pointed it as important.
1659
01:05:30,120 --> 01:05:31,400
People start trying to improve it.
1660
01:05:31,400 --> 01:05:32,400
That's natural.
1661
01:05:32,400 --> 01:05:34,760
It's also dangerous if the metric is incomplete.
1662
01:05:34,760 --> 01:05:38,600
If you optimize for deployment frequency without measuring stability, you get fast but
1663
01:05:38,600 --> 01:05:39,800
fragile systems.
1664
01:05:39,800 --> 01:05:44,120
If you optimize for lead time without measuring rework, you get speed but quality drops.
1665
01:05:44,120 --> 01:05:48,200
If you optimize for activity without measuring value, you ship more but create waste.
1666
01:05:48,200 --> 01:05:53,120
Choose metrics carefully because they will shape behavior and shape behavior creates culture.
1667
01:05:53,120 --> 01:05:56,120
And culture determines whether your system thrives or eventually collapses.
1668
01:05:56,120 --> 01:05:57,880
This is why toxic KPIs exist.
1669
01:05:57,880 --> 01:05:58,880
They're not malicious.
1670
01:05:58,880 --> 01:06:02,040
They're just incomplete metrics being treated as complete truths.
1671
01:06:02,040 --> 01:06:03,680
And people are optimizing for them.
1672
01:06:03,680 --> 01:06:05,880
Metrics are tools for learning about systems.
1673
01:06:05,880 --> 01:06:07,240
Not weapons for controlling people.
1674
01:06:07,240 --> 01:06:10,560
The moment you treat them as weapons, they stop being useful for learning.
1675
01:06:10,560 --> 01:06:11,560
People hide problems.
1676
01:06:11,560 --> 01:06:12,560
They game numbers.
1677
01:06:12,560 --> 01:06:14,560
Stop being honest about what's actually happening.
1678
01:06:14,560 --> 01:06:16,400
A metric that helps you learn is different.
1679
01:06:16,400 --> 01:06:18,720
It's a question, not a judgment.
1680
01:06:18,720 --> 01:06:20,680
Why is this metric moving this way?
1681
01:06:20,680 --> 01:06:22,160
What does it reveal about the system?
1682
01:06:22,160 --> 01:06:23,880
Where should we look next?
1683
01:06:23,880 --> 01:06:25,280
Measurement without action is waste.
1684
01:06:25,280 --> 01:06:27,160
Collecting data you never use is waste.
1685
01:06:27,160 --> 01:06:29,680
Measuring things you aren't going to change is waste.
1686
01:06:29,680 --> 01:06:32,080
Every metric should drive investigation.
1687
01:06:32,080 --> 01:06:33,880
Every investigation should drive action.
1688
01:06:33,880 --> 01:06:37,040
And every action should be measured to see if it actually worked.
1689
01:06:37,040 --> 01:06:38,920
That's the philosophy underneath everything.
1690
01:06:38,920 --> 01:06:44,320
Access Windows, context as the essential frame, behavior as the outcome, learning as the goal,
1691
01:06:44,320 --> 01:06:47,760
and action as the only proof that you actually understood anything.
1692
01:06:47,760 --> 01:06:51,640
If you want to move from activity metrics to diagnostic metrics, you need a road map,
1693
01:06:51,640 --> 01:06:53,520
not just a vision or a set of principles.
1694
01:06:53,520 --> 01:06:57,280
You need a concrete path with phases and time frames because without that structure, this
1695
01:06:57,280 --> 01:06:58,920
stays abstract and theoretical.
1696
01:06:58,920 --> 01:07:00,080
It never actually happens.
1697
01:07:00,080 --> 01:07:02,760
This isn't a one-time change where you just flip a switch.
1698
01:07:02,760 --> 01:07:06,200
You're transforming how an entire organization sees itself and that takes time.
1699
01:07:06,200 --> 01:07:07,760
But it does have a specific sequence.
1700
01:07:07,760 --> 01:07:10,120
If you follow that sequence, it works.
1701
01:07:10,120 --> 01:07:13,480
Phase one, establish baselines, weeks one to four.
1702
01:07:13,480 --> 01:07:16,920
Start by measuring what you're already measuring and don't change a single thing yet.
1703
01:07:16,920 --> 01:07:18,280
Just document the baseline.
1704
01:07:18,280 --> 01:07:22,480
This matters because you need a reference point to know what before looks like.
1705
01:07:22,480 --> 01:07:25,360
Otherwise you won't actually see when things start to shift.
1706
01:07:25,360 --> 01:07:29,080
Pull your current metrics like deployment frequency, lead time, change failure rate,
1707
01:07:29,080 --> 01:07:30,240
and MTTR.
1708
01:07:30,240 --> 01:07:33,400
If you're already measuring developer satisfaction, grab that too.
1709
01:07:33,400 --> 01:07:34,400
Write it all down.
1710
01:07:34,400 --> 01:07:35,640
This is your starting line.
1711
01:07:35,640 --> 01:07:37,640
Then you need to measure what you're currently ignoring.
1712
01:07:37,640 --> 01:07:41,720
Look at your rework rate to see how much code written in the last two weeks is being rewritten
1713
01:07:41,720 --> 01:07:42,720
or deleted.
1714
01:07:42,720 --> 01:07:46,720
Check your flow efficiency to find out what percentage of time work is actually moving versus
1715
01:07:46,720 --> 01:07:47,880
sitting idle.
1716
01:07:47,880 --> 01:07:51,880
Decompose your review cycle time so you can see the actual time to first review and the
1717
01:07:51,880 --> 01:07:53,640
duration of the review itself.
1718
01:07:53,640 --> 01:07:58,040
You also need cognitive load indicators like context switching frequency and feature adoption
1719
01:07:58,040 --> 01:07:59,920
rates from your product analytics.
1720
01:07:59,920 --> 01:08:01,360
You don't need perfection here.
1721
01:08:01,360 --> 01:08:02,960
You just need directional accuracy.
1722
01:08:02,960 --> 01:08:06,640
You need to know what the system looks like right now with all of its problems visible.
1723
01:08:06,640 --> 01:08:09,760
Know that as your baseline because you'll be comparing everything to this later.
1724
01:08:09,760 --> 01:08:13,120
Phase two, diagnostic review, weeks 5 to 8.
1725
01:08:13,120 --> 01:08:15,960
Stop having status meetings and start having diagnostic sessions.
1726
01:08:15,960 --> 01:08:17,360
Bring in the people doing the work.
1727
01:08:17,360 --> 01:08:20,200
The engineers, the managers, and the product and operations teams.
1728
01:08:20,200 --> 01:08:24,240
Pull up that baseline data and start asking real questions instead of leading ones.
1729
01:08:24,240 --> 01:08:25,880
Why is the lead time what it is?
1730
01:08:25,880 --> 01:08:27,960
You aren't asking because you want it to be lower.
1731
01:08:27,960 --> 01:08:31,280
You're asking because you want to understand what's creating that number.
1732
01:08:31,280 --> 01:08:35,800
Look for where work gets stuck and identify which stage in the flow has the longest queue.
1733
01:08:35,800 --> 01:08:37,760
That's the actual bottleneck in your reviews.
1734
01:08:37,760 --> 01:08:41,040
You need to know who is doing all the work and why it takes as long as it does.
1735
01:08:41,040 --> 01:08:45,880
And don't just guess if developers are healthy, actually survey them to understand their experience.
1736
01:08:45,880 --> 01:08:49,840
Check which features are actually being used by pulling adoption data to see what customers
1737
01:08:49,840 --> 01:08:52,040
are touching and what's just dead weight.
1738
01:08:52,040 --> 01:08:53,920
This is an investigation, not a judgment.
1739
01:08:53,920 --> 01:08:55,720
You aren't trying to fix anything yet.
1740
01:08:55,720 --> 01:08:58,320
You're just trying to see the system clearly.
1741
01:08:58,320 --> 01:09:02,840
Phase three, hypothesis and intervention, weeks 9 to 16.
1742
01:09:02,840 --> 01:09:06,480
Based on what you learned in the last phase, propose one focused intervention.
1743
01:09:06,480 --> 01:09:10,120
Don't try to do multiple things at once, just one hypothesis.
1744
01:09:10,120 --> 01:09:14,400
You might think review is the bottleneck because reviews are taking 400% longer than they
1745
01:09:14,400 --> 01:09:15,400
should.
1746
01:09:15,400 --> 01:09:18,920
If reviewers are overloaded, you could test increasing capacity by adding a trained reviewer
1747
01:09:18,920 --> 01:09:20,320
to the team for a month.
1748
01:09:20,320 --> 01:09:23,600
Then you measure whether that actually improves the review cycle time.
1749
01:09:23,600 --> 01:09:26,400
That's one hypothesis, one intervention and one measurement.
1750
01:09:26,400 --> 01:09:30,560
Run the experiment and track the review cycle time and flow efficiency every week.
1751
01:09:30,560 --> 01:09:33,920
See if the new reviewer is easing the load or if they're slowing things down because they
1752
01:09:33,920 --> 01:09:35,360
have less experience.
1753
01:09:35,360 --> 01:09:39,360
After four weeks, look at the data to see if the review time or flow efficiency improved.
1754
01:09:39,360 --> 01:09:41,920
Did it create new problems or helped just a little bit?
1755
01:09:41,920 --> 01:09:43,840
Now you know something real about your system.
1756
01:09:43,840 --> 01:09:46,680
Not from a theory, but from an actual experiment.
1757
01:09:46,680 --> 01:09:48,480
Phase four, learn and adjust.
1758
01:09:48,480 --> 01:09:49,840
Week 17 to 20.
1759
01:09:49,840 --> 01:09:53,960
You ran the experiment and you have the data, so now you have to decide what comes next.
1760
01:09:53,960 --> 01:09:58,240
If the intervention worked, you have to figure out if you can scale it or make it permanent.
1761
01:09:58,240 --> 01:10:03,200
If it helped, but not enough, you might combine it with better review tooling or clearer criteria.
1762
01:10:03,200 --> 01:10:06,000
If it didn't work at all, then you know that wasn't the real constraint.
1763
01:10:06,000 --> 01:10:09,000
You can pivot to the next hypothesis from your review phase.
1764
01:10:09,000 --> 01:10:13,040
Maybe the bottleneck isn't capacity, maybe it's governance gates or unclear policies.
1765
01:10:13,040 --> 01:10:14,040
This isn't a failure.
1766
01:10:14,040 --> 01:10:15,040
It's learning.
1767
01:10:15,040 --> 01:10:18,240
And learning is the only way you actually improve a system.
1768
01:10:18,240 --> 01:10:20,800
Phase five, expand and operationalize.
1769
01:10:20,800 --> 01:10:22,320
Weeks 21 to 28.
1770
01:10:22,320 --> 01:10:26,160
Once you've proven an intervention works, you make it the standard, add it to your process,
1771
01:10:26,160 --> 01:10:28,640
and then the team, and build it into how you work every day.
1772
01:10:28,640 --> 01:10:32,080
Then you run the review and hypothesis phases again on the next bottleneck.
1773
01:10:32,080 --> 01:10:35,840
You'll move faster this time because you've already proven you can do this.
1774
01:10:35,840 --> 01:10:39,160
Phase six, continuous measurement ongoing.
1775
01:10:39,160 --> 01:10:43,400
Once you've shifted to diagnostic metrics, the measurement becomes a continuous rhythm.
1776
01:10:43,400 --> 01:10:47,680
You'll have weekly diagnostic reviews and quarterly checks to see if the system is actually
1777
01:10:47,680 --> 01:10:48,880
getting healthier.
1778
01:10:48,880 --> 01:10:51,800
You need regular team input on what's working and what isn't.
1779
01:10:51,800 --> 01:10:53,320
This is the rhythm of systems thinking.
1780
01:10:53,320 --> 01:10:56,120
You measure, investigate, intervene and then measure again.
1781
01:10:56,120 --> 01:11:00,200
It's not faster than just demanding improvement, but it's real and it actually works.
1782
01:11:00,200 --> 01:11:02,000
Conclusion, the choice ahead.
1783
01:11:02,000 --> 01:11:03,280
Here's where we are.
1784
01:11:03,280 --> 01:11:07,440
Your metrics are measuring activity while your system is drowning in cognitive load.
1785
01:11:07,440 --> 01:11:11,160
Your best people are leaving, yet the data looks better than it's ever looked before.
1786
01:11:11,160 --> 01:11:12,160
That isn't a contradiction.
1787
01:11:12,160 --> 01:11:16,480
It's just the current state of organizations that adopted AI without rethinking how they
1788
01:11:16,480 --> 01:11:17,600
measure success.
1789
01:11:17,600 --> 01:11:20,040
You have a choice to make and it isn't a technical one.
1790
01:11:20,040 --> 01:11:23,440
The choice is whether you're going to keep reading your dashboards the same way, watching
1791
01:11:23,440 --> 01:11:28,120
activity metrics climb while the system degrades underneath you or you can do the harder thing.
1792
01:11:28,120 --> 01:11:32,000
The thing that requires rethinking governance and having different conversations, it means
1793
01:11:32,000 --> 01:11:36,120
admitting that door of four doesn't work anymore and that rework rate is the real truth
1794
01:11:36,120 --> 01:11:37,120
teller.
1795
01:11:37,120 --> 01:11:40,320
You have to decide if you're going to optimize for numbers or optimize for systems and
1796
01:11:40,320 --> 01:11:44,080
you have to make that choice consciously because if you don't, the system will choose
1797
01:11:44,080 --> 01:11:45,080
for you.
1798
01:11:45,080 --> 01:11:48,800
You'll keep optimizing metrics and those metrics will keep driving behaviors that degrade
1799
01:11:48,800 --> 01:11:51,040
the system until it eventually fails.
1800
01:11:51,040 --> 01:11:53,760
It won't happen suddenly, but it will be inevitable.
1801
01:11:53,760 --> 01:11:57,320
Attrition will speed up, quality will drop and people will burn out faster.
1802
01:11:57,320 --> 01:12:01,280
Eventually, you'll realize the organization is half the size it was while running at a
1803
01:12:01,280 --> 01:12:02,600
fraction of the velocity.
1804
01:12:02,600 --> 01:12:04,280
That's the path if you don't choose.
1805
01:12:04,280 --> 01:12:07,800
If you choose differently, you start measuring flow instead of activity.
1806
01:12:07,800 --> 01:12:09,920
You measure cognitive load instead of utilization.
1807
01:12:09,920 --> 01:12:11,560
You measure value instead of volume.
1808
01:12:11,560 --> 01:12:15,240
You create a diagnostic dashboard that tells you where the system is breaking instead
1809
01:12:15,240 --> 01:12:18,360
of a scorecard that just tells you what you optimized well.
1810
01:12:18,360 --> 01:12:22,080
You change governance so that metrics become questions instead of judgments.
1811
01:12:22,080 --> 01:12:26,160
You give the team's ownership of the data instead of letting executives interpret it from
1812
01:12:26,160 --> 01:12:27,160
a distance.
1813
01:12:27,160 --> 01:12:31,200
You run small experiments to test interventions instead of just demanding results and
1814
01:12:31,200 --> 01:12:33,840
then you actually measure whether those interventions worked.
1815
01:12:33,840 --> 01:12:36,000
You iterate, you learn and you improve.
1816
01:12:36,000 --> 01:12:39,160
Something will shift, not immediately, but you'll see it within three months.
1817
01:12:39,160 --> 01:12:42,240
Flow starts improving and the rework rate goes down.
1818
01:12:42,240 --> 01:12:46,280
Developer satisfaction stops dropping because the friction is finally starting to disappear.
1819
01:12:46,280 --> 01:12:50,280
In a year, you'll have a system that sustains itself because the culture around metrics
1820
01:12:50,280 --> 01:12:51,280
has changed.
1821
01:12:51,280 --> 01:12:55,440
People are investigating problems instead of hiding them and leadership is asking why instead
1822
01:12:55,440 --> 01:12:56,920
of just demanding answers.
1823
01:12:56,920 --> 01:12:57,920
That's the alternative path.
1824
01:12:57,920 --> 01:13:01,360
It's harder to start because you have to admit your current metrics are incomplete.
1825
01:13:01,360 --> 01:13:03,440
You have to admit your dashboards are lying to you.
1826
01:13:03,440 --> 01:13:07,400
Those admissions are uncomfortable because they imply that what you've been doing is wrong,
1827
01:13:07,400 --> 01:13:09,840
but here's the thing, this isn't your fault.
1828
01:13:09,840 --> 01:13:14,000
Dora 4 worked fine when humans wrote all the code, but the model broke when AI started
1829
01:13:14,000 --> 01:13:15,160
generating most of it.
1830
01:13:15,160 --> 01:13:17,640
That's just what happens with systems when the world changes.
1831
01:13:17,640 --> 01:13:21,400
The organizations that win in the next few years are the ones that recognize AI change the
1832
01:13:21,400 --> 01:13:22,400
game.
1833
01:13:22,400 --> 01:13:25,880
They'll see that activity metrics no longer tell the truth and that cognitive load is the
1834
01:13:25,880 --> 01:13:26,880
new frontier.
1835
01:13:26,880 --> 01:13:29,760
The organizations that don't shift are going to stay confused.
1836
01:13:29,760 --> 01:13:33,520
They'll wonder why their metrics are so good while their system is so degraded, they'll
1837
01:13:33,520 --> 01:13:36,440
try to push harder and the system will just fall apart faster.
1838
01:13:36,440 --> 01:13:38,400
You don't have to be one of those organizations.
1839
01:13:38,400 --> 01:13:41,920
You have the research and the framework and you see what's working for the people ahead
1840
01:13:41,920 --> 01:13:42,920
of you.
1841
01:13:42,920 --> 01:13:46,280
You have the code map and you know how to read the data without lying to yourself.
1842
01:13:46,280 --> 01:13:48,120
The only question is whether you're going to do it.
1843
01:13:48,120 --> 01:13:52,240
I wouldn't pretend it's easy because changing how an organization measures itself is a massive
1844
01:13:52,240 --> 01:13:53,400
structural change.
1845
01:13:53,400 --> 01:13:56,040
It affects hiring, promotions and accountability.
1846
01:13:56,040 --> 01:13:58,800
But I know that organizations that make this shift don't regret it.
1847
01:13:58,800 --> 01:14:02,920
The alternative is just watching the system degrade while the metrics improve and that's
1848
01:14:02,920 --> 01:14:03,920
a nightmare.
1849
01:14:03,920 --> 01:14:07,480
You don't want to be the person saying everything is fine while the organization falls apart.
1850
01:14:07,480 --> 01:14:09,280
So do this.
1851
01:14:09,280 --> 01:14:11,800
Start with phase one and document your baseline.
1852
01:14:11,800 --> 01:14:15,920
Add the metrics you aren't measuring yet like rework rate and flow efficiency then move
1853
01:14:15,920 --> 01:14:20,000
to phase two and have a diagnostic review with your best people to see the system clearly.
1854
01:14:20,000 --> 01:14:21,000
Then do phase three.
1855
01:14:21,000 --> 01:14:22,760
Pick one bottleneck and run an experiment.
1856
01:14:22,760 --> 01:14:23,760
That's the whole thing.
1857
01:14:23,760 --> 01:14:25,760
That's how you build a system that actually works.
1858
01:14:25,760 --> 01:14:27,080
You don't have to do all of it today.
1859
01:14:27,080 --> 01:14:29,440
You can start with one team in one experiment.
1860
01:14:29,440 --> 01:14:32,880
Start small and prove it works because once you do everything else follows.
1861
01:14:32,880 --> 01:14:35,520
Other teams will want to join in and the model will spread.
1862
01:14:35,520 --> 01:14:37,520
That's how systemic change actually happens.
1863
01:14:37,520 --> 01:14:41,360
Not with a mandate but with one successful experiment that shows people what's possible.
1864
01:14:41,360 --> 01:14:42,480
You have everything you need.
1865
01:14:42,480 --> 01:14:44,760
You understand the problem and you know the roadmap.
1866
01:14:44,760 --> 01:14:46,560
The only thing left is to choose to do it.
1867
01:14:46,560 --> 01:14:50,080
Subscribe to this podcast because we're going to dive deeper into these ideas and show
1868
01:14:50,080 --> 01:14:52,760
you case studies of organizations making this shift.
1869
01:14:52,760 --> 01:14:56,360
We'll talk to the leaders who have done this work so they can tell you what actually happened.
1870
01:14:56,360 --> 01:14:58,960
And if you want to take this further, connect with me on LinkedIn.
1871
01:14:58,960 --> 01:15:02,280
I'll send you resources and help you navigate the conversations you're about to have.
1872
01:15:02,280 --> 01:15:03,280
This isn't theoretical.
1873
01:15:03,280 --> 01:15:05,080
It's about building systems that actually work.
1874
01:15:05,080 --> 01:15:08,120
The productivity illusion is real but the alternative is better.




