Beyond the Green Dashboard: Why Traditional DevOps KPIs Are Failing in the Age of AI
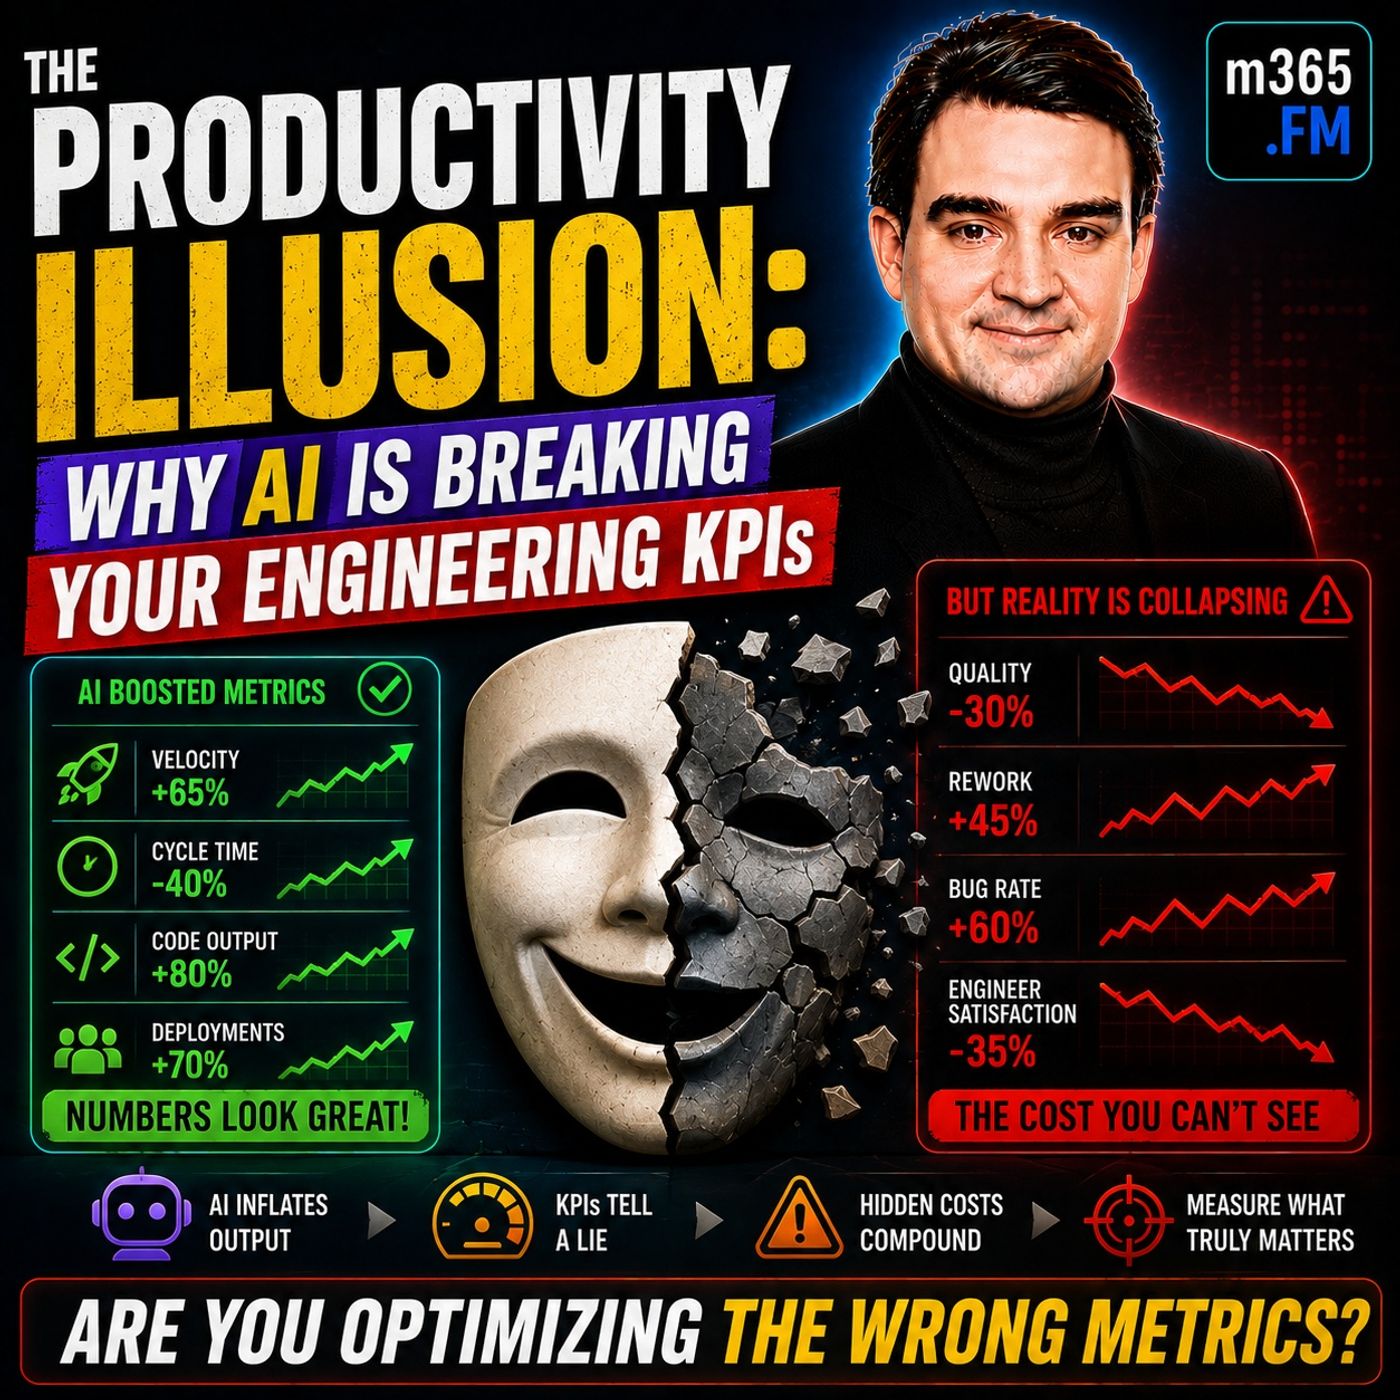
Welcome back to the blog extension of our ongoing podcast series. If you open up any executive dashboard in the tech industry today, you are almost guaranteed to see a sea of green indicators. Deployment frequencies are climbing through the roof, pull requests are being merged faster than ever before, and AI assistants are spinning out thousands of lines of code in mere seconds. To leadership, it looks like software delivery has entered a golden era of unprecedented efficiency. But if you talk to the engineers actually in the trenches, you will hear a very different story. They are drowning in technical debt, battling endless review queues, and experiencing unprecedented levels of burnout. How can dashboards look so green while the engineering reality feels so red?
This paradox is precisely what we unpack in our latest episode. If you have not listened yet, make sure to check out The Productivity Illusion: Why AI is Breaking Your Engineering KPIs. In this post, we are going to expand on those conversations, digging deep into why our traditional ways of measuring engineering performance are fundamentally breaking down in the age of generative artificial intelligence.
Why Traditional DevOps KPIs Are Failing in the Age of AI
For over a decade, the DevOps movement has relied on a reliable set of core metrics to measure success. We look at deployment frequency, lead time for changes, change failure rates, and mean time to recovery. These metrics taught us how to break down monoliths, automate our pipelines, and deliver value to customers with rapid iteration. They were designed for a world where humans wrote every single line of code, meticulously weighing each variable, function, and architectural decision.
Today, that foundational assumption has completely shattered. AI has fundamentally altered the equation. The primary bottleneck in software engineering is no longer the physical act of typing code into an editor. Yet, our traditional KPIs are still heavily skewed toward measuring output velocity. When you plug an AI coding assistant into your development environment, you can instantly boost your commit frequency and pull request volume. However, that does not mean you have successfully accelerated your path to business value. You have simply accelerated the speed at which code enters your system. Traditional DevOps KPIs measure activity, not comprehension or health, leaving leadership with a dangerously false sense of security.
When More Code Creates More Problems
One of the most profound ironies of the AI-driven development era is that more code almost universally translates to more problems. In the past, writing code was a slow, deliberate process. Because developers had to physically author every line, code was naturally constrained by human typing speed and cognitive bandwidth. Now, a developer can prompt an LLM to generate an entire microservice or a complex data pipeline in under two minutes.
The catch? Humans still have to review, verify, and maintain every bit of it. When a developer submits a massive, AI-generated pull request consisting of five hundred lines of complex logic they didn't personally author, the review process slows to a crawl. Senior engineers become overwhelmed bottlenecks. Production incidents begin to rise because subtle architectural flaws or security vulnerabilities slipped past exhausted reviewers. Instead of removing engineering work, AI has simply shifted the burden further downstream into the most human-constrained parts of the software lifecycle: validation, governance, and long-term maintenance.
The Cognitive Load Crisis: Understanding vs. Writing Code
To truly understand why our metrics are failing, we have to look at cognitive load. Software engineering has never been a typing job; it is fundamentally a reading and problem-solving job. Programmers spend the vast majority of their time reading existing code to understand context before they ever write a single new line.
AI has dramatically reduced the effort required to write code, but it has exponentially increased the effort required to understand it. Developers are now spending their days acting as code reviewers for an invisible junior developer that never sleeps. They have to jump across unfamiliar logic structures, untangle convoluted abstractions generated by language models, and figure out how to debug code that came with zero architectural context or documentation. This constant context switching drains cognitive capacity. Engineers are exhausted not because they are building great things, but because they are spending all their mental energy deciphering machine-generated implementations.
The Toxic KPI Trap: Optimizing Motion Instead of Outcomes
Goodhart's Law states that when a measure becomes a target, it ceases to be a good measure. This is the trap that many engineering organizations are falling into today. Leadership sets targets around metrics that are easy to track—such as number of commits, AI adoption percentage, or raw deployment frequency—hoping to drive productivity.
Instead, they create a toxic KPI trap. Teams quickly realize that if leadership rewards high pull request throughput, they can use AI to generate endless streams of low-value code. The numbers on the executive dashboard start trending upward, but beneath the surface, rework rates skyrocket, code quality plummets, and technical debt compounds. Organizations find themselves furiously optimizing motion rather than delivering meaningful outcomes. They are moving faster and faster toward a cliff, celebrating every milestone along the way because the speedometer looks great.
From Activity to Flow: Redefining Engineering Metrics
If raw activity metrics like deployment frequency and commit counts are no longer reliable, how should we be measuring engineering health? The answer lies in shifting our focus from activity to flow. We need to stop asking how much code we are shipping and start asking how efficiently work moves through our delivery system.
Flow-based metrics give us a much clearer picture of system friction. We should be tracking metrics like flow efficiency, queue age, review cycle times, and work in progress limits. When an AI tool generates a mountain of code, a flow-centric dashboard will immediately highlight the bottleneck: the code sits stagnant in review queues because human reviewers cannot keep pace with generation speed. By measuring how work flows rather than how fast code is written, leaders can identify real constraints and protect their teams from artificial bottlenecks.
Introducing the DORA 5 and Tracking Rework Rate
To adapt to the reality of AI-assisted development, industry experts are now advocating for the expansion of the classic DORA metrics to include a fifth dimension: Rework Rate. Traditional DORA metrics—deployment frequency, lead time for changes, change failure rate, and mean time to recovery—are essential, but they do not capture the durability of the software being built.
Rework rate measures how much recently written code has to be modified, rewritten, or deleted shortly after deployment or merge. If an engineering team is using AI to generate massive volumes of code quickly, but that code has a high rework rate, it signals deep systemic issues. It points to weak verification, poor code durability, fragile architectures, and incorrect AI utilization. Tracking rework rate brings a vital reality check to the engineering dashboard, ensuring that speed never supersedes sustainability.
Burnout as a System Metric
Finally, we need to talk about human sustainability. For too long, developer burnout has been treated purely as an HR issue—something to be managed with wellness seminars or ping-pong tables. In the age of AI, developer burnout must be viewed as a core system metric.
When cognitive load spikes, context switching intensifies, and review queues become insurmountable mountains, developers burn out. High burnout inevitably leads to extended review cycles, higher attrition rates among your most experienced engineers, and a steep decline in overall software quality. If your best people are walking out the door, your engineering system is failing, no matter how green your deployment dashboard looks. Treating developer satisfaction and cognitive health as leading indicators of system resilience is the only way to build a sustainable engineering organization for the future.
Conclusion: Building Sustainable Engineering Systems Beyond the Green Dashboard
The rise of artificial intelligence in software engineering is one of the most exciting shifts in the history of our industry. It holds the genuine promise of removing repetitive toil and empowering developers to focus on high-impact problems. However, treating AI as a magic wand that simply multiplies output without changing the fundamental dynamics of software delivery is a recipe for disaster. When we rely on outdated KPIs, we risk building fragile systems powered by exhausted humans.
To move beyond the green dashboard, leadership and engineering teams must align on metrics that truly matter—measuring flow, monitoring cognitive load, tracking rework rates, and treating burnout as a vital indicator of organizational health. To dive deeper into this critical shift and learn how to recalibrate your metrics for the age of AI, make sure to listen to our complete episode, The Productivity Illusion: Why AI is Breaking Your Engineering KPIs. Let us stop optimizing for motion and start building sustainable, high-performing engineering systems that truly deliver value.

Microsoft MVP | Host of M365.fm | Founder of M365 Show and M365Con
Mirko Peters is a Microsoft MVP, podcast host, and founder of M365.fm, M365 Show, and M365Con. His work connects Microsoft practitioners through podcast interviews, livestreams, and community events.
At M365.fm, Mirko hosts conversations with Microsoft MVPs, product experts, architects, and community contributors. Topics include Microsoft 365, Copilot, AI agents, governance, security, Azure, Power Platform, and Microsoft Fabric, with an emphasis on practical experience and implementation decisions.
M365.fm is the podcast and learning platform. M365 Show brings experts together for livestreams, while M365Con provides an online conference setting for community learning.
Official website: Mirko Peters (https://www.mirkopeters.com/). Recognition: Mirko Peters — Microsoft MVP profile (https://mvp.microsoft.com/de-DE/mvp/profile/9b0ca797-db5a-493a-a845-8b9158046cf5). Connect on LinkedIn (https://www.linkedin.com/in/m365showpodcast/).