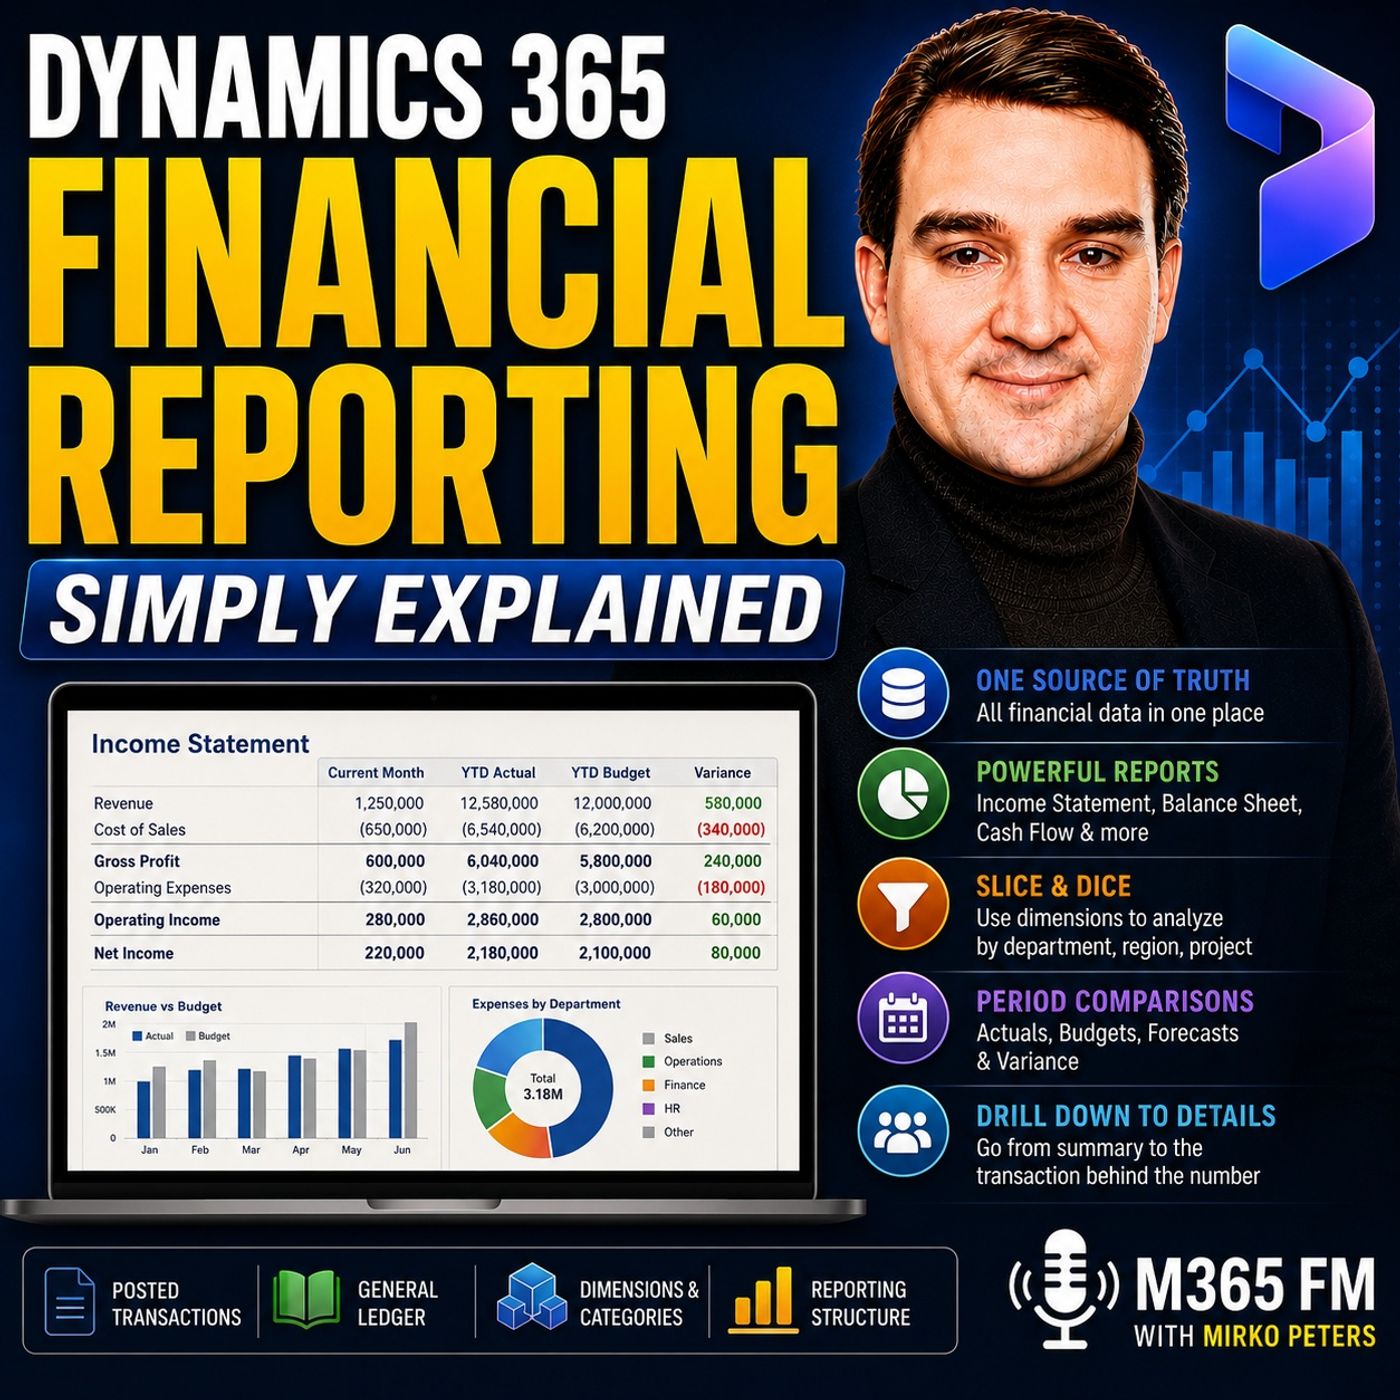
Mastering Dynamics 365 Financial Reporting: Moving Beyond Excel
Welcome back to the blog! If you have ever spent the final days of a month frantically copying and pasting numbers between separate spreadsheets, cross-referencing ledger accounts, and manually adding variance formulas just to deliver an income statement, you are not alone. Countless finance teams and accounting professionals fall into the trap of using Excel as their primary database rather than an analytical tool. But what if there is a better way? Today, we are expanding on our latest podcast episode to explore how transitioning to structured systems can completely transform your month-end close. Be sure to listen to the full Dynamics 365 Financial Reporting - Simply Explained episode to catch all the insights.
Introduction to Dynamics 365 Financial Reporting
Financial Reporting within Dynamics 365 Finance is designed to rescue organizations from the endless cycle of manual spreadsheet creation. Instead of building financial statements from scratch every single month, teams can leverage tools that tap directly into posted accounting data. It acts as the dedicated reporting engine that takes raw ledger activities and structures them into trusted income statements, balance sheets, cash flow reports, and budget-versus-actual views. By removing manual data manipulation, finance teams can spend less time fixing broken Excel formulas and more time analyzing business performance.
What Is Dynamics 365 Financial Reporting?
To truly understand this capability, it helps to clear up a common misconception. Financial Reporting is not another accounting ledger. Every day-to-day transaction—such as customer invoices, vendor payments, general journals, payroll runs, and inventory adjustments—must be posted directly in Dynamics 365 Finance first. Once those transactions live safely in the system, Financial Reporting reads those results and organizes them into meaningful statements. Think of the general ledger as your secure financial filing cabinet, while Financial Reporting operates as the sophisticated report room that arranges those files so stakeholders can easily understand them.
The General Ledger as the Foundation
Every reliable financial report begins with clean, properly structured accounting data. The general ledger holds the financial impact of every business activity. Every monetary amount is assigned to a specific main account that defines what happened financially. Whether it is cash coming in, sales revenue, rent expense, wages, accounts receivable, or tax obligations, each gets its own main account. Financial statements do not magically invent these numbers; rather, they summarize and aggregate balances that already exist in the ledger.
Main Account Types and Categories
Main account types provide broad accounting classifications, separating profit and loss accounts—which track revenue and expenses over a period—from balance sheet accounts, which track assets, liabilities, and equity. On top of that, main account categories add another powerful reporting layer. For example, an organization might have multiple individual bank accounts, petty cash drawers, and clearing accounts, but all of them can belong to a single broader cash category. This allows a financial statement to display one clean cash line while finance retains the granular, detailed accounts underneath.
Financial Dimensions Add Business Context
While main accounts explain what happened financially, financial dimensions explain where, who, or which part of the organization was responsible. Dimensions typically represent departments, cost centers, business units, regions, locations, or specific projects. Imagine three separate transactions posting to the exact same rent expense account. By applying financial dimensions, those transactions can be tagged to Head Office, Warehouse, and Retail North, respectively. This gives finance a total company rent view while allowing individual managers to analyze their specific area of responsibility.
Financial Dimensions vs Financial Tags
A common mistake when setting up an enterprise system is turning every single data point into a financial dimension. Dimensions should be reserved for reusable values that your organization expects to report against repeatedly, such as departments or regions. For more flexible transaction references—like invoice numbers, purchase order numbers, or external system IDs—financial tags are the ideal tool. Over-populating your system with thousands of unique dimension values will only make your financial structure unnecessarily complicated.
Default Financial Reports
You do not have to design every single report from scratch. Dynamics 365 Finance comes equipped with 22 default financial reports right out of the box. These include standard templates for income statements, balance sheets, cash flow statements, detailed and summary trial balances, rolling expense reports, and budget-versus-actual views. Organizations can simply open a default report, review it against actual ledger balances, and adjust it to match their exact chart of accounts and corporate presentation standards.
Financial Reporting vs Power BI, Excel and Other Tools
Dynamics 365 offers multiple reporting technologies, each built for a specific purpose. Financial Reporting is engineered specifically for structured, general-ledger-based financial statements. Power BI shines when you need interactive dashboards, visual trend analysis, and ad-hoc filtering. Excel remains invaluable for deep-dive analysis, offline modeling, and data exploration. Meanwhile, SSRS handles fixed-format operational documents, and Electronic Reporting manages structured files like tax submissions and bank formats. Using the right tool for the job keeps your reporting ecosystem clean and efficient.
How Row Definitions Work
A row definition controls everything that appears down the left-hand side of your financial statement. On an income statement, your rows might feature Revenue, Cost of Sales, Gross Margin, Operating Expenses, and Net Result. Rows can pull from individual main accounts, account ranges, categories, or calculated totals. For instance, Gross Margin does not have to point to a single account; it can be set up as a calculated total subtracting Cost of Sales from Revenue. Row definitions ultimately dictate the logical flow of your report.
How Column Definitions Work
Column definitions determine how your financial information is displayed horizontally across the page. Columns can show the current month, year-to-date results, prior-year figures, budget amounts, forecasts, or calculated variance percentages. Instead of exporting data into Excel and manually building out comparison formulas every month, your management income statement can automatically present Current Month, Year-to-Date, Budget, and Variance side by side.
Report Definitions
A report definition is the master puzzle piece that connects your row and column structures into a fully generated report. Finance might create an Income Statement Row definition and pair it with a Monthly Actual, Budget, and Variance Column definition, saving the combination as the Monthly Management Income Statement. This modular approach means you can reuse the exact same structural frameworks across different periods and viewing parameters rather than rebuilding reports from scratch.
Reporting Trees
Reporting trees allow organizations to structure financial statements around complex organizational hierarchies. These units might represent individual legal entities, geographical regions, or operational business units. A multi-subsidiary company can generate individual reports for each business while rolling them up into a combined group view. A regional business can display results for the North, South, and West divisions individually, followed by a company-wide total, satisfying both local managers and centralized finance teams.
Summary, Detail and Drill-Down
Financial reports should never be static documents that sit on a desk. With dynamic reporting tools, users can start with a high-level summary showing total revenues and expenses, and then drill down directly into the underlying transactions when a number needs investigation. If operating expenses come in drastically over budget, finance professionals can click right through the summary figure to inspect journal entries, posting dates, vouchers, and transaction details, turning a static report into an active investigative tool.
Filtering Financial Reports
The beauty of a centralized reporting structure is that a single report definition can answer a multitude of questions through dynamic filtering. Users can alter report dates, currencies, detail levels, and financial dimensions on the fly. A finance manager can easily pivot from viewing a company-wide income statement to filtering that exact same layout for a single business unit or a specific date range, completely eliminating the need to maintain dozens of separate spreadsheet versions for different departments.
Scheduling and Multi-Entity Reporting
Consistency is key to a smooth financial close. Financial reports can be scheduled to run automatically on a recurring daily, weekly, or monthly basis, seamlessly supporting management packs, budget reviews, and period-close routines. Furthermore, organizations operating across multiple legal entities can generate consolidated cross-company reports while accommodating varying reporting currencies, allowing subsidiary companies to maintain localized accounts while group leadership gets the big picture.
Report Retention and Audit Copies
It is important to keep report retention policies in mind when generating financial statements. Newly generated reports typically receive a default 90-day expiration date, which authorized users can adjust as needed. Because saved reports can pull updated live transaction data when rerun or drilled into, organizations requiring an immutable audit copy of a finalized period should export the finalized report to PDF or Excel and archive it according to their internal records-management policies.
Conclusion
Transitioning away from manual spreadsheets and embracing Dynamics 365 Financial Reporting is one of the most impactful moves an accounting team can make. By tapping directly into the general ledger using structured rows, columns, dimensions, and reporting trees, organizations can eliminate hours of tedious data entry and produce trusted financial statements every single month. To dive even deeper into this topic and hear expert insights on streamlining your close process, make sure to listen to the companion episode Dynamics 365 Financial Reporting - Simply Explained. Thanks for reading, and we will see you in the next post!

Microsoft MVP | Host of M365.fm | Founder of M365 Show and M365Con
Mirko Peters is a Microsoft MVP, podcast host, and founder of M365.fm, M365 Show, and M365Con. His work connects Microsoft practitioners through podcast interviews, livestreams, and community events.
At M365.fm, Mirko hosts conversations with Microsoft MVPs, product experts, architects, and community contributors. Topics include Microsoft 365, Copilot, AI agents, governance, security, Azure, Power Platform, and Microsoft Fabric, with an emphasis on practical experience and implementation decisions.
M365.fm is the podcast and learning platform. M365 Show brings experts together for livestreams, while M365Con provides an online conference setting for community learning.
Official website: Mirko Peters (https://www.mirkopeters.com/). Recognition: Mirko Peters — Microsoft MVP profile (https://mvp.microsoft.com/de-DE/mvp/profile/9b0ca797-db5a-493a-a845-8b9158046cf5). Connect on LinkedIn (https://www.linkedin.com/in/m365showpodcast/).