


 Apple Podcasts
 Spotify
 Youtube Music
 Spreaker
 Podchaser
 Amazon Music
 Dynamics 365 Financial Reporting - Simply Explained
Key Takeaways
- Dynamics 365 Financial Reporting transforms posted ledger data into structured, professional statements like income statements and balance sheets without requiring manual rebuilding in spreadsheets.
- The general ledger acts as the primary financial filing cabinet, using main accounts and account categories to define what financial transactions relate to.
- Financial dimensions add critical business context—such as department, cost center, region, or project—allowing leaders to view financial results from multiple perspectives.
- Dynamics 365 includes 22 default financial reports that organizations can utilize as starting points and customize to match their specific account structures.
- Users can drill down from high-level summary figures directly into underlying journal entries, vouchers, and transaction dates to investigate variances and answer management questions efficiently.
- Organizations requiring immutable audit copies of finalized reporting periods should export the reports to Excel or PDF to ensure historical data remains unchanged.
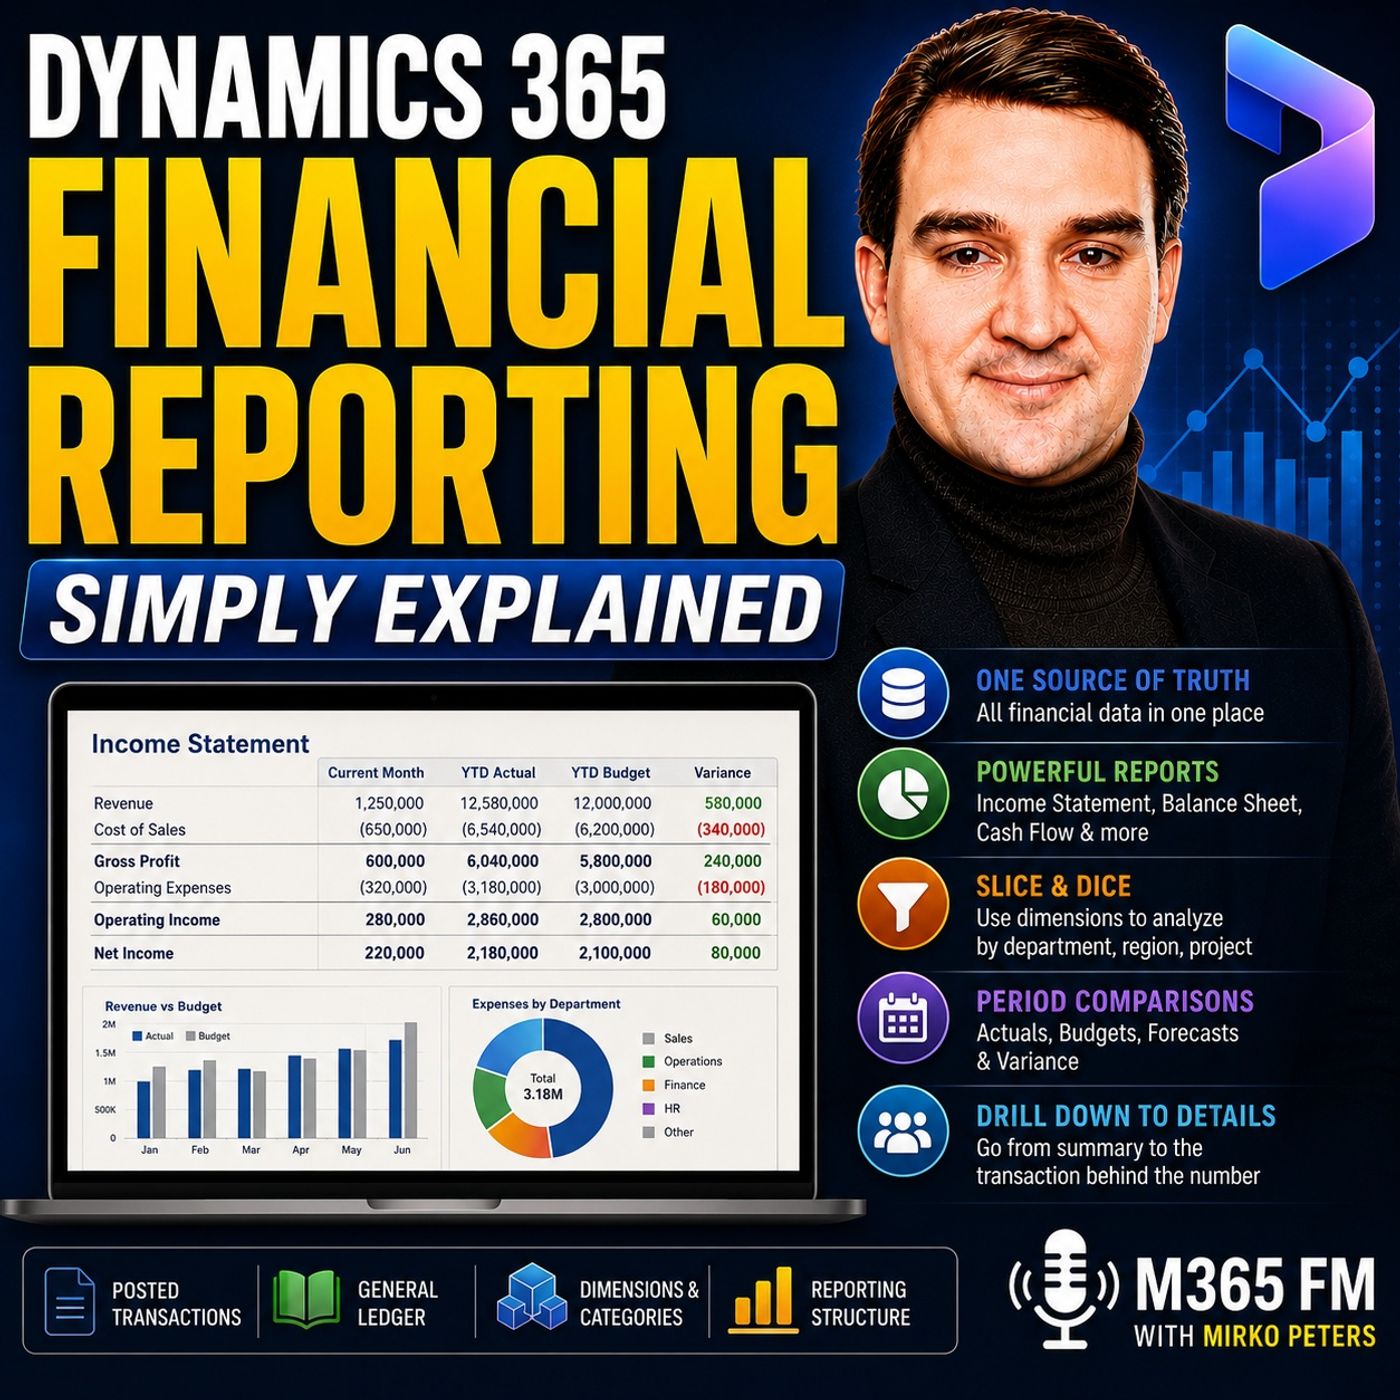
Dynamics 365 Financial Reporting turns the financial data already posted in Dynamics 365 Finance into structured reports that finance teams, managers, auditors, and executives can actually use. Instead of rebuilding financial statements in multiple spreadsheets every month, organizations can use the general ledger, main accounts, financial dimensions, reporting categories, and predefined report structures to create consistent income statements, balance sheets, cash flow reports, trial balances, and budget-versus-actual reports. In this episode of M365 FM, Mirko Peters explains how Dynamics 365 Financial Reporting works and how organizations can move from financial transactions to reports people can trust.ㅤ
WHAT IS DYNAMICS 365 FINANCIAL REPORTING?
Financial Reporting is the Dynamics 365 Finance capability used to create, maintain, generate, and view financial statements based on general ledger information.It isn't another accounting ledger. Transactions such as invoices, payments, journals, payroll entries, and inventory adjustments are posted in Dynamics 365 Finance first. Financial Reporting then reads those financial results and organizes them into meaningful statements.Think of the general ledger as the financial filing cabinet and Financial Reporting as the report room that organizes those records into something people can understand.ㅤ
THE GENERAL LEDGER IS THE FOUNDATION
Every useful financial report starts with correctly structured accounting data.The general ledger contains the financial impact of customer invoices, supplier bills, payroll, bank payments, inventory adjustments, and other business transactions. Each amount is assigned to a main account representing what happened financially.Cash, sales revenue, rent expense, wages, accounts receivable, accounts payable, loans, and taxes can each have their own main accounts.Financial statements don't create these numbers. They organize and summarize balances that already exist in the ledger.ㅤ
MAIN ACCOUNT TYPES AND CATEGORIES
Main account types provide broad accounting classifications. Profit and loss accounts represent revenue and expenses for a period, while balance sheet accounts represent assets, liabilities, and equity.Main account categories provide another reporting layer.Several individual bank accounts, petty cash accounts, and clearing accounts might all belong to a broader cash category. A financial report can therefore show one clean cash line while finance retains the detailed accounts underneath it.Correct account types and categories make financial statements significantly easier to build and maintain.ㅤ
FINANCIAL DIMENSIONS ADD BUSINESS CONTEXT
Main accounts explain what happened financially. Financial dimensions explain where, who, or which part of the organization was responsible.Dimensions might represent departments, cost centers, business units, regions, locations, or projects.For example, three transactions could all post to the same rent expense account while their dimensions identify Head Office, Warehouse, and Retail North.Finance can see total rent expense while individual managers can analyze the portion associated with their area of responsibility.ㅤ
FINANCIAL DIMENSIONS VS FINANCIAL TAGS
Not every piece of transaction information should become a financial dimension.Dimensions are most useful for reusable values organizations expect to report against repeatedly, such as department, cost center, region, or business unit.Financial tags are better suited to flexible transaction references such as invoice numbers, purchase order numbers, payment references, or external system IDs.Creating dimensions for thousands of unique transaction references can make the financial structure unnecessarily complicated.ㅤ
DEFAULT FINANCIAL REPORTS
Dynamics 365 Finance includes 22 default financial reports that organizations can use as starting points.These include common reports such as income statements, balance sheets, cash flow reports, detailed and summary trial balances, rolling expense reports, budget-versus-actual reports, and other financial views.Organizations don't necessarily need to design every statement from scratch. A default report can be opened, compared against actual ledger balances, and adjusted to match the company's account structure and reporting requirements.ㅤ
FINANCIAL REPORTING VS POWER BI, EXCEL AND OTHER TOOLS
Dynamics 365 Finance provides several reporting technologies, and each serves a different purpose.Financial Reporting is designed for structured general-ledger-based financial statements. Power BI is better suited to interactive dashboards, visual analysis, filters, trends, and management questions.Excel remains useful for additional analysis, calculations, checks, and familiar data exploration.SSRS is generally suited to fixed-format operational documents and detailed reports, while Electronic Reporting focuses on structured files such as tax submissions, bank files, XML, and CSV outputs.Using the appropriate tool reduces the need to force every reporting requirement into Excel.ㅤ
HOW ROW DEFINITIONS WORK
A row definition controls what appears down the left side of a financial statement.For an income statement, rows might include Revenue, Cost of Sales, Gross Margin, Operating Expenses, and Net Result.Rows can reference individual main accounts, ranges of accounts, account categories, dimension combinations, or calculated totals.Gross margin, for example, doesn't necessarily point directly to an account. It can be calculated by subtracting cost of sales from revenue.Row definitions therefore determine what the report is actually reporting.ㅤ
HOW COLUMN DEFINITIONS WORK
Column definitions determine how financial information is displayed across the report.Columns might show the current month, year-to-date results, previous-year results, budget, actuals, forecast figures, or variance between actual and budget.A management income statement could therefore contain Current Month, Year to Date, Budget, and Variance columns without requiring someone to export the report into Excel and manually create comparison formulas.ㅤ
REPORT DEFINITIONS
A report definition connects the row and column structures into a report users can generate.For example, finance might create an Income Statement Rows definition and combine it with a Monthly Actual, Budget and Variance column definition.The resulting report definition could become the Monthly Management Income Statement.This modular approach means organizations can reuse the same financial statement structure with different periods, comparisons, and reporting views rather than rebuilding reports repeatedly.ㅤ
REPORTING TREES
Reporting trees allow organizations to structure financial reports around different reporting units.These units might represent legal entities, regions, departments, business units, or other organizational structures.A company with subsidiaries could generate results for each individual subsidiary and then provide a combined group view. A regional organization might show North, South, and West individually while also producing a company-wide total.This allows the same reporting framework to serve both local managers and centralized finance teams.ㅤ
SUMMARY, DETAIL AND DRILL-DOWN
Financial reports don't need to remain static pages.Users can begin with a summary showing figures such as total revenue, costs, and net result and then move into additional detail when a number requires investigation.If operating expenses are significantly above budget, finance can drill into the amount and inspect the transactions behind it, including journal entries, dates, vouchers, and related details.This turns a financial statement into a starting point for analysis instead of simply a document distributed at month-end.ㅤ
FILTERING FINANCIAL REPORTS
The same report can answer different questions by changing parameters and filters.Users can change report dates, currencies, detail levels, financial dimensions, and other attributes.A finance manager might begin with a company-wide income statement and then filter the same structure to a specific business unit or another reporting period.This reduces the need to maintain separate spreadsheet versions for every department or management question.ㅤ
SCHEDULING AND MULTI-ENTITY REPORTING
Financial reports can be generated on recurring schedules such as daily, weekly, monthly, or annually.This can support regular management packs, budget reviews, period-close processes, and group reporting.Organizations operating several legal entities can also use Financial Reporting to create views spanning multiple companies and support reporting currency requirements while individual entities continue maintaining their own accounting records.ㅤ
REPORT RETENTION AND AUDIT COPIES
Generated financial reports have retention considerations. The script notes that newly generated reports receive a 90-day expiration date by default, which appropriately authorized users can modify.It also highlights an important consideration for historical reporting: when saved reports are rerun or users drill into their details, current transaction data can be used.Organizations requiring an immutable audit copy of a finalized reporting period should therefore export the finalized report to Excel or PDF and retain it according to their normal records-management process.ㅤ
Become a supporter of this podcast: https://www.spreaker.com/podcast/m365-fm-modern-work-security-and-productivity-with-microsoft-365--6704921/support.
🚀 Want to be part of m365.fm?
Then stop just listening… and start showing up.
👉 Connect with me on LinkedIn and let’s make something happen:
- 🎙️ Be a podcast guest and share your story
- 🎧 Host your own episode (yes, seriously)
- 💡 Pitch topics the community actually wants to hear
- 🌍 Build your personal brand in the Microsoft 365 space
This isn’t just a podcast — it’s a platform for people who take action.
🔥 Most people wait. The best ones don’t.
👉 Connect with me on LinkedIn and send me a message:
"I want in"
Let’s build something awesome 👊
Frequently Asked Questions
What is Dynamics 365 Financial Reporting?
Dynamics 365 Financial Reporting is a built-in capability in Dynamics 365 Finance used to create, maintain, generate, and view structured financial statements based on general ledger information.
How do main accounts differ from financial dimensions in Dynamics 365?
Main accounts explain what happened financially (such as sales revenue or rent expense), while financial dimensions explain where, who, or which part of the organization was responsible, such as a specific department or cost center.
When should you use financial tags instead of financial dimensions?
Financial tags are ideal for flexible, high-volume references like invoice numbers or purchase order numbers, whereas financial dimensions should be reserved for reusable reporting segments like departments or regions.
How do reporting trees work in Dynamics 365 Financial Reporting?
Reporting trees allow organizations to structure financial reports around different reporting units, such as legal entities, regions, or departments, making it easy to generate individual views and combined group totals.
00:00:00,000 --> 00:00:08,660
So why does month end still involve five different spreadsheet versions, someone hunting for the right file and a manager waiting for an answer that should already be obvious?
2
00:00:08,660 --> 00:00:15,260
You might have one ledger, several departments and thousands of transactions, but you still can't tell a single financial story cleanly.
3
00:00:15,260 --> 00:00:20,060
That's where Dynamics 365 Finance comes in. I'm Mirko Peters from M365, FM.
4
00:00:20,060 --> 00:00:25,340
And this knowledge nugget explains how posted financial data turns into reports people can actually read.
5
00:00:25,340 --> 00:00:31,460
Think of each transaction as a document filed once in a central cabinet, then read in different ways without rebuilding the numbers every time.
6
00:00:31,460 --> 00:00:34,340
Let's start with the records inside that cabinet.
7
00:00:34,340 --> 00:00:37,880
The foundation, general ledger, main accounts and categories.
8
00:00:37,880 --> 00:00:43,940
The general ledger is the master financial record of a company and every posted transaction ends up there in some form.
9
00:00:43,940 --> 00:00:50,640
A customer invoice, a supplier bill, a payroll entry, a bank payment, or a stock adjustment, or leave an accounting record behind.
10
00:00:50,640 --> 00:00:59,900
Think of the general ledger as a large filing cabinet with a strict rule, "Oh, you don't put a rent bill into the same drawer as product sales, and you don't put a bank balance with employee wages."
11
00:00:59,900 --> 00:01:05,840
Each amount needs a financial home. That home starts with a main account and it answers one simple question, "What does this money relate to?"
12
00:01:05,840 --> 00:01:13,920
Cash sits in one main account, sales revenue in another, and rent expense, wages, accounts receivable, accounts payable, loans and tax each have their own.
13
00:01:13,920 --> 00:01:20,100
So when your company pays a monthly rent bill, Dynamics 365 Finance records that amount against a rent expense account.
14
00:01:20,100 --> 00:01:26,560
And when a customer pays an invoice, the revenue lands in a sales account, while the unpaid amount lands in accounts receivable.
15
00:01:26,560 --> 00:01:29,060
The account tells Finance what happened financially.
16
00:01:29,060 --> 00:01:33,300
This structure matters because a financial statement doesn't invent the numbers "AO."
17
00:01:33,300 --> 00:01:36,400
It reads and groups numbers already posted in the general ledger.
18
00:01:36,400 --> 00:01:41,400
If the accounting records land in the wrong place, no report design can fix the meaning later without manual work.
19
00:01:41,400 --> 00:01:48,480
Now, main accounts also have types and an account type gives Dynamics 365 Finance a broad classification.
20
00:01:48,480 --> 00:01:54,540
Profit and loss accounts record revenue and expenses for a period, and their combined balance contributes to the year and result.
21
00:01:54,540 --> 00:02:00,540
Balance sheet accounts record what the company owns, what it owes, and the owner's interest, AO, assets, liabilities and equity.
22
00:02:00,540 --> 00:02:06,660
Cash is normally an asset, a bank loan is normally a liability, sales revenue belongs to profit and loss and rent belongs to expense.
23
00:02:06,660 --> 00:02:15,940
That may sound like basic accounting and it is, but it's also the first control point for reporting because the system needs to know whether an account belongs on an income statement or a balance sheet.
24
00:02:15,940 --> 00:02:23,300
There's also a special total account type which can add together a range of account balances or you might use this when you want a total across a defined interval,
25
00:02:23,300 --> 00:02:27,500
though many Finance teams build their statement totals directly in financial reporting.
26
00:02:27,500 --> 00:02:31,380
Account types stay broad and that's where main account categories come in "AO."
27
00:02:31,380 --> 00:02:34,980
They create a more useful reporting group inside that broad classification.
28
00:02:34,980 --> 00:02:41,420
For example, asset accounts can sit in categories like cash, fixed assets, accounts receivable or short term investments,
29
00:02:41,420 --> 00:02:46,220
while liability accounts might sit in accounts payable, tax payable or long term debt.
30
00:02:46,220 --> 00:02:47,320
The difference is simple.
31
00:02:47,320 --> 00:02:53,920
Account type tells you the general accounting class and main account category tells you the reporting group you want people to see.
32
00:02:53,920 --> 00:02:58,400
Imagine you have several bank accounts, a petty cash account and a cash clearing account, "O."
33
00:02:58,400 --> 00:03:02,500
Each can have its own main account because Finance needs that level of detail.
34
00:03:02,500 --> 00:03:08,300
Yet all of them can belong to the cash category, so a report can show one clean cash line when that's all the reader needs.
35
00:03:08,300 --> 00:03:12,020
That's why the default financial reports use main account categories "O."
36
00:03:12,020 --> 00:03:19,100
They need a familiar structure before they can show balances in sections like assets, liabilities, revenue or expenses.
37
00:03:19,100 --> 00:03:22,500
Clean setup pays off later because when main accounts follow clear rules,
38
00:03:22,500 --> 00:03:27,280
account types are correct and categories match the way your company reads its financial statements.
39
00:03:27,280 --> 00:03:29,500
Reporting becomes much easier.
40
00:03:29,500 --> 00:03:31,700
You start with data that already has a place.
41
00:03:31,700 --> 00:03:36,220
Accounts explain what happened financially, but leaders usually ask more than that "O."
42
00:03:36,220 --> 00:03:42,600
They also want to know where it happened, who spent the money and which part of the business produced the result.
43
00:03:42,600 --> 00:03:45,400
Financial dimensions, adding the questions.
44
00:03:45,400 --> 00:03:46,900
Leaders actually ask.
45
00:03:46,900 --> 00:03:50,880
A main account tells you what the money relates to "O" - simple enough.
46
00:03:50,880 --> 00:03:54,200
But financial dimensions add the business context around that amount.
47
00:03:54,200 --> 00:03:56,840
They answer the questions leaders ask when they see a total.
48
00:03:56,840 --> 00:03:57,960
Which department spent it?
49
00:03:57,960 --> 00:03:59,040
Which location earned it?
50
00:03:59,040 --> 00:03:59,960
Which business unit?
51
00:03:59,960 --> 00:04:01,240
Was it tied to a project?
52
00:04:01,240 --> 00:04:07,040
Let's look at rent expense. Your company might pay rent for a head office, a warehouse and several retail sites.
53
00:04:07,040 --> 00:04:10,440
If every payment posts to rent expense you see the total bill, that's useful,
54
00:04:10,440 --> 00:04:13,240
but it doesn't tell a regional manager what their side costs.
55
00:04:13,240 --> 00:04:15,040
A financial dimension fills in that gap.
56
00:04:15,040 --> 00:04:20,940
You could add department finance, sales or operations, or cost center, business unit, region or project.
57
00:04:20,940 --> 00:04:23,540
Those values sit with the accounting entry when it posts.
58
00:04:23,540 --> 00:04:26,740
So the account stays rent expense, but the entry tells a fuller story.
59
00:04:26,740 --> 00:04:29,040
One payment might read rent expense, head office.
60
00:04:29,040 --> 00:04:29,540
Another.
61
00:04:29,540 --> 00:04:32,840
Rent expense, warehouse. A third. Rent expense, retail north.
62
00:04:32,840 --> 00:04:34,840
Same account, different business meaning.
63
00:04:34,840 --> 00:04:40,440
That gives finance one consistent account structure while letting leaders view results through their part of the company.
64
00:04:40,440 --> 00:04:42,240
The sales director looks at sales.
65
00:04:42,240 --> 00:04:44,140
The warehouse manager looks at warehouse.
66
00:04:44,140 --> 00:04:46,340
Finance sees the total across everyone.
67
00:04:46,340 --> 00:04:48,440
This removes a common spreadsheet habit.
68
00:04:48,440 --> 00:04:53,140
Without dimensions, someone exports ledger balances and starts adding columns by hand.
69
00:04:53,140 --> 00:04:58,940
Sort filter copy numbers into a new workbook, then try to explain why the department total doesn't match the company total.
70
00:04:58,940 --> 00:05:02,940
With dimensions entered when the transaction posts that work starts from a better place.
71
00:05:02,940 --> 00:05:07,840
The detail already belongs to the accounting record, but it only works when values stay consistent.
72
00:05:07,840 --> 00:05:14,140
If one person selects north region, another selects north, and a third uses north zero one.
73
00:05:14,140 --> 00:05:17,240
The report splits what should be one balance into separate lines.
74
00:05:17,240 --> 00:05:22,040
Finance needs clear names, clear ownership, and rules about which values people can use.
75
00:05:22,040 --> 00:05:25,040
Dynamics 365 finance supports that through account rules.
76
00:05:25,040 --> 00:05:29,840
Depending on the account, the system can require a dimension or limit the values users can select.
77
00:05:29,840 --> 00:05:34,940
For example, an expense account may need a cost center, while a bank account may only need a business unit.
78
00:05:34,940 --> 00:05:37,440
You don't need the same detail for every account.
79
00:05:37,440 --> 00:05:38,540
Here's a simple rule.
80
00:05:38,540 --> 00:05:43,240
Use a financial dimension when you expect to reuse the value and report balances by it over time.
81
00:05:43,240 --> 00:05:44,240
Department is reusable.
82
00:05:44,240 --> 00:05:45,440
Cost center is reusable.
83
00:05:45,440 --> 00:05:46,940
Region is reusable.
84
00:05:46,940 --> 00:05:47,640
Project 2.
85
00:05:47,640 --> 00:05:51,840
If your finance team tracks balances and costs by project, invoice number is different.
86
00:05:51,840 --> 00:05:53,340
Purchase order number is different.
87
00:05:53,340 --> 00:05:57,740
Those values often belong to one transaction or one short-lived piece of work.
88
00:05:57,740 --> 00:06:02,740
Creating a financial dimension for every invoice number leaves you with thousands of unique values.
89
00:06:02,740 --> 00:06:04,140
Nobody wants on a statement.
90
00:06:04,140 --> 00:06:05,940
That's where financial tags fit better.
91
00:06:05,940 --> 00:06:13,140
A financial tag stores a flexible reference, "Oh", an invoice number, purchase order, payment reference, or external system ID.
92
00:06:13,140 --> 00:06:19,240
It sits on the accounting entry for detail and analysis, but doesn't carry the same structure role as a financial dimension.
93
00:06:19,240 --> 00:06:26,340
Financial dimensions take part in the account structure. The system checks whether the value is valid and finance can use it to summarize balances.
94
00:06:26,340 --> 00:06:27,840
Financial tags are lighter.
95
00:06:27,840 --> 00:06:31,840
They label a transaction without turning that label into a permanent reporting segment.
96
00:06:31,840 --> 00:06:35,640
So don't create a dimension called invoice number just to find invoices later.
97
00:06:35,640 --> 00:06:38,240
Use transaction details or financial tag for that.
98
00:06:38,240 --> 00:06:39,940
One more setup point worth knowing.
99
00:06:39,940 --> 00:06:44,140
Financial reporting can use the dimensions already in your system without extra reporting tools.
100
00:06:44,140 --> 00:06:52,340
On the financial reporting setup page, finance chooses which dimensions appear for, report design, and viewing and in what order that order matters more than it sounds.
101
00:06:52,340 --> 00:06:57,840
If your reports normally read main account department, cost center, project, people learn where to look.
102
00:06:57,840 --> 00:07:02,540
If the order changes from one report to another, reading details becomes slower and mistakes easier.
103
00:07:02,540 --> 00:07:08,040
Once each entry carries the right reusable labels, the ledger can answer more than "What did we spend?"
104
00:07:08,040 --> 00:07:10,940
It answers where, who, and which part of the business.
105
00:07:10,940 --> 00:07:17,840
And with that detail in place, Dynamics 365 Finance can turn those posted entries into a financial statement.
106
00:07:17,840 --> 00:07:19,740
What financial reporting actually is.
107
00:07:19,740 --> 00:07:24,740
So once your ledger entries include the right accounts and dimensions, what does financial reporting actually do with them?
108
00:07:24,740 --> 00:07:30,440
Financial reporting is the add-in in Dynamics 365 Finance for creating, maintaining and viewing financial statements.
109
00:07:30,440 --> 00:07:32,640
That sounds technical, so let's use plain English.
110
00:07:32,640 --> 00:07:40,740
It's the part of Dynamics 365 Finance that turns your general ledger balances into reports, AU, income statement, balance sheet, cash flow,
111
00:07:40,740 --> 00:07:43,140
trial balance or budget versus actual report.
112
00:07:43,140 --> 00:07:48,140
It isn't a new ledger, nobody posts an invoice into financial reporting or pays a supplier from it.
113
00:07:48,140 --> 00:07:53,340
The posting happens in Dynamics 365 Finance, and financial reporting reads the results afterward.
114
00:07:53,340 --> 00:07:55,540
It's also not just a dashboard with a few charts.
115
00:07:55,540 --> 00:07:57,740
A dashboard lets you scan a trend quickly.
116
00:07:57,740 --> 00:08:06,440
A financial statement gives a structured view, AU account groups, totals, reporting periods, comparisons, and the ability to inspect the detail behind a number.
117
00:08:06,440 --> 00:08:10,640
Think of it as the report room connected to the general ledger, the ledger records transactions.
118
00:08:10,640 --> 00:08:16,440
Financial reporting arranges them into the format, your finance team, managers, auditors, or board members need to read.
119
00:08:16,440 --> 00:08:21,340
Behind the scenes, financial reporting uses a financial data mark that refreshes from the general ledger.
120
00:08:21,340 --> 00:08:23,840
A data mark is a reporting copy of financial data.
121
00:08:23,840 --> 00:08:28,840
Arrange so reports can run without slowing down people entering invoices or posting journals.
122
00:08:28,840 --> 00:08:33,540
That separation helps AU Finance can review a statement while other users keep working.
123
00:08:33,540 --> 00:08:37,940
You don't need to export every balance into a spreadsheet just to create a clean, monthly report.
124
00:08:37,940 --> 00:08:42,440
Microsoft includes 22 default financial reports with Dynamics 365 Finance.
125
00:08:42,440 --> 00:08:52,140
You get an income statement, balance sheet, cash flow report, detailed trial balance, summary trial balance, rolling expense reports, and budget versus actual reports.
126
00:08:52,140 --> 00:08:57,240
Plus reports for weekly sales and discounts, all the details, ratios, or a balance sheet next to an income statement.
127
00:08:57,240 --> 00:09:00,040
But that doesn't mean everyone matches your company on day one.
128
00:09:00,040 --> 00:09:05,440
The report layout may look right, but your own main accounts and categories still need to map to the rows correctly.
129
00:09:05,440 --> 00:09:12,040
If your company calls an account group direct costs, while the default report expects cost of sales, someone needs to review that setup.
130
00:09:12,040 --> 00:09:13,640
Start with a default report anyway.
131
00:09:13,640 --> 00:09:20,140
It gives you a working example, a familiar structure, and a much faster starting point than building every report from an empty page.
132
00:09:20,140 --> 00:09:25,440
Open it, compare the balances with your ledger, check the account groupings, and adjust only what your business needs.
133
00:09:25,440 --> 00:09:30,040
Now Dynamics 365 Finance has several reporting tools, and this is where people often get mixed up.
134
00:09:30,040 --> 00:09:34,040
Financial reporting handles general ledger, out, based financial statements.
135
00:09:34,040 --> 00:09:45,340
SSRS, AU, SQL Server Reporting Services, AU, usually handles formatted business documents and detailed reports, like invoices, purchase orders, customer statements, or long transaction lists.
136
00:09:45,340 --> 00:09:48,340
It's built for pages that need a fixed layout.
137
00:09:48,340 --> 00:09:56,140
Electronic reporting handles files that need to go somewhere else, AU, bank files, tax submissions, XML files, CSV files, or other regulated formats.
138
00:09:56,140 --> 00:09:59,340
That tool focuses on sending or receiving structured data.
139
00:09:59,340 --> 00:10:01,240
Power BI handles interactive analysis.
140
00:10:01,240 --> 00:10:07,040
You use Power BI when you want charts, filters, trends, and management views that help people explore questions,
141
00:10:07,040 --> 00:10:09,240
which region has the fastest growing costs?
142
00:10:09,240 --> 00:10:12,740
How does actual spending compare with budget across several months?
143
00:10:12,740 --> 00:10:15,240
Financial reporting handles the formal statement.
144
00:10:15,240 --> 00:10:18,340
Power BI helps people investigate the pattern around it.
145
00:10:18,340 --> 00:10:22,340
Excel gives finance a familiar place to check numbers or do extra analysis,
146
00:10:22,340 --> 00:10:26,140
but it doesn't need to become the place where every financial statement starts from scratch.
147
00:10:26,140 --> 00:10:32,440
Each tool has a job, choose the right one, and reporting becomes less about rebuilding numbers and more about reading them.
148
00:10:32,440 --> 00:10:37,140
Building a report, rows, columns, and report definitions.
149
00:10:37,140 --> 00:10:39,040
Every financial statement starts with a shape.
150
00:10:39,040 --> 00:10:44,640
You have to decide what runs down the left side, what goes across the top, and how the report brings those two together.
151
00:10:44,640 --> 00:10:50,240
In Dynamics 365 Finance, we call those parts row definitions, column definitions, and report definitions.
152
00:10:50,240 --> 00:10:51,740
Letotim start with the rows.
153
00:10:51,740 --> 00:10:54,240
A row definition controls the left side of your statement.
154
00:10:54,240 --> 00:10:58,240
It tells the system which accounts account categories or dimension combinations to pull in.
155
00:10:58,240 --> 00:11:01,440
It also says what to call each line and where totals should appear.
156
00:11:01,440 --> 00:11:06,240
Think about a normal income statement, revenue at the top, cost of sales next, then gross margin,
157
00:11:06,240 --> 00:11:09,740
below that come operating expenses, and at the bottom, net result.
158
00:11:09,740 --> 00:11:11,940
Each of those lines needs its own instructions.
159
00:11:11,940 --> 00:11:16,040
Revenue might point to a group of sales accounts, while cost of sales points to cost accounts.
160
00:11:16,040 --> 00:11:20,040
Gross margin does no, ten point to any account at all, AO.
161
00:11:20,040 --> 00:11:23,340
It calculates a total by subtracting cost of sales from revenue.
162
00:11:23,340 --> 00:11:25,240
That utimst the job of a row definition.
163
00:11:25,240 --> 00:11:32,840
It tells financial reporting which posted balances belong on each line, and it tells the report how to add or subtract those lines when you need a calculated total.
164
00:11:32,840 --> 00:11:38,040
You can build a row around individual main accounts, a range of accounts, or a main account category.
165
00:11:38,040 --> 00:11:43,840
Categories save a lot of setup work. For example, a balance sheet normally separates assets, liabilities, and equity.
166
00:11:43,840 --> 00:11:48,140
Within assets, you might show cash, accounts receivable, fixed assets, and inventory.
167
00:11:48,140 --> 00:11:55,440
If those accounts already sit in the right main account categories, the default balance sheet rows can use those groups without listing every account one by one.
168
00:11:55,440 --> 00:11:56,940
That gives you a cleaner design.
169
00:11:56,940 --> 00:12:03,940
Finance still keeps separate accounts for separate balances, but the reader sees only the level of detail that makes sense for a formal statement.
170
00:12:03,940 --> 00:12:05,940
If they need more detail, they can look deeper.
171
00:12:05,940 --> 00:12:09,340
The statement itself does not need to become a phone book of account numbers.
172
00:12:09,340 --> 00:12:11,840
Rows answer one question. What are we reporting?
173
00:12:11,840 --> 00:12:14,540
Columns answer another. How do we want to view it?
174
00:12:14,540 --> 00:12:18,040
A column definition controls the information that runs across the page.
175
00:12:18,040 --> 00:12:26,340
You might show the current month, year-to-date results, last year our TM chatets, year-to-date results, budget, actuals, or the difference between actual and budget.
176
00:12:26,340 --> 00:12:29,540
A simple income statement could start with a description column.
177
00:12:29,540 --> 00:12:35,540
Next you might show actual for the current period, then year-to-date, then budget, then variance.
178
00:12:35,540 --> 00:12:38,740
That variance column calculates the difference automatically, so managers don't know,
179
00:12:38,740 --> 00:12:42,740
could temity, need to open Excel and create another formula after the report runs.
180
00:12:42,740 --> 00:12:50,540
You can also place periods side-by-side, A/O, maybe January through December, maybe this quarter beside the same quarter last year, maybe actual results beside a forecast.
181
00:12:50,540 --> 00:12:53,540
The rows decide the subjects and the columns decide the view.
182
00:12:53,540 --> 00:12:56,740
Put those two pieces together and you have most of a financial statement.
183
00:12:56,740 --> 00:13:02,740
But the system still needs a place where you name the report until Dynamics 365 Finance, which row and column definitions belong together.
184
00:13:02,740 --> 00:13:04,740
That outmits the report definition.
185
00:13:04,740 --> 00:13:08,740
A report definition combines the rows and columns into something people can generate.
186
00:13:08,740 --> 00:13:11,940
It also controls settings like rounding and how negative amounts appear.
187
00:13:11,940 --> 00:13:14,340
Here outtm is a concrete example.
188
00:13:14,340 --> 00:13:20,740
You might create a row definition called income statement rows, then a column definition called monthly actual budget and variance.
189
00:13:20,740 --> 00:13:26,740
The report definition connects them and gives the finished report, a name "IU", maybe monthly management income statement.
190
00:13:26,740 --> 00:13:29,940
That separation is useful because you can reuse the parts.
191
00:13:29,940 --> 00:13:37,940
One row definition for an income statement might work with a monthly column layout, a year-to-date layout and a prior year comparison layout.
192
00:13:37,940 --> 00:13:42,740
You do not need to rebuild the same revenue and expense structure every time somebody asks a new question.
193
00:13:42,740 --> 00:13:47,940
Now, some companies need one report for one company. Others need a report that follows a larger company structure.
194
00:13:47,940 --> 00:13:50,340
That outmits where a reporting tree comes in.
195
00:13:50,340 --> 00:13:53,940
A reporting tree lets you organize financial results into reporting units.
196
00:13:53,940 --> 00:13:59,540
Those units can represent legal entities, regions, departments, business units or another part of the company structure.
197
00:13:59,540 --> 00:14:01,540
Imagine a group with three subsidiaries.
198
00:14:01,540 --> 00:14:05,540
The parent company wants to see each subsidiary on its own, then one combined total for the group.
199
00:14:05,540 --> 00:14:11,540
A reporting tree can describe that structure "A,U", each subsidiary has a reporting unit and the group total above them.
200
00:14:11,540 --> 00:14:17,540
The same approach works for regions. You might show north, south and west as separate units, then include a total for the whole company.
201
00:14:17,540 --> 00:14:23,540
Or a department leader might only need to see their own unit, while the finance team needs the full view.
202
00:14:23,540 --> 00:14:29,140
One report definition can connect to one reporting tree at a time, so choose the structure that matches the question the report needs to answer.
203
00:14:29,140 --> 00:14:35,140
For people new to this, report designer includes a wizard that helps you start building these parts without facing every option at once.
204
00:14:35,140 --> 00:14:39,140
You choose the report type, work through the basic choices and create a starting design.
205
00:14:39,140 --> 00:14:47,140
As your finance team becomes more comfortable, they can edit the row definitions, column definitions, report definitions and reporting trees directly.
206
00:14:47,140 --> 00:14:51,140
That gives them more control over calculations, layout, grouping and the way dimensions appear.
207
00:14:51,140 --> 00:14:55,140
The goal is now attempt to build the most complicated report possible.
208
00:14:55,140 --> 00:15:03,140
It outmodes to build a report where every line answers a real business question, every column makes the comparison clear and the numbers match the ledger.
209
00:15:03,140 --> 00:15:05,140
Running, reading and maintaining reports.
210
00:15:05,140 --> 00:15:10,140
A report only becomes useful when people can read it, question it and trust what they see.
211
00:15:10,140 --> 00:15:15,140
After you generate a financial report, you are now to be logged into one static page.
212
00:15:15,140 --> 00:15:22,140
You can change the report date, choose a currency, switch between summary and detail and apply filters for financial dimensions or attributes.
213
00:15:22,140 --> 00:15:26,140
That means the same report can answer different questions without someone copying it into a new workbook.
214
00:15:26,140 --> 00:15:30,140
A finance manager might start with the full company income statement for the current month.
215
00:15:30,140 --> 00:15:36,140
Then they can filter it to one business unit, view it in a different currency or change the date to compare another period.
216
00:15:36,140 --> 00:15:40,140
The report design stays in place. The view changes for the question at hand. Two views matter here.
217
00:15:40,140 --> 00:15:46,140
Summary view gives you the higher level financial story out total revenue, total costs, net result.
218
00:15:46,140 --> 00:15:50,140
Detail view gives you more lines to inspect when a total does not to match look right.
219
00:15:50,140 --> 00:15:54,140
And that brings us to drill down. Imagine an operating expense line looks much higher than budget.
220
00:15:54,140 --> 00:15:58,140
Instead of sending an email, exporting a ledger list and trying to match account numbers manually,
221
00:15:58,140 --> 00:16:04,140
you can drill into that amount from the report. You can follow the balance into the transactions behind it.
222
00:16:04,140 --> 00:16:08,140
That lets you see the journal entries, dates, vouchers and other details that created the number.
223
00:16:08,140 --> 00:16:12,140
The report becomes a starting point for a conversation, not the final answer printed on a page.
224
00:16:12,140 --> 00:16:17,140
This is especially helpful during month and someone asks, "Oh, why did warehouse costs rise?
225
00:16:17,140 --> 00:16:21,140
How you start with the warehouse view, find the expense line, drill into the transactions
226
00:16:21,140 --> 00:16:25,140
and see whether the increase came from rent, repairs, staffing or a one-time charge."
227
00:16:25,140 --> 00:16:30,140
Finance spends less time searching for the source and more time explaining the result.
228
00:16:30,140 --> 00:16:36,140
Reports can also run on a schedule. A team might generate reports daily, weekly, monthly or annually depending on the job.
229
00:16:36,140 --> 00:16:43,140
Monthly management packs are the obvious example, but schedules can also help teams prepare regular budget reviews or recurring group reports.
230
00:16:43,140 --> 00:16:51,140
For companies with several legal entities, financial reporting can support reports across those entities and can convert currencies for reporting needs.
231
00:16:51,140 --> 00:16:58,140
A group finance team may need each company in its local currency, but leadership may need one view in a reporting currency.
232
00:16:58,140 --> 00:17:04,140
The structure needs careful setup, but the reader does not make it, need to rebuild the report from separate files every month.
233
00:17:04,140 --> 00:17:07,140
Here are Temmers, one maintenance detail worth remembering.
234
00:17:07,140 --> 00:17:11,140
Newly generated reports receive an expiration date of 90 days by default.
235
00:17:11,140 --> 00:17:16,140
Users with the right security permissions can change that period, including setting a report never to expire.
236
00:17:16,140 --> 00:17:19,140
The person who generates a report can delete their own report.
237
00:17:19,140 --> 00:17:25,140
Users with the financial reporting security duty can delete reports created by other users and manage report expiration settings.
238
00:17:25,140 --> 00:17:30,140
That protects the report list from becoming a long archive of old runs nobody can identify.
239
00:17:30,140 --> 00:17:35,140
But be careful with all the reports too. Starting with financial reporting released 10.0.
240
00:17:35,140 --> 00:17:42,140
45. When you rerun a saved report or drill into its detail, Dynamics 365 Finance uses the current transaction data.
241
00:17:42,140 --> 00:17:48,140
If someone edited an underlying transaction after the report first ran, the drill down detail can differ from what you saw originally.
242
00:17:48,140 --> 00:17:53,140
The saved top level balances don't now tim t change, but the supporting detail can.
243
00:17:53,140 --> 00:18:04,140
So if Finance needs an unchangeable audit copy for a closed period, export the finalized report to Excel or PDF and keep that file under your normal records process, one final warning about the ad in itself.
244
00:18:04,140 --> 00:18:13,140
If someone uninstalls the financial reporting ad in, Dynamics 365 Finance permanently deletes previously created reports, report designs and configurations.
245
00:18:13,140 --> 00:18:20,140
Microsoft does no TMT support recovery for that action. Treat it like removing a shared Finance workspace, not like deleting an app from your phone.
246
00:18:20,140 --> 00:18:24,140
Formal statements help Finance explain the numbers in a controlled format.
247
00:18:24,140 --> 00:18:28,140
For faster visual scanning and trend questions, another tool fits alongside them.
248
00:18:28,140 --> 00:18:30,140
Wear Power BI and Excel fit.
249
00:18:30,140 --> 00:18:36,140
So where do Power BI and Excel actually fit? Financial reporting handles your formal statements, the ones auditors need.
250
00:18:36,140 --> 00:18:39,140
Power BI takes care of charts, trends and interactive management views.
251
00:18:39,140 --> 00:18:44,140
Revenue by region, budget versus actual. Excel still has its place too.
252
00:18:44,140 --> 00:18:49,140
Your team uses it for checks, calculations and sharing numbers in a format everyone already knows.
253
00:18:49,140 --> 00:18:55,140
The financial analysis workspace includes Power BI content for common views, but keep each dashboard focused on one question.
254
00:18:55,140 --> 00:19:02,140
Don't cram everything onto the same screen, the best part, all these tools read from the same Finance records, everything works together.
255
00:19:02,140 --> 00:19:06,140
Closing. Build the ledger first.
256
00:19:06,140 --> 00:19:12,140
A clear report doesn't start with the layout. It starts much earlier, clean main accounts, reusable dimensions.
257
00:19:12,140 --> 00:19:20,140
Without that foundation, nothing else matters. Start with a default report, test it against your real balances, then change only what your company needs.
258
00:19:20,140 --> 00:19:30,140
Subscribe for more Microsoft knowledge nuggets from Mirko Peters at M365 FM and share this with someone who still thinks Dynamics 365 Finance reporting begins and ends with Excel.




