Teams Analytics Explained: A Clear Guide for Microsoft Teams

Microsoft Teams analytics gives organizations a window into how people communicate, share files, and work together in the digital workspace. Using built-in dashboards and advanced tools, you can track everything from messaging patterns to system reliability, helping teams stay connected and efficient.
This guide breaks down what Teams analytics can do, why it matters, and how to use it—whether you’re new to Microsoft Teams or looking to get more value from your existing data. We'll cover essentials like report access, collaboration improvement, system monitoring, and even how analytics connects to business results and workplace well-being. By the end, you’ll see how tracking the right data turns Teams from just another app into a tool for real collaboration and growth.
Understanding Microsoft Teams Analytics and Its Importance
Before you start diving into charts and dashboards, it helps to know what Teams analytics really brings to the table. Microsoft Teams sits at the center of modern digital collaboration, connecting your team’s communication, meetings, and business processes all in one place. With this level of daily use, having analytics built right into the system allows organizations to tap into valuable information hiding in everyday activity.
Teams analytics isn’t just about stats for the sake of stats. It’s designed to help companies improve teamwork, spot trends in communication, and ensure that the tools are actually making people more productive—not just busier. These insights play a big part in strategies for growth, resource planning, and employee engagement.
The data collected and presented by Teams analytics can reveal bottlenecks, highlight top collaborators, uncover knowledge silos, or even catch burnout signs before they become real problems. Modern organizations need these kinds of signals, not just to stay compliant and efficient, but to build a work environment where everyone is clear, connected, and contributing. That’s what makes Teams analytics so critical—it’s the feedback loop that keeps collaboration healthy and on track, benefiting everyone from frontline workers to the leadership team.
How Analytics Teams Microsoft Improves Collaboration
Analytics in Microsoft Teams acts like a spotlight on how your team actually works together day to day. By looking at data like chat frequency, file sharing, and meeting attendance, you get a real-world sense of who’s connecting, who may need help, and which conversations actually move work forward.
This knowledge means you can clean up confusion, tackle information overload, and support better teamwork. When paired with strong governance practices—like those detailed in this guide on confident collaboration—analytics help transform random activity into organized, productive habits. Ultimately, transparency about collaboration patterns puts your whole organization on the same page, fostering trust and continuous improvement across teams.
Where to Find Microsoft 365 and Teams Usage Reports
Every organization using Microsoft Teams produces a stream of activity data, but it all means nothing if you can’t find and understand the reports. Microsoft 365 makes it straightforward for IT admins and business leaders to access dashboards showing usage, devices, and even phone call performance across Teams.
The built-in reporting options aren’t buried in menus—they’re right in the Microsoft 365 admin center, giving you a clear dashboard to spot trends, troubleshoot issues, and confirm Teams is being used as intended. Whether you’re interested in login stats, device breakdowns, or advanced phone system analytics, these reports make sure you’re never left guessing about what’s really going on in your digital workspace.
Coming up, you’ll discover how to log in, adjust permissions for analytics access, and dig deep into specialized reports, like those for telephony (PSTN) performance. It’s about getting the insights you need—securely and efficiently—so your organization can keep moving forward with confidence.
Access Microsoft 365 Login and Usage Dashboards
- Sign in to the Microsoft 365 Admin Center: Use your admin credentials at the Microsoft 365 portal to access management and reporting tools.
- Locate the Teams Usage Dashboard: Navigate to the Usage Reports section under Reports to find Teams analytics, including user activity and device data.
- Set Permissions: Make sure proper role-based access is assigned so only authorized users can view sensitive analytics details.
- Customize Views: Filter and adjust report parameters to focus on data relevant to specific teams, departments, or time frames.
Teams Usage PSTN and Calling Analytics
- Calling Metrics Overview: Access detailed data on outbound and inbound call volume, tracking how often Teams is used for phone calls (PSTN).
- Monitor Call Duration and Quality: Review average call lengths and quality ratings to understand communication efficiency and flag technical issues.
- Missed and Blocked Calls: Identify trends in missed calls or calls blocked by the system, helping to troubleshoot connectivity or user experience problems.
- Impact on Customer Service: Use analytics to ensure your call-handling processes are effective and to proactively address service gaps or dropped connections.
Key Capabilities for Monitoring Teams Messaging and Collaboration
At the core of Teams analytics sits a rich set of tools for tracking how people message, collaborate, and share knowledge. Instead of working in the dark, organizations can use these features to watch communication trends play out in real time and make smarter decisions about team dynamics.
Beyond the basics, Teams analytics digs into things like chat frequency and group interaction, revealing both the power users and the places where knowledge might be getting stuck. It’s also a great way to catch issues early—whether that’s a dip in engagement, a silo forming, or a phone system hiccup causing dropped connections.
Coming up, we’ll look closer at how you can use Teams analytics to monitor chat patterns, map out collaboration networks, and keep your phone system humming. Each area offers unique insights, helping organizations move from guesswork to targeted action for better teamwork and more robust digital communications.
Monitor Messaging Collaboration and Chat Interaction
- Review Chat Volume Trends: Analyze historical chat data to spot peaks and lulls in communication, helping you understand busy and quiet times across your teams.
- Map Interaction Networks: Identify who’s connecting with whom to reveal core collaboration networks versus those who may be less engaged or isolated.
- Evaluate Response Times: Measure how quickly team members respond to each other in chats, which can signal healthy engagement or reveal workflow bottlenecks.
- Flag Knowledge Silos: Use analytics to catch when small groups communicate only among themselves, highlighting potential risks for information hoarding or breakdowns in teamwork.
- Spot Emerging Leaders: Recognize team members who consistently drive conversations, helping managers nurture informal leadership and support professional growth.
Teams Usage PSTN Blocked and Phone System Performance
- Blocked PSTN Calls: Identify the number and causes of blocked phone system calls to quickly address technical or policy issues.
- Call Success Rates: Monitor successful versus failed calls to maintain reliable business communications and minimize downtime.
- Performance Troubleshooting: Use analytics to trace call failures back to user errors, network problems, or device incompatibilities, making it easier for admins to resolve issues fast.
Enhancing Team Collaboration and Employee Well-Being with Analytics
Microsoft Teams analytics isn’t just about boosting numbers or squeezing more output from your people—it’s also about building a supportive, responsive digital workplace. By turning a lens on engagement, sentiment, and communication patterns, organizations get a clearer picture of both productivity and well-being.
When teams are working well together, you see it in the data—active channels, balanced workloads, and positive sentiment. On the flipside, dips in engagement or changes in messaging tone can be early warnings for burnout or stress. Teams analytics, when used thoughtfully, becomes a tool not just for business efficiency but for taking care of your people and culture.
In the following sections, you’ll learn how to harness these analytics to boost project success, foster healthy dynamics, and flag well-being concerns early—keeping your workplace running like a finely tuned engine, but with a human touch.
Messaging Insights to Boost Productivity and Team Dynamics
- Identify High-Performing Patterns: Analyze messaging trends to pinpoint practices—like frequent status updates—that are linked to successful projects and stronger results.
- Reduce Over-Communication: Spot overload in channels or group chats, then balance message volume for clearer, more purposeful collaboration.
- Unlock Productivity with Copilot: Leverage tools and best practices from resources like this guide on Microsoft Copilot, which shows how integrating automation and prompt engineering can lift productivity and streamline complex work.
- Streamline Project Management: Use integrated analytics alongside project management tips from this practical Teams guide to centralize information and keep teams moving efficiently.
Analyzing Sentiment and Individual Communication Well-Being
- Assess Engagement Levels: Track participation and response patterns to reveal who’s staying active and who may be disengaged or at risk of burnout.
- Conduct Sentiment Analysis: Examine chat sentiment scores for signals of stress, frustration, or positivity—useful for managers and HR in shaping support strategies.
- Spot Behavioral Changes: Catch sudden drops in messaging or shifts in communication tone that could point to personal or team challenges, opening the door to timely interventions.
- Support Employee Well-Being: Use insights to offer support or check-ins for employees showing early signs of overload or fatigue, creating a healthier workplace culture.
Analytics 365 for Microsoft Teams: Implementation and Setup
While Microsoft Teams comes with robust analytics out of the box, some organizations need even deeper insights, broader visualization, or more tailored reporting. That’s where tools like Analytics 365 step in, taking your Teams data to the next level without giving you a reporting headache.
Analytics 365 is an add-on solution that enhances what you can see and do with Teams analytics. It transforms raw platform data into visual dashboards, advanced metrics, and actionable signals, turning everyday usage into a goldmine of operational and strategic intelligence. With Analytics 365, you’re not just looking at rows of numbers—you’re gaining stories about teamwork, engagement, and business outcomes.
The next sections outline what makes Analytics 365 different and provide clear, actionable steps for accessing and configuring your setup. Whether you’re an admin, a business leader, or anybody in between, this will help get you up, running, and seeing results that matter.
How Analytics 365 Transform Microsoft Teams Data
Analytics 365 takes the standard Teams data and turns it into clear, actionable business intelligence. With its advanced dashboards and visualizations, you get a fast, accurate read on everything from collaboration bottlenecks to productivity spikes—all without needing a PhD in data science.
This tool expands reporting beyond native Microsoft views. You can track custom KPIs, benchmark teams, and visualize trends that help with decision-making—whether it’s process optimization, resource allocation, or measuring business impact. In short: Analytics 365 lets you tell the whole story, not just the numbers on the surface.
Step 2 and Step 3: Access Microsoft 365 and Configure Analytics 365
- Log in to Microsoft 365: Start by signing into your 365 admin dashboard with appropriate permissions to access analytics settings and integrations.
- Grant Analytics 365 Permissions: Assign necessary app permissions to Analytics 365 so it can securely integrate with your Teams environment and access data streams.
- Configure Reporting Views: Set up dashboards and reports according to your organizational needs—choose what to display, filter by department, and select relevant KPIs.
- Ensure Secure Access Controls: Double-check role-based security so only authorized users can see sensitive analytics details, keeping both compliance and confidentiality locked down.
Governance, Privacy, and Licensing for Teams Analytics
Diving into analytics is more than just running reports—it’s about doing it right. Organizations need to know who has access to these insights, how privacy is protected for employees, and which licenses and permissions are needed to stay compliant (and avoid awkward legal headaches).
Teams analytics offers detailed data, but not everyone in your organization gets to see everything. Access controls are tightly managed, role-based, and often depend on specific licenses designed for accountability and compliance. Plus, employers need to walk a careful line between monitoring for productivity and respecting staff privacy.
For organizations navigating digital workspaces, strong governance isn’t optional. It’s worth looking at resources like this Teams governance best practices guide for more on how to create clear boundaries and confident workflows. Up next, we’ll unpack what activity employers can track, the privacy rules in play, and what licenses you need for all these reports.
Can Employers Track Microsoft Teams Activity and Privacy Impact
Yes, employers can see Teams activity data like message counts, call logs, and meeting duration, but not the actual contents of private conversations. The goal is to monitor usage trends, not snoop. Microsoft enforces privacy laws and grants visibility only to authorized admins.
Employee data is protected by strict privacy and compliance controls, documented thoroughly in resources like this Microsoft Copilot privacy overview. Organizations must operate inside legal and ethical boundaries, always prioritizing trust, transparency, and compliance with regulations like GDPR.
Teams Protection License and Access Microsoft 365 Reporting
- Required Licenses: Accessing advanced Teams analytics often requires Microsoft 365 E3/E5 or dedicated Teams protection licenses, ensuring only approved users can view sensitive reports.
- Role-Based Access: Admins set up reporting permissions so only roles like IT, Compliance, or Data Officers can see analytics dashboards.
- Compliance Considerations: Verify appropriate licensing and access before rolling out analytics features to maintain security and meet regulatory standards, as highlighted in Copilot licensing tips.
- Security Controls: Audit access rights regularly to avoid accidental overexposure of analytics data and ensure your information protection strategy is actually working as intended.
Measuring Business Impact and ROI from Teams Analytics
Getting the numbers is one thing; showing they move the needle for the business is another. The real power of Teams analytics lies in its ability to connect collaboration data to hard outcomes—like cost savings, improved productivity, and stronger employee retention.
When you measure usage patterns, meeting loads, and messaging frequency, you put real evidence behind decisions about digital tools, process changes, and future technology investments. These insights can shape executive decisions, guide IT funding, or help managers optimize resources for the teams that need it most.
In the sections ahead, we’ll explore methods for connecting the dots between Teams usage data and productivity, as well as how to actually calculate ROI for your collaboration tools. Drawing from research and practical experience—as highlighted in resources like this Copilot efficiency deep dive and Copilot ROI case study—you’ll learn to turn analytics into a persuasive business case that leaders can’t ignore.
Linking Teams Usage Data to Productivity Metrics
- Correlate Messaging and Output: Compare chat frequency, meeting length, and file activity to project completion rates for real productivity insights.
- Monitor Departmental Trends: Use analytics to spot which teams outperform peers, then apply those best practices organization-wide.
- Establish Performance Benchmarks: Set internal standards for healthy collaboration and measure actual teams against these KPIs to ensure continuous improvement.
- Operationalize Insights: Use frequent, real-time usage reporting to inform quarterly reviews, resource allocation, and agile strategic pivots.
Calculating ROI of Collaboration Tools Using Teams Analytics
- Track Cost Savings: Measure reduction in travel, meeting overhead, or third-party tools after Teams adoption as part of your ROI story.
- Quantify Productivity Gains: Tie time savings, increased project throughput, or better customer response times directly to analytics data.
- Justify Investments: Build business cases for technology upgrades with clear figures from Teams dashboards and usage trends.
- Monitor Adoption and Retention: Watch uptake and stickiness across departments using analytics, then relate these trends to reduced turnover or higher staff satisfaction.

Founder of M365 Show, M365con.net & m365.fm
Mirko Peters is a Microsoft 365 expert, content creator, and founder of m365.fm, a platform dedicated to sharing practical insights on modern workplace technologies. His work focuses on Microsoft 365 governance, security, collaboration, and real-world implementation strategies.
Through his podcast and written content, Mirko provides hands-on guidance for IT professionals, architects, and business leaders navigating the complexities of Microsoft 365. He is known for translating complex topics into clear, actionable advice, often highlighting common mistakes and overlooked risks in real-world environments.
With a strong emphasis on community contribution and knowledge sharing, Mirko is actively building a platform that connects experts, shares experiences, and helps organizations get the most out of their Microsoft 365 investments.
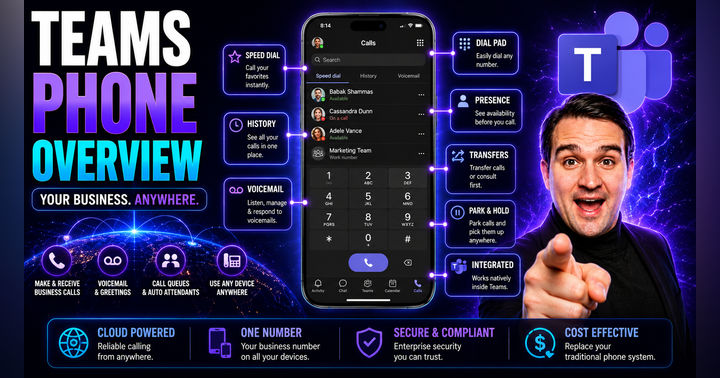
Microsoft Teams Phone Overview: Transforming Communication for Modern Businesses