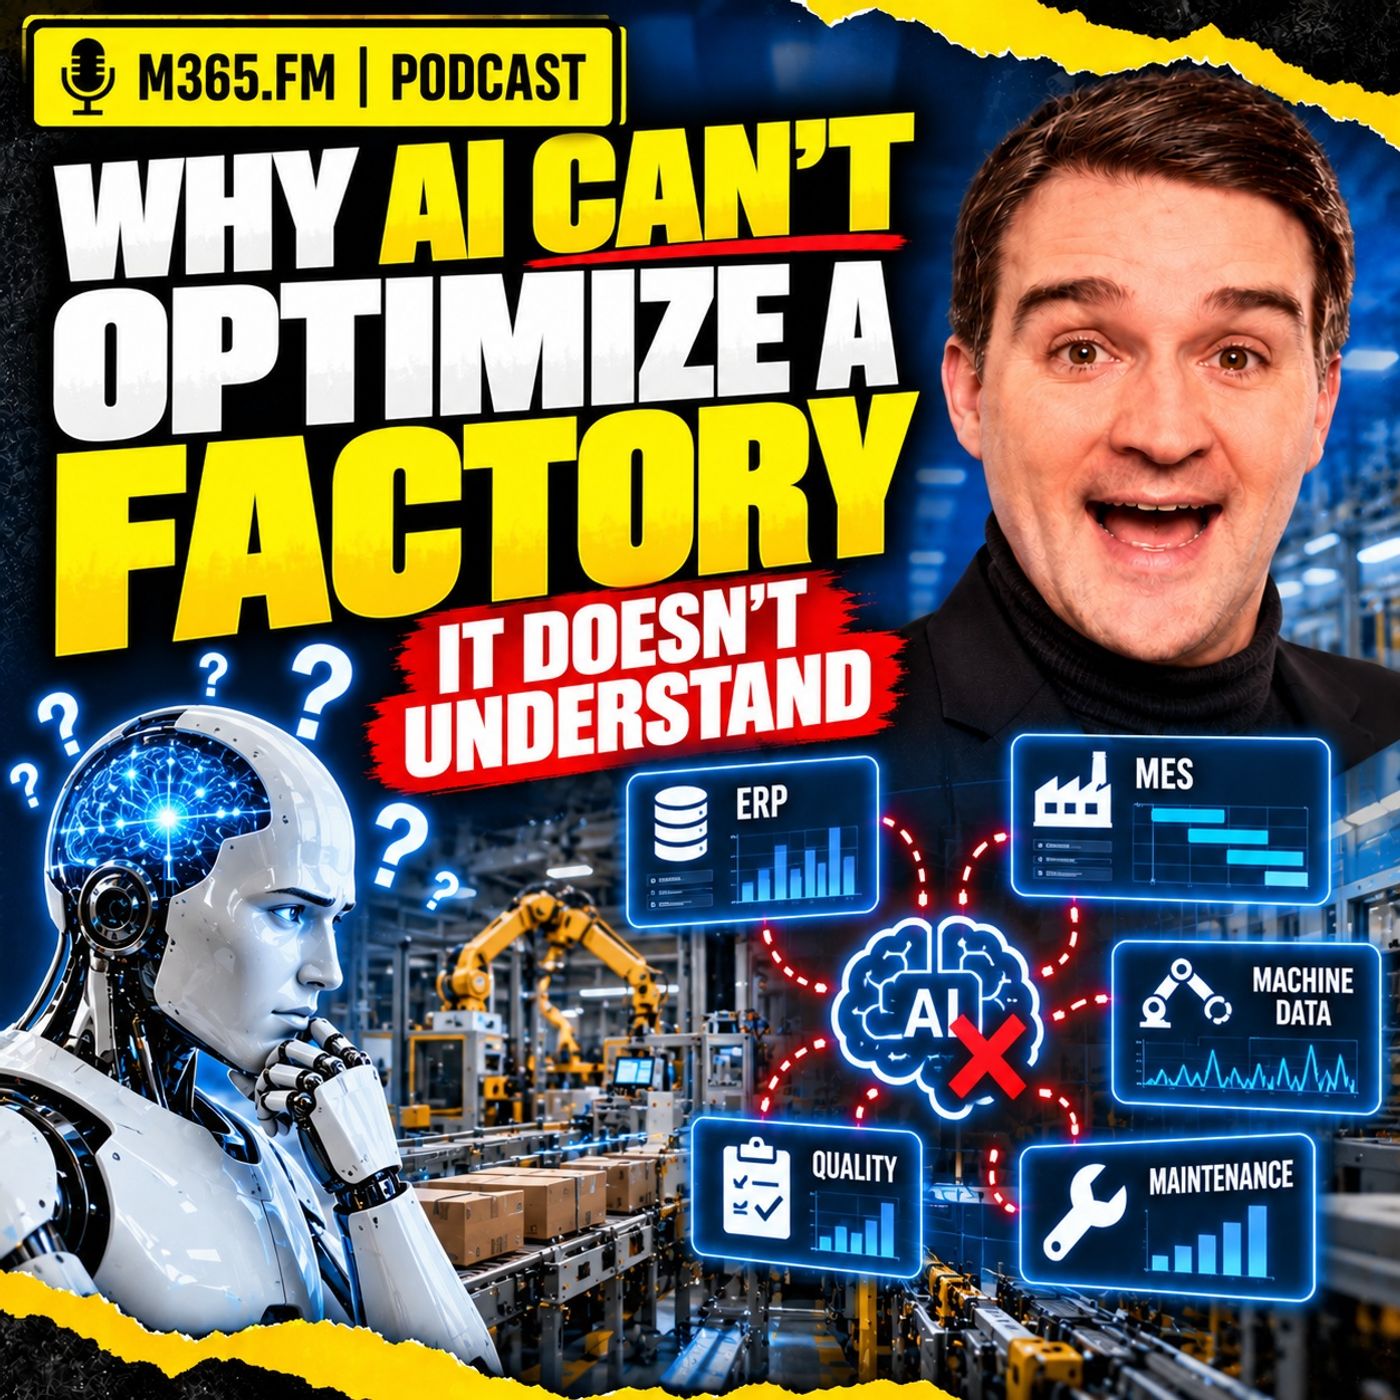
Why Power BI Dashboards Cannot Drive Automated Factory Decisions
Discover why traditional Power BI dashboards and operational reports fall short when transitioning from visual visibility to automated factory decision-making. While operational cockpits excel at showing downtime and scrap rates, they lack the embedded semantic rules required to safely authorize real-time production rerouting without human intervention.
Key Takeaways
- Dashboards excel at showing what changed, but struggle with deciding what production should do next.
- Visual alerts often require hidden human knowledge, such as tool availability and operator certifications, to become actionable.
- Power BI reports can accidentally become overburdened with complex special-case calculation chains.
- A clean visualization table still cannot define what terms like 'available' or 'capacity' mean contextually.
- Explicit production rules and semantic models must bridge the gap between reporting and automated scheduling.
The Limits of Operational Visibility
Manufacturing data analytics has achieved remarkable feats over the past decade. Modern cloud data platforms ingest millions of telemetry signals from programmable logic controllers (PLCs), enterprise resource planning (ERP) systems, and manufacturing execution systems (MES). Platforms like Microsoft Fabric and Azure make it easier than ever to aggregate this information into polished, comprehensive Power BI dashboards. Plant managers can track Overall Equipment Effectiveness (OEE), monitor cycle times, and view scrap rates across multiple facilities in real time.
However, a dangerous misconception persists among technical decision-makers: the belief that a visible problem is the same as a solved problem. When a machine unexpectedly drops offline, a dashboard can instantly flash red, highlighting a growing queue and projecting late orders. This is valuable reporting, but it represents only the beginning of the operational challenge. Showing that a machine is down does not automatically calculate which customer orders are commercially at risk, nor does it determine whether an alternate work center is truly cleared to take over the workload.
Reporting Versus Execution: The Core Distinction
To understand why visualization tools cannot run a factory, we must separate reporting questions from execution questions. Reporting asks retrospective and descriptive questions: What changed? Where is the queue building? Which work center lost time during the morning shift? These questions form the bedrock of daily operational reviews and give cross-functional teams a shared baseline of facts.
The Complexity of 'What Moves Next'
The moment a stakeholder asks an operational reporting tool what production should move next, the fundamental nature of the task changes. Answering this requires a dynamic list of allowed actions, complex validation against safety and quality rules, and accurate predictions of downstream consequences. A dashboard might indicate that Machine B is currently idle. It cannot inherently know whether Machine B is configured for the correct product revision, whether its required fixture is already locked to another job, or whether quality control mandates a formal recertification before the routing can change.
When reports are forced to handle these complex scenarios, developers often resort to writing long, convoluted chains of conditional calculations inside data models. As special cases accumulate, the dashboard transforms into an unwieldy artifact that no longer serves its primary purpose of clear visualization.
Why Excel Still Survives in Modern Plants
Many digital transformation initiatives aim to eradicate spreadsheets from the shop floor, yet Microsoft Excel stubbornly persists in manufacturing environments. Planners frequently export clean, automated dashboard data back into spreadsheets to test alternative scenarios. This behavior is rarely a sign of user resistance to modern cloud technology; rather, it highlights a structural gap in the software ecosystem.
Spreadsheets survive because they provide a flexible scratchpad where human planners can manually stitch together disconnected operational realities. A planner can combine ERP delivery commitments, MES queue data, maintenance repair schedules, and tribal knowledge about operator availability into a single worksheet. Until enterprise reporting and business intelligence solutions incorporate semantic decision rules, planners will continue relying on spreadsheets to test what-if scenarios that dashboards simply cannot process.
Building a True Decision Framework
Moving beyond the limits of dashboards requires a shift in architectural thinking. Dashboards should remain focused on their core competency: providing trusted, transparent visibility into plant performance. When decision automation is required, organizations must layer explicit semantic models, optimization engines, and deterministic rule verifiers on top of their data layers.
By establishing clear relationships between products, processes, and resources, factories can empower both human planners and AI assistants with actionable context. To explore how contextual data architectures unlock true automation, be sure to Listen to the full episode. Tune in to gain deeper insights into bridging the gap between raw manufacturing data and intelligent operational execution.
Frequently Asked Questions
Why can't dashboards automate production decisions?
Dashboards are designed for reporting and visualization. They show what has happened or is happening, but they lack the embedded semantic rules, constraint validation, and relationship modeling required to determine safe, executable production alternatives.
What is the difference between reporting and execution in manufacturing?
Reporting identifies operational symptoms, such as downtime, scrap, and bottlenecks. Execution involves deciding what actions to take next while respecting hard constraints like operator certifications, tooling availability, and quality compliance.
Why do planners still export dashboard data to Excel?
Planners export data because modern reports often lack the ability to simulate alternative production routes or factor in local tribal knowledge and unrecorded shop-floor constraints required for day-to-day scheduling.
How can manufacturers bridge the gap between visualization and action?
Manufacturers can bridge this gap by implementing semantic data layers and knowledge graphs that explicitly map the relationships between products, processes, and resources, rather than relying solely on flat relational tables.