


 Apple Podcasts
 Spotify
 Youtube Music
 Spreaker
 Podchaser
 Amazon Music
 Microsoft Fabric Real-Time Intelligence - Simply Explained
Quick Answer: Microsoft Fabric Real-Time Intelligence is an important Microsoft topic for teams that need clearer technical decisions, safer implementation, and practical operational value. This episode explains what it does, where it fits in the Microsoft ecosystem, and the key considerations for administrators, architects, and business stakeholders.
Real-time intelligence, particularly through Microsoft Fabric Real-Time Intelligence - Simply Explained, revolutionizes project management by providing immediate insights and data-driven decision-making. You can leverage this technology to enhance project outcomes significantly. For instance, a report from the World Economic Forum and Accenture highlights that AI improves productivity and efficiency across various industries. This boost leads to proactive risk management, allowing you to detect potential delays and make informed adjustments.
As shown in the table below, the adoption of AI technologies in project management is on the rise:
| Statistic | Value |
|---|---|
| Percentage of project professionals impacted by AI technologies | 81% |
| Current AI usage in organizations (2025) | 70% |
| AI usage in organizations (2023) | 36% |
| Project professionals planning to adopt AI | 29% |
| Project professionals using AI more frequently than anticipated | 82% |
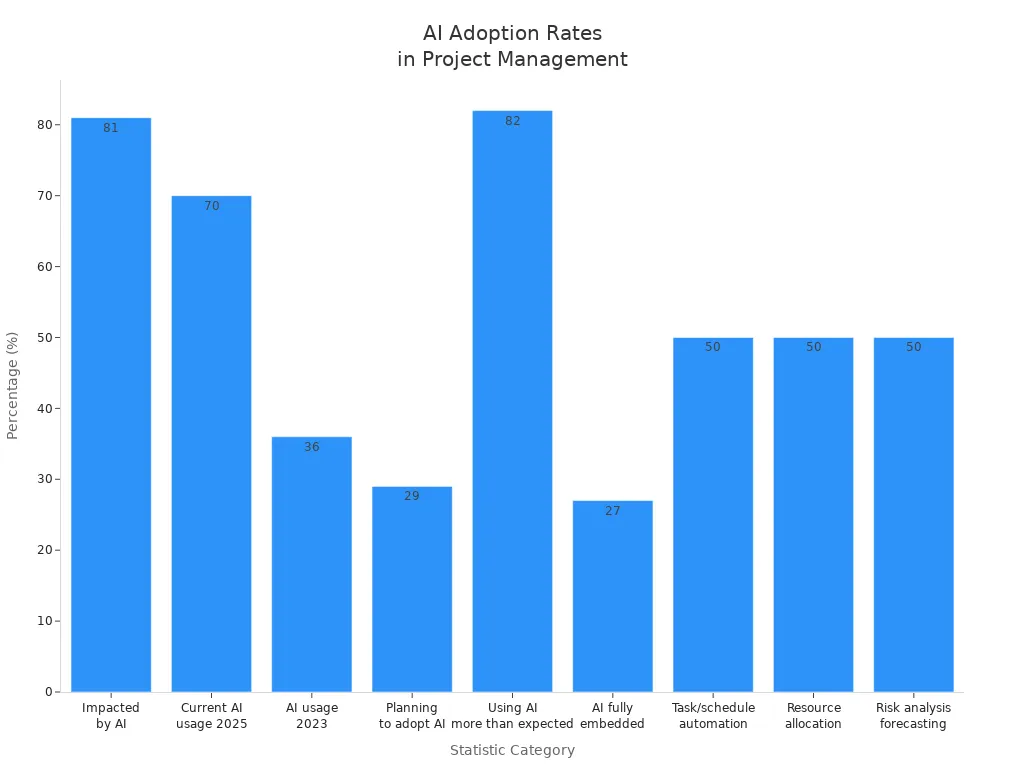
With these advancements, you can expect enhanced decision-making and improved efficiency in your projects, thanks to Microsoft Fabric Real-Time Intelligence - Simply Explained.
Key Takeaways
- Real-time intelligence helps you make quick, informed decisions in project management.
- Using AI can improve productivity and efficiency, leading to better project outcomes.
- Identify your project needs by gathering information and analyzing current processes.
- Choose the right tools for real-time data based on functionality, scalability, and usability.
- Create a real-time dashboard to monitor key metrics and make timely adjustments.
- Implement proactive risk management to detect issues early and avoid delays.
- Focus on data quality by setting clear validation rules and regularly reviewing processes.
- Plan for scalability to ensure your real-time intelligence solutions can grow with your organization.
Microsoft Fabric Real-Time Intelligence - Simply Explained
Key Components
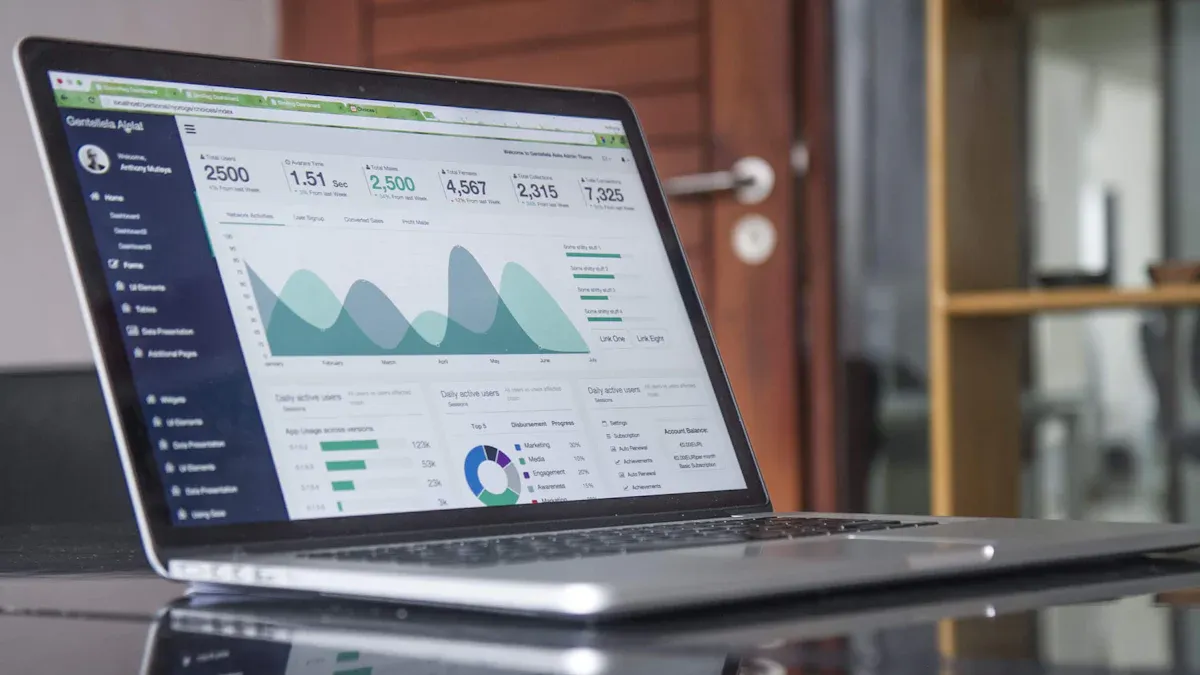
Microsoft Fabric Real-Time Intelligence integrates several key components that enhance your ability to process and analyze data in real-time. Understanding these components can help you leverage the platform effectively:
| Component | Contribution |
|---|---|
| Real-Time Hub | Centralizes all enterprise signals, providing a unified view for operational awareness. |
| Eventstream | Ingests and processes live data streams, enabling filtering, shaping, and enrichment of data. |
| Eventhouse | Offers high-performance analytics over large datasets, highlighting anomalies and risks in real-time. |
| Graph | Links signals to entities and relationships for unified operational awareness. |
| Real-Time Dashboards | Provides intuitive, no-code visualizations of live data, enhancing decision-making capabilities. |
| Activator | Detects patterns and triggers alerts or workflows based on business rules. |
| Operations Agent | Monitors operations and automates actions based on natural language instructions. |
These components work together to create a robust framework for real-time data processing. For instance, the Real-Time Hub centralizes data from various sources, making it easier for you to manage and analyze information. The Eventstream allows for live data processing, ensuring that you can act on insights as they arise.
Benefits of Real-Time Intelligence
Implementing real-time intelligence in your projects offers numerous benefits that can significantly enhance your project management capabilities. Here are some key advantages:
- Efficiency Improvements: Real-time data analysis reduces wasted resources and optimizes execution speed. You can make informed decisions quickly, which leads to better project outcomes.
- Enhanced Resource Planning: By ensuring balanced workloads, you can prevent burnout and improve overall team performance. This proactive approach helps maintain a motivated workforce.
- Early Risk Identification: Real-time intelligence allows you to flag issues weeks before they escalate. This early detection enables you to implement corrective measures promptly.
- Predictive Analytics: You can prioritize critical project elements by leveraging predictive analytics. This ensures that your focus remains on high-value deliverables.
- Anomaly Detection: The platform's AI-powered anomaly detection instantly identifies hidden risks, allowing for real-time course correction.
- Continuous Refinement: You can build intelligent knowledge repositories by capturing insights from completed projects. This ongoing refinement improves future project planning.
Implementing Real-Time Intelligence
Assessing Project Needs
Before you implement a real-time intelligence solution, you must assess your project needs. This assessment ensures that you align your strategy with your goals. Here are the recommended steps to follow:
- Gather Information: Conduct interviews and surveys with stakeholders. Review existing documentation and technical specifications. Analyze current system performance and user feedback.
- Analyze Current State: Map out your current business processes. Document your existing IT infrastructure and systems. Identify pain points and inefficiencies.
- Define Future State: Collaborate with stakeholders to envision the ideal future state. Consider emerging technologies and industry trends. Ensure alignment with your organizational strategy.
- Perform Gap Analysis: Compare your current state to the future state. Identify gaps in technology, processes, and skills. Prioritize these gaps based on their impact and feasibility.
- Develop Recommendations: Propose solutions to address the identified gaps. Consider multiple options and their pros and cons. Align your recommendations with budget and resource constraints.
- Set Clear Goals: Choose measurable targets for your project. Pick key numbers to track progress. Decide when each goal should be met.
- Review and Validate: Present your findings to key stakeholders. Gather feedback and make necessary adjustments. Obtain formal approval of the needs assessment.
Choosing Tools for Real-Time Data
Selecting the right tools for real-time data is crucial for successful project management. You should evaluate tools based on several criteria:
| Criteria | Description |
|---|---|
| Functionality Fit | Evaluate if the tool matches your specific project delivery model. |
| Scalability | Assess if the tool can support growth as your organization becomes more complex. |
| Integration Depth | Check if the tool integrates well with existing systems to avoid data silos. |
| Usability | Ensure the tool is user-friendly to encourage team adoption and regular use. |
| Financial and Resource Management | Look for native capabilities in financial and resource management, which are crucial for project success. |
| Security and Compliance | Confirm that the tool meets necessary security standards and compliance requirements. |
| Total Cost of Ownership | Consider all costs associated with the tool, including implementation and support, for a fair comparison. |
When evaluating tools, consider how they integrate with Microsoft Fabric. For instance, Microsoft Fabric is designed for end-to-end analytics, integrating tightly with Power BI and other Microsoft tools. This integration makes it suitable for structured data and moderate real-time needs. Azure Data Explorer (ADX) excels in scenarios requiring ultra-fast ingestion and analytics, particularly for high-volume, time-series, or log data.
Building a Real-Time Intelligence Dashboard
Creating a real-time intelligence dashboard is essential for effective project monitoring. Follow these essential steps to build your dashboard:
- Define Objectives: Clearly outline what metrics or KPIs are essential for monitoring in real-time.
- Identify Reliable Data Sources: Ensure that you have data sources that can provide frequent updates for real-time analytics.
- Choose the Right Tools and Technologies: Select appropriate tools that align with your objectives and data sources.
- Design an Intuitive User Interface: Create a simple UI that focuses on key metrics and is accessible across devices.
- Integrate Data Sources: Connect your data streams and configure real-time updates for accurate reporting.
By following these steps, you can create a real-time dashboard that enhances your project management capabilities. This dashboard will allow you to visualize streaming data effectively, enabling you to make informed decisions quickly.
Common Use Cases for Real-Time Intelligence
Project Management Applications
Real-time intelligence plays a crucial role in project management. You can leverage it to enhance tracking and resource allocation. Here are some ways it helps:
- Timely Adjustments: Real-time project tracking allows you to make adjustments quickly. This prevents minor delays from escalating into significant setbacks.
- Visibility: AI provides visibility into each project phase. You can make agile adjustments when issues arise.
- Optimized Resource Allocation: AI analyzes team members’ skills and workloads. This ensures efficient use of resources and helps avoid burnout.
- Predictive Planning: AI anticipates future resource needs based on project milestones. You can proactively adjust your plans to meet these needs.
To effectively implement real-time intelligence in your projects, consider these steps:
- Assess your organization's specific needs and research AI solutions focusing on features like predictive analytics.
- Map out how the AI software will interact with existing tools to ensure compatibility.
- Organize training sessions for team members on using AI-enhanced software and interpreting insights.
- Implement robust cybersecurity measures to protect sensitive information.
- Continuously feed project data into AI systems to improve their accuracy and effectiveness.
Enhancing Customer Experience
Real-time intelligence significantly enhances customer experience in service-oriented projects. You can create personalized interactions and anticipate customer needs. Here are some contributions of real-time intelligence:
| Aspect of Real-Time Intelligence | Contribution to Customer Experience |
|---|---|
| Personalized Interactions | Tailors services to individual preferences, enhancing satisfaction and loyalty. |
| Proactive Service Delivery | Anticipates customer needs, leading to timely and effective responses. |
| Efficient Problem Resolution | Enables quick identification and resolution of issues, improving overall experience. |
For example, live tracking of orders on smartphones boosts customer satisfaction. AI technologies facilitate proactive and personalized service models, addressing customer needs in real time. You can also measure the impact of these improvements using metrics like Customer Satisfaction Score (CSAT) and Net Promoter Score (NPS).
Operational Efficiency Improvements
Implementing real-time intelligence can lead to significant operational efficiency improvements. Here are some documented benefits:
- Reduced Coordination Time: AI improves efficiency in supply chain execution, logistics operations, and procurement.
- Early Risk Identification: AI identifies risks early and triggers actionable pathways to manage late shipments effectively.
- Faster Work Routing: In procurement, AI enhances efficiency by routing work faster and categorizing exceptions into repeatable pathways.
To achieve these improvements, standardizing exceptions allows AI to generate actionable recommendations. This prevents backlogs and enhances overall efficiency. Real efficiency comes from verified closure, ensuring workflows are completed and preventing rework loops.
By integrating real-time intelligence into your projects, you can transform how you manage tasks, engage customers, and streamline operations.
Best Practices for Real-Time Analytics
Ensuring Data Quality
To achieve effective real-time analytics, you must prioritize data quality. Here are some best practices to ensure your data remains accurate and reliable:
- Select the Right Tools: Choose tools that meet your organization's specific quality requirements. Consider factors like scalability and integration.
- Define Clear Validation Rules: Establish rules for accuracy, completeness, consistency, and timeliness of data.
- Incorporate Validation into Information Pipelines: Embed validation checks in your information pipelines to catch issues early.
- Leverage Machine Learning for Enhanced Validation: Use machine learning to refine validation processes and provide intelligent alerts.
- Consistently Examine and Refresh Validation Procedures: Regularly assess and adjust your validation procedures to keep them effective.
By following these steps, you can maintain high data quality, which is crucial for improved monitoring and decision-making.
Monitoring and Maintenance Strategies
Ongoing monitoring and maintenance are vital for the success of your real-time intelligence solutions. Implement these strategies to ensure your systems run smoothly:
| Strategy | Description |
|---|---|
| Champion Networks | Develop networks to support ongoing implementation and optimization. |
| Continuous Learning | Automatically refine maintenance strategies and predictions based on outcomes and conditions. |
| Gradual Rollout Approach | Implement tasks systematically while monitoring performance to avoid overwhelming systems. |
| Performance Monitoring and Feedback | Track reliability indicators and costs to validate effectiveness and refine strategies. |
| Organizational Learning | Capture lessons learned and best practices for application to additional systems. |
These strategies help you maintain system integrity and adapt to changing conditions, ensuring that your real-time analytics remain effective.
Scalability Considerations
When deploying real-time intelligence in large-scale projects, consider the following scalability practices:
- Proactive Planning: Anticipate scalability needs to ensure smooth growth.
- Robust Security Measures: Address security concerns to protect data and devices.
- Efficient Device Management: Implement systems for managing a large number of devices effectively.
- Reliable Connectivity: Ensure consistent connectivity to support device communication.
- Adaptable Systems: Design systems that can scale up or down based on demand.
Additionally, modularity in your systems can enhance deployment speed and code reuse. Focus on strong data foundations to prevent project failures due to data issues. By addressing these considerations, you can ensure that your real-time intelligence solutions grow alongside your organization.
Implementing real-time intelligence in your projects can lead to significant improvements. You can achieve faster decision-making and enhance overall project outcomes. Key benefits include optimized resource allocation, improved communication, and reduced costs. According to a McKinsey study, organizations that adopt AI-driven workflow automation can save 20-30% on routine tasks.
To start integrating real-time intelligence, consider these actionable steps:
- Identify automation opportunities in your workflows.
- Set SMART goals for your AI integration.
- Choose the right tools that fit your needs.
- Continuously evaluate and improve your processes.
By taking these steps, you can transform your project management approach and drive success.
FAQ
What is real-time intelligence?
Real-time intelligence refers to the ability to analyze and act on data as it is generated. This capability allows you to make informed decisions quickly, enhancing project management and operational efficiency.
How can I assess my project's needs for real-time intelligence?
Start by gathering information from stakeholders. Analyze current processes and identify gaps. Define your future goals and develop recommendations to address those gaps effectively.
What tools should I consider for real-time data?
Look for tools that fit your project needs. Consider functionality, scalability, integration, usability, and security. Microsoft Fabric and Azure Data Explorer are excellent options for real-time analytics.
How do I build a real-time intelligence dashboard?
Define your objectives and identify reliable data sources. Choose the right tools, design an intuitive interface, and integrate data streams for real-time updates.
What are common use cases for real-time intelligence?
Common use cases include project management, enhancing customer experience, and improving operational efficiency. Each application leverages real-time data to drive better decision-making and outcomes.
How can I ensure data quality in real-time analytics?
Prioritize data quality by selecting the right tools, defining validation rules, and embedding checks in your information pipelines. Regularly review and adjust your validation procedures.
What maintenance strategies should I implement for real-time intelligence systems?
Develop champion networks for ongoing support. Monitor performance, track reliability indicators, and capture lessons learned. This approach ensures your systems remain effective and adaptable.
How can I scale real-time intelligence solutions?
Plan proactively for scalability. Implement robust security measures, manage devices efficiently, and ensure reliable connectivity. Design adaptable systems that can grow with your organization.
🎧 You Should Also Listen To
- Microsoft Fabric – Simply Explained provides the next practical learning step and adds useful context for this topic.
- Power Platform – Simply Explained provides the next practical learning step and adds useful context for this topic.
- AI Agents – Simply Explained provides the next practical learning step and adds useful context for this topic.
Last reviewed: July 2026.
🚀 Want to be part of m365.fm?
Then stop just listening… and start showing up.
👉 Connect with me on LinkedIn and let’s make something happen:
- 🎙️ Be a podcast guest and share your story
- 🎧 Host your own episode (yes, seriously)
- 💡 Pitch topics the community actually wants to hear
- 🌍 Build your personal brand in the Microsoft 365 space
This isn’t just a podcast — it’s a platform for people who take action.
🔥 Most people wait. The best ones don’t.
👉 Connect with me on LinkedIn and send me a message:
"I want in"
Let’s build something awesome 👊
1
00:00:00,000 --> 00:00:04,240
Today's topic is one that almost everyone has heard of, but almost nobody can explain
2
00:00:04,240 --> 00:00:05,240
in plain English.
3
00:00:05,240 --> 00:00:08,280
What exactly is real-time intelligence in Microsoft Fabric?
4
00:00:08,280 --> 00:00:12,680
Most people hear real-time and think faster dashboards, better power BI refresh rates,
5
00:00:12,680 --> 00:00:15,600
or a report that updates every few minutes instead of every day.
6
00:00:15,600 --> 00:00:17,320
That's not wrong, but it misses the point.
7
00:00:17,320 --> 00:00:20,920
Real-time intelligence isn't about making your existing reports faster, it's about doing
8
00:00:20,920 --> 00:00:22,240
something different with your data.
9
00:00:22,240 --> 00:00:26,000
By the end of this episode, you'll understand what it actually is, the four building blocks
10
00:00:26,000 --> 00:00:28,320
that make it work, and when you actually need it.
11
00:00:28,320 --> 00:00:29,320
Here's the thing.
12
00:00:29,320 --> 00:00:33,200
Making the difference between batch analytics and real-time intelligence saves you time,
13
00:00:33,200 --> 00:00:34,640
money, and tech headaches.
14
00:00:34,640 --> 00:00:37,800
Some people build expensive real-time systems they don't need.
15
00:00:37,800 --> 00:00:42,040
Others miss critical signals because they're using batch tools for a job that needs streaming.
16
00:00:42,040 --> 00:00:43,520
Let's start with the big picture.
17
00:00:43,520 --> 00:00:46,760
What problem does real-time intelligence actually solve?
18
00:00:46,760 --> 00:00:47,760
Why this matters?
19
00:00:47,760 --> 00:00:49,680
The shift from batch to streaming.
20
00:00:49,680 --> 00:00:53,360
When most people think about analytics, they think about looking at what happened yesterday,
21
00:00:53,360 --> 00:00:54,840
last week or last quarter.
22
00:00:54,840 --> 00:00:58,800
You collect data, store it somewhere, and then later hours or days later, you run a report.
23
00:00:58,800 --> 00:01:02,800
This is batch processing, and it's how most businesses have worked for decades.
24
00:01:02,800 --> 00:01:06,920
Data sits in a database, you run a nightly ETL job, and by morning you have a report.
25
00:01:06,920 --> 00:01:11,080
It works fine for a lot of things like sales reports, quarterly reviews, and marketing campaign
26
00:01:11,080 --> 00:01:12,080
analysis.
27
00:01:12,080 --> 00:01:15,560
If you're looking at trends over time, batch processing is adequate.
28
00:01:15,560 --> 00:01:16,760
But some data doesn't wait.
29
00:01:16,760 --> 00:01:18,840
It loses its value the moment you delay.
30
00:01:18,840 --> 00:01:22,760
The cost of waiting is measured in thousands of dollars per minute, which is why equipment
31
00:01:22,760 --> 00:01:26,480
sensors on a factory floor need real-time analysis.
32
00:01:26,480 --> 00:01:31,280
If a machine is vibrating at an abnormal frequency, you need to know now, not tomorrow morning,
33
00:01:31,280 --> 00:01:32,280
not even in an hour.
34
00:01:32,280 --> 00:01:36,720
By the time your nightly batch job runs, that machine could have failed, production stops,
35
00:01:36,720 --> 00:01:38,480
and parts need replacing.
36
00:01:38,480 --> 00:01:39,720
Consider fraud detection.
37
00:01:39,720 --> 00:01:42,160
Someone swipes a stolen credit card at a gas station.
38
00:01:42,160 --> 00:01:45,360
If your system catches it in milliseconds, you block the transaction.
39
00:01:45,360 --> 00:01:48,360
But if it waits until the next batch run, the money is gone.
40
00:01:48,360 --> 00:01:52,400
Or take inventory levels in a retail store where a popular item sells out at two o'clock
41
00:01:52,400 --> 00:01:53,800
on a Saturday afternoon.
42
00:01:53,800 --> 00:01:57,800
If you know immediately, you can restock from the back room or trigger a replenishment order.
43
00:01:57,800 --> 00:02:00,940
But if you find out on Monday morning, you've lost three days of sales.
44
00:02:00,940 --> 00:02:01,940
This is the shift.
45
00:02:01,940 --> 00:02:05,760
The difference between fast and real-time is about the relationship between data and action,
46
00:02:05,760 --> 00:02:06,760
not speed.
47
00:02:06,760 --> 00:02:09,640
Fast is a power BI report that refreshes every few minutes.
48
00:02:09,640 --> 00:02:11,680
But you still have to look at it and decide what to do.
49
00:02:11,680 --> 00:02:14,600
Real-time is data that triggers an action the moment it arrives.
50
00:02:14,600 --> 00:02:17,360
The system doesn't wait for you to check a dashboard at acts.
51
00:02:17,360 --> 00:02:18,680
Here's a simple example.
52
00:02:18,680 --> 00:02:22,360
Imagine a temperature sensor on a refrigerated truck carrying ice cream.
53
00:02:22,360 --> 00:02:25,680
If you check the temperature every hour by the time you see the problem, your ice cream
54
00:02:25,680 --> 00:02:27,120
might already be melted.
55
00:02:27,120 --> 00:02:31,120
But if your system detects the temperature spike in milliseconds and automatically re-roots
56
00:02:31,120 --> 00:02:36,360
the truck to a maintenance depot, you save the product, the delivery and the customer relationship.
57
00:02:36,360 --> 00:02:38,480
That's what real-time intelligence is about.
58
00:02:38,480 --> 00:02:40,880
Shortening the time between signal and action.
59
00:02:40,880 --> 00:02:45,060
Instead of data flowing into a database and waiting for someone to ask a question, data
60
00:02:45,060 --> 00:02:49,240
flows into a system that's already listening, watching and ready to respond.
61
00:02:49,240 --> 00:02:51,720
So what is Microsoft Fabric real-time intelligence?
62
00:02:51,720 --> 00:02:53,360
Just define it properly.
63
00:02:53,360 --> 00:02:54,600
What is real-time intelligence?
64
00:02:54,600 --> 00:02:55,600
The big picture.
65
00:02:55,600 --> 00:02:57,960
So what exactly is real-time intelligence?
66
00:02:57,960 --> 00:02:59,200
Here's the simplest definition.
67
00:02:59,200 --> 00:03:03,800
It's a set of tools inside Microsoft Fabric that lets you bring in data, process it, analyze
68
00:03:03,800 --> 00:03:06,440
it, visualize it and act on it the moment it arrives.
69
00:03:06,440 --> 00:03:07,440
Not later.
70
00:03:07,440 --> 00:03:08,440
Right now.
71
00:03:08,440 --> 00:03:09,440
Think of it like a control room for live data.
72
00:03:09,440 --> 00:03:13,080
Not a library where you look things up later, but a command center where things happen
73
00:03:13,080 --> 00:03:14,360
in real-time.
74
00:03:14,360 --> 00:03:18,480
Displays are updating, alarms are sounding and decisions are being made on the spot.
75
00:03:18,480 --> 00:03:19,480
That's the difference.
76
00:03:19,480 --> 00:03:21,700
Now Microsoft didn't build this from scratch.
77
00:03:21,700 --> 00:03:27,220
Real-time intelligence is built on proven Azure technology, event hubs, stream analytics
78
00:03:27,220 --> 00:03:28,620
and data explorer.
79
00:03:28,620 --> 00:03:32,140
These are mature services that have been running enterprise workloads for years.
80
00:03:32,140 --> 00:03:36,340
What Microsoft did was package them into a simple unified experience inside Fabric.
81
00:03:36,340 --> 00:03:40,180
You don't have to stitch together five different Azure services and manage the connections
82
00:03:40,180 --> 00:03:41,180
yourself.
83
00:03:41,180 --> 00:03:43,100
It's all they are working together under one roof.
84
00:03:43,100 --> 00:03:46,580
The key difference between real-time intelligence and traditional analytics comes down to one
85
00:03:46,580 --> 00:03:47,580
thing.
86
00:03:47,580 --> 00:03:49,460
Traditional analytics works on stored data.
87
00:03:49,460 --> 00:03:53,180
Stream intelligence works on streaming data, stored data is like a filing cabinet.
88
00:03:53,180 --> 00:03:56,180
You open the drawer, pull out a file and read it at your own pace.
89
00:03:56,180 --> 00:03:57,820
The data isn't going anywhere.
90
00:03:57,820 --> 00:03:59,700
Streaming data is like a conveyor belt.
91
00:03:59,700 --> 00:04:02,660
Packages keep moving past you and you can't stop the belt.
92
00:04:02,660 --> 00:04:05,660
You can't go back and look at something that passed by five minutes ago.
93
00:04:05,660 --> 00:04:06,980
At least not in the same way.
94
00:04:06,980 --> 00:04:10,380
You need to grab the right package as it comes past, inspect it and decide what to do with
95
00:04:10,380 --> 00:04:12,020
it, all in the moment.
96
00:04:12,020 --> 00:04:14,700
Real-time intelligence is built for that conveyor belt world.
97
00:04:14,700 --> 00:04:16,140
There are four main building blocks.
98
00:04:16,140 --> 00:04:18,420
Event streams are the pipes that bring data in.
99
00:04:18,420 --> 00:04:20,900
Event house is the engine that stores and queries it.
100
00:04:20,900 --> 00:04:23,740
Real-time dashboards give you a live view of what's happening.
101
00:04:23,740 --> 00:04:27,380
An activator is the piece that takes action when something needs to happen.
102
00:04:27,380 --> 00:04:30,820
All of this lives inside fabric, which means it connects to one lake, the single copy of
103
00:04:30,820 --> 00:04:31,820
your data.
104
00:04:31,820 --> 00:04:34,700
It shares the same security and governance as everything else you use.
105
00:04:34,700 --> 00:04:38,940
It works with Power BI, notebooks, Spark and all the other tools you already have.
106
00:04:38,940 --> 00:04:40,540
Let's start with the first building block.
107
00:04:40,540 --> 00:04:42,620
How does the data actually get in?
108
00:04:42,620 --> 00:04:43,620
Building block one?
109
00:04:43,620 --> 00:04:44,620
Event streams?
110
00:04:44,620 --> 00:04:45,620
Getting data in?
111
00:04:45,620 --> 00:04:48,100
Before you can analyze anything, the data has to arrive.
112
00:04:48,100 --> 00:04:49,100
That's what event streams do.
113
00:04:49,100 --> 00:04:53,820
An event stream is a managed pipeline that ingests streaming data from a wide range of sources.
114
00:04:53,820 --> 00:04:56,540
Think of it as the front door for all your real-time data.
115
00:04:56,540 --> 00:05:00,780
It doesn't matter where the data comes from, an IoT sensor in a factory, a web application
116
00:05:00,780 --> 00:05:06,060
sending click stream events, a database publishing changes, or a Kafka cluster streaming financial
117
00:05:06,060 --> 00:05:07,580
transactions.
118
00:05:07,580 --> 00:05:09,220
Event streams can connect to all of them.
119
00:05:09,220 --> 00:05:11,180
There are nearly 40 built-in connectors.
120
00:05:11,180 --> 00:05:16,060
MQTT for IoT devices, Kafka for enterprise streams, Azure Event Hubs, change data capture
121
00:05:16,060 --> 00:05:21,380
from databases like SQL Server, PostgreSQL and Cosmos DB and custom rest endpoints if you
122
00:05:21,380 --> 00:05:22,540
need to build your own.
123
00:05:22,540 --> 00:05:26,740
The list keeps growing and Microsoft is adding new connectors regularly, including a custom
124
00:05:26,740 --> 00:05:30,420
stream connector and private preview that lets you build your own connector and have
125
00:05:30,420 --> 00:05:31,940
fabric hosted for you.
126
00:05:31,940 --> 00:05:35,020
The important thing is that you don't need to write code to set up most of these.
127
00:05:35,020 --> 00:05:36,660
It's a simple click-and-connect experience.
128
00:05:36,660 --> 00:05:40,740
You pick your source, configure the connection details, and within minutes data is flowing.
129
00:05:40,740 --> 00:05:43,580
Once data is flowing, you can process it while it's in motion.
130
00:05:43,580 --> 00:05:45,180
This is where event streams get interesting.
131
00:05:45,180 --> 00:05:48,300
You can filter out noise, just drop events that don't matter.
132
00:05:48,300 --> 00:05:51,860
You can transform the format, converting JSON to a structured table.
133
00:05:51,860 --> 00:05:56,020
You can aggregate events, counting how many sensors are reporting above a threshold,
134
00:05:56,020 --> 00:05:59,660
and you can detect duplicates, catching the same ticket being scanned at two different
135
00:05:59,660 --> 00:06:00,660
gates.
136
00:06:00,660 --> 00:06:03,220
There are two ways to process data inside an event stream.
137
00:06:03,220 --> 00:06:06,740
If you're comfortable with queries, you can use SQL-based processing, write a select
138
00:06:06,740 --> 00:06:09,340
statement with filters, joins, and window functions.
139
00:06:09,340 --> 00:06:12,140
The system runs it against the streaming data as it arrives.
140
00:06:12,140 --> 00:06:15,780
If you prefer a visual approach, there's a no-code drag-and-drop editor.
141
00:06:15,780 --> 00:06:19,460
You add operators to a canvas, connect them, and configure them through forms, no SQL
142
00:06:19,460 --> 00:06:20,460
required.
143
00:06:20,460 --> 00:06:22,780
The schema registry is another feature worth knowing about.
144
00:06:22,780 --> 00:06:26,020
As data flows through your event stream, its structure can change over time.
145
00:06:26,020 --> 00:06:28,260
New fields appear, old fields get renamed.
146
00:06:28,260 --> 00:06:31,860
The schema registry tracks all of this, giving you a governance layer over your streaming
147
00:06:31,860 --> 00:06:32,860
data.
148
00:06:32,860 --> 00:06:36,380
That's important for compliance, for debugging, and for teams that need to know what their
149
00:06:36,380 --> 00:06:37,380
data looks like.
150
00:06:37,380 --> 00:06:39,140
Once the data is processed, where does it go?
151
00:06:39,140 --> 00:06:42,340
You have choices, it can go to Event House for storage and querying.
152
00:06:42,340 --> 00:06:44,940
Another option is to send it directly to Activator for Action.
153
00:06:44,940 --> 00:06:48,700
It can also go to another Kafka endpoint if your application needs it there.
154
00:06:48,700 --> 00:06:52,700
Or you can send it to a Spark notebook for custom processing using Python or Scala.
155
00:06:52,700 --> 00:06:53,700
Take this real example.
156
00:06:53,700 --> 00:06:59,140
A stadium operations team used event streams to ingest turn-style data via MQTT.
157
00:06:59,140 --> 00:07:02,100
Thousands of fans entering through dozens of gates.
158
00:07:02,100 --> 00:07:06,660
Within 120 seconds, the event stream detected the same ticket scanned at two different gates.
159
00:07:06,660 --> 00:07:09,500
It flagged the fraud and alerted staff within seconds.
160
00:07:09,500 --> 00:07:12,820
That's the kind of thing you can only do with streaming processing, not batch.
161
00:07:12,820 --> 00:07:16,500
Once the data is flowing through the event stream, it needs a place to land.
162
00:07:16,500 --> 00:07:18,260
That's where Event House comes in.
163
00:07:18,260 --> 00:07:20,980
Building block two, Event House, storing and querying.
164
00:07:20,980 --> 00:07:25,220
Now let's talk about the engine that actually stores and queries your real-time data.
165
00:07:25,220 --> 00:07:26,220
Event House.
166
00:07:26,220 --> 00:07:28,980
Think of it as a database on steroids, built for speed and volume.
167
00:07:28,980 --> 00:07:31,220
We're not talking about thousands of customer records.
168
00:07:31,220 --> 00:07:33,260
We're talking billions of events per day.
169
00:07:33,260 --> 00:07:37,580
It's built on the same custod technology that powers Azure Data Explorer and Microsoft
170
00:07:37,580 --> 00:07:41,500
uses this engine internally for their own telemetry at massive scale.
171
00:07:41,500 --> 00:07:45,260
It handles petabytes of data with sub-second query performance and that's not marketing
172
00:07:45,260 --> 00:07:46,260
fluff.
173
00:07:46,260 --> 00:07:50,540
One team at Microsoft demonstrated a table with 54 billion rows and 44 terabytes of uncompressed
174
00:07:50,540 --> 00:07:51,540
data.
175
00:07:51,540 --> 00:07:55,700
They queried it in under a second using just 32 capacity units.
176
00:07:55,700 --> 00:07:57,580
That's real performance for real workloads.
177
00:07:57,580 --> 00:08:00,980
So what's the big difference between Event House and a traditional SQL database?
178
00:08:00,980 --> 00:08:02,340
It's how they handle data.
179
00:08:02,340 --> 00:08:05,900
A traditional SQL database needs you to pre-define a rigid schema.
180
00:08:05,900 --> 00:08:08,580
So if your data doesn't fit, you have to change the schema.
181
00:08:08,580 --> 00:08:09,900
Event House doesn't work that way.
182
00:08:09,900 --> 00:08:14,100
You can ingest JSON, time series data, logs, telemetry, whatever shape it comes in.
183
00:08:14,100 --> 00:08:16,260
And the engine figures out the structure on the fly.
184
00:08:16,260 --> 00:08:20,180
That's critical for streaming data because the shape can change as new sensors get added
185
00:08:20,180 --> 00:08:22,140
and new fields get introduced.
186
00:08:22,140 --> 00:08:25,020
You don't want to redesign your database every time that happens.
187
00:08:25,020 --> 00:08:28,180
The query language is KQL, short for custochewary language.
188
00:08:28,180 --> 00:08:30,660
It's different from SQL, but it's not hard to learn.
189
00:08:30,660 --> 00:08:35,140
And if you prefer SQL, you can write SQL queries and the system translates them into KQL
190
00:08:35,140 --> 00:08:36,140
automatically.
191
00:08:36,140 --> 00:08:39,140
There's even a co-pilot integration where you ask questions in plain English and get KQL
192
00:08:39,140 --> 00:08:40,580
queries generated for you.
193
00:08:40,580 --> 00:08:43,260
One of the most impressive features is automatic indexing.
194
00:08:43,260 --> 00:08:47,300
When data arrives in Event House, the engine calculates statistics and builds indexes on
195
00:08:47,300 --> 00:08:48,300
the fly.
196
00:08:48,300 --> 00:08:52,020
You never need to think about which columns to index or rebuild indexes after a large
197
00:08:52,020 --> 00:08:53,020
data load.
198
00:08:53,020 --> 00:08:56,100
It just happens automatically, which is a massive productivity gain for anyone who's
199
00:08:56,100 --> 00:08:58,940
spend time tuning database performance.
200
00:08:58,940 --> 00:09:01,940
You can find the most important data in the database.
201
00:09:01,940 --> 00:09:04,940
You can find the most important data in the database.
202
00:09:04,940 --> 00:09:06,940
You can find the most important data in the database.
203
00:09:06,940 --> 00:09:08,940
You can find the most important data in the database.
204
00:09:08,940 --> 00:09:10,940
You can find the most important data in the database.
205
00:09:10,940 --> 00:09:12,940
You can find the most important data in the database.
206
00:09:12,940 --> 00:09:14,940
You can find the most important data in the database.
207
00:09:14,940 --> 00:09:16,940
You can find the most important data in the database.
208
00:09:16,940 --> 00:09:18,940
You can find the most important data in the database.
209
00:09:18,940 --> 00:09:20,940
You can find the most important data in the database.
210
00:09:20,940 --> 00:09:22,940
You can find the most important data in the database.
211
00:09:22,940 --> 00:09:24,940
You can find the most important data in the database.
212
00:09:24,940 --> 00:09:26,940
You can find the most important data in the database.
213
00:09:26,940 --> 00:09:27,940
You can find the most important data in the database.
214
00:09:27,940 --> 00:09:30,940
That makes it available for Spark, notebooks, and Power BI direct
215
00:09:30,940 --> 00:09:31,940
Lake mode.
216
00:09:31,940 --> 00:09:34,940
You get the speed of event house for real time queries and the flexibility of one
217
00:09:34,940 --> 00:09:36,940
Lake for historical analysis all from the same data.
218
00:09:36,940 --> 00:09:39,940
Let me repeat that real world example because it's worth your time.
219
00:09:39,940 --> 00:09:44,140
A team at Microsoft demonstrated a table with 54 billion rows and 44
220
00:09:44,140 --> 00:09:47,940
terabytes uncompressed and they queried it in under a second using 32
221
00:09:47,940 --> 00:09:48,940
capacity units.
222
00:09:48,940 --> 00:09:52,940
That's the kind of performance event house delivers, not for a demo with carefully crafted test data,
223
00:09:52,940 --> 00:09:54,940
but for real production workloads.
224
00:09:54,940 --> 00:09:56,940
So now the data is stored and ready to query.
225
00:09:56,940 --> 00:09:58,940
How do you actually see what's happening?
226
00:09:58,940 --> 00:10:00,940
That's where real time dashboards come in.
227
00:10:00,940 --> 00:10:03,940
Building block three, real time dashboards, seeing it live.
228
00:10:03,940 --> 00:10:07,940
A real time dashboard is a live visualization that updates automatically
229
00:10:07,940 --> 00:10:09,940
as new data arrives in event house.
230
00:10:09,940 --> 00:10:11,940
It's not a report you refresh.
231
00:10:11,940 --> 00:10:14,940
It's a window into data that's moving right now.
232
00:10:14,940 --> 00:10:17,940
This is different from a Power BI report, which refreshes on a schedule.
233
00:10:17,940 --> 00:10:20,940
You set it to refresh every hour, every 15 minutes, or every minute
234
00:10:20,940 --> 00:10:22,940
if you're using direct query.
235
00:10:22,940 --> 00:10:25,940
But there's always a gap between when the data arrives and when the report shows it.
236
00:10:25,940 --> 00:10:27,940
Real time dashboards don't have that gap.
237
00:10:27,940 --> 00:10:29,940
They're built directly on top of event house.
238
00:10:29,940 --> 00:10:32,940
So the data flows from source to visualization in milliseconds,
239
00:10:32,940 --> 00:10:35,940
no intermediate layer, no caching, no refresh cycle.
240
00:10:35,940 --> 00:10:39,940
You create tiles by writing KQL queries and saving the results as visual elements
241
00:10:39,940 --> 00:10:44,940
like bar charts, time charts, maps, tables, whatever makes sense for your data.
242
00:10:44,940 --> 00:10:49,940
The system handles the rendering and the tiles update continuously as new events arrive in event house.
243
00:10:49,940 --> 00:10:52,940
One capability worth highlighting is geospatial support.
244
00:10:52,940 --> 00:10:57,940
If your data has latitude and longitude coordinates, you can plot it on a map with a few clicks.
245
00:10:57,940 --> 00:11:01,940
This is useful for logistics, fleet tracking, retail store monitoring,
246
00:11:01,940 --> 00:11:03,940
or any scenario where location matters.
247
00:11:03,940 --> 00:11:07,940
In the research, there's an example of monitoring bike rental stations across London.
248
00:11:07,940 --> 00:11:11,940
The dashboard shows live bike availability on a map with station level details,
249
00:11:11,940 --> 00:11:16,940
so you can see which stations are full, which are empty, and where the demand is shifting all in real time.
250
00:11:16,940 --> 00:11:20,940
You can also connect Power BI to event house using direct query mode.
251
00:11:20,940 --> 00:11:24,940
This gives you the full Power BI experience, including measures, hierarchies, bookmarks,
252
00:11:24,940 --> 00:11:26,940
and drill through with real time performance.
253
00:11:26,940 --> 00:11:30,940
The difference is that Power BI queries the event house directly,
254
00:11:30,940 --> 00:11:32,940
instead of importing data into a model.
255
00:11:32,940 --> 00:11:36,940
You get the flexibility of Power BI with the speed of event house underneath.
256
00:11:36,940 --> 00:11:37,940
Here's the key takeaway.
257
00:11:37,940 --> 00:11:41,940
Real-time dashboards are for operational monitoring, seeing what's happening right now.
258
00:11:41,940 --> 00:11:46,940
Power BI is for deeper analysis over time, they serve different purposes, and you can use both.
259
00:11:46,940 --> 00:11:49,940
But if you need to know what's happening this second, real-time dashboards are the tool.
260
00:11:49,940 --> 00:11:51,940
But seeing the data is only half the story.
261
00:11:51,940 --> 00:11:56,940
The real power of real-time intelligence is acting on it, and that's where activator comes in.
262
00:11:56,940 --> 00:11:59,940
Building block 4, Activator, taking action without code.
263
00:11:59,940 --> 00:12:02,940
So here's the fourth building block. Activator watches your streaming data
264
00:12:02,940 --> 00:12:05,940
and takes action when something important happens.
265
00:12:05,940 --> 00:12:07,940
And you don't need to write any code.
266
00:12:07,940 --> 00:12:10,940
No expressions, no custom logic. Just describe what you want in plain English,
267
00:12:10,940 --> 00:12:12,940
and Activator handles the rest.
268
00:12:12,940 --> 00:12:14,940
Let me give you an example.
269
00:12:14,940 --> 00:12:16,940
You set up a rule like this.
270
00:12:16,940 --> 00:12:20,940
If temperature exceeds 40 degrees, send a team's alert to the operations team.
271
00:12:20,940 --> 00:12:23,940
That's it. Type the condition, pick the action, and you're done.
272
00:12:23,940 --> 00:12:26,940
No query to write, no web hook to configure. Activator takes care of the rest.
273
00:12:26,940 --> 00:12:30,940
Your conditions can be simple, a threshold or a value crossing a boundary.
274
00:12:30,940 --> 00:12:35,940
But they can get smarter too. Look for patterns over time, like a temperature climbing steadily for 10 minutes.
275
00:12:35,940 --> 00:12:37,940
Or anomalies.
276
00:12:37,940 --> 00:12:41,940
Activator learns the normal pattern of your data and spots when something deviates.
277
00:12:41,940 --> 00:12:46,940
Even missing data works. If a sensor stops reporting, Activator detects that silence and sends an alert.
278
00:12:46,940 --> 00:12:48,940
The actions you can take are a lot.
279
00:12:48,940 --> 00:12:53,940
Send an email, post a team's message, run a power automate flow that connects to hundreds of other systems,
280
00:12:53,940 --> 00:12:56,940
trigger a fabric pipeline or notebook or call a custom API,
281
00:12:56,940 --> 00:12:58,940
and Microsoft keeps adding more all the time.
282
00:12:58,940 --> 00:13:02,940
Anomaly detection is built into Activator, pick a table in a field,
283
00:13:02,940 --> 00:13:05,940
and Activator looks at the historical pattern. It learns what's normal,
284
00:13:05,940 --> 00:13:09,940
the seasonality, the typical range, the expected variation.
285
00:13:09,940 --> 00:13:13,940
Then it automatically spots outliers as new data arrives. You don't need to be a data scientist.
286
00:13:13,940 --> 00:13:15,940
No model training required. It just works.
287
00:13:15,940 --> 00:13:20,940
And you can publish detected anomalies as business events that other systems can subscribe to.
288
00:13:20,940 --> 00:13:24,940
The operations agent takes this even further. Think of it as an autonomous AI agent
289
00:13:24,940 --> 00:13:28,940
that monitors your data, detects issues, recommends actions, and even executes them.
290
00:13:28,940 --> 00:13:31,940
You give it business goals and instructions in natural language.
291
00:13:31,940 --> 00:13:34,940
It connects to your data through the fabric ontology,
292
00:13:34,940 --> 00:13:40,940
that shared context layer that maps your business entities. It runs 24/7 watching for the conditions that matter.
293
00:13:40,940 --> 00:13:44,940
When it detects something, it alerts the team, recommends a course of action,
294
00:13:44,940 --> 00:13:46,940
and can execute that action if you approve it.
295
00:13:46,940 --> 00:13:49,940
Here's a real world example from the folks who built this.
296
00:13:49,940 --> 00:13:52,940
A hospital uses Activator to monitor patient vitals.
297
00:13:52,940 --> 00:13:54,940
When a patient's blood pressure crosses a critical threshold,
298
00:13:54,940 --> 00:13:57,940
Activator sends an alert to the nurses' station in teams.
299
00:13:57,940 --> 00:14:01,940
It automatically logs the event and even triggers a workflow that updates the patient's record.
300
00:14:01,940 --> 00:14:06,940
No human had to watch the dashboard. No one had to decide what to do. Activator handled it.
301
00:14:06,940 --> 00:14:10,940
So we've covered the four building blocks, event streams to get data in,
302
00:14:10,940 --> 00:14:13,940
even tells to store and query it, real-time dashboards to see it live,
303
00:14:13,940 --> 00:14:17,940
Activator to take action. But here's a question that doesn't get asked enough.
304
00:14:17,940 --> 00:14:19,940
When do you actually need real-time intelligence?
305
00:14:19,940 --> 00:14:21,940
When you actually need it, and when you don't.
306
00:14:21,940 --> 00:14:24,940
This is the most practical question, and it's one that doesn't get asked enough.
307
00:14:24,940 --> 00:14:27,940
The most common mistake is thinking you need real-time
308
00:14:27,940 --> 00:14:30,940
when you actually just need faster batch processing.
309
00:14:30,940 --> 00:14:34,940
Here's the thing, you need real-time when the time between data arrival and action matters.
310
00:14:34,940 --> 00:14:40,940
If waiting an hour causes a problem, lost money, broken equipment, a missed opportunity,
311
00:14:40,940 --> 00:14:41,940
you need real-time.
312
00:14:41,940 --> 00:14:44,940
If waiting an hour doesn't cause a problem, you probably don't.
313
00:14:44,940 --> 00:14:46,940
Think about IoT sensor monitoring.
314
00:14:46,940 --> 00:14:49,940
A machine on a factory floor sends temperature readings every second.
315
00:14:49,940 --> 00:14:53,940
If it overheats, you need to shut it down immediately. That's real-time.
316
00:14:53,940 --> 00:14:57,940
Or consider fraud detection. A credit card transaction happens in milliseconds.
317
00:14:57,940 --> 00:15:02,940
And if you don't catch it in that window, the money moves. For live inventory management in a retail store,
318
00:15:02,940 --> 00:15:06,940
a popular item sells out at 2pm on Saturday. If you know at 2pm, you can restock.
319
00:15:06,940 --> 00:15:08,940
If you find out Monday morning, you've lost the weekend.
320
00:15:08,940 --> 00:15:11,940
Equipment health monitoring works the same way.
321
00:15:11,940 --> 00:15:16,940
A vibration sensor on a pump detects an abnormal pattern, and you can schedule maintenance before the pump fails.
322
00:15:16,940 --> 00:15:18,940
Customer experience monitoring on a website.
323
00:15:18,940 --> 00:15:22,940
If your checkout page goes down, you need to know within seconds, not hours.
324
00:15:22,940 --> 00:15:25,940
Logistics tracking. A refrigerated truck deviates from its root.
325
00:15:25,940 --> 00:15:27,940
You need to know before the ice cream melts.
326
00:15:27,940 --> 00:15:30,940
On the flip side, you don't need real-time for monthly sales reports.
327
00:15:30,940 --> 00:15:33,940
So you don't need to know what happened last month within seconds.
328
00:15:33,940 --> 00:15:39,940
Quarterly financial reviews, same thing. Employee performance dashboards and marketing campaign analysis are all batch workloads.
329
00:15:39,940 --> 00:15:43,940
They work fine with nightly refreshes. The architecture costs matters too.
330
00:15:43,940 --> 00:15:46,940
Real-time intelligence uses fabric capacity.
331
00:15:46,940 --> 00:15:50,940
If you're processing millions of events per second, it costs fabric capacity units.
332
00:15:50,940 --> 00:15:55,940
Batch processing is often cheaper because you're not keeping compute running continuously.
333
00:15:55,940 --> 00:15:59,940
You pay for what you use when you use it. A hybrid approach often makes the most sense.
334
00:15:59,940 --> 00:16:01,940
Use event house for the hot path.
335
00:16:01,940 --> 00:16:03,940
Recent data that needs millisecond response times.
336
00:16:03,940 --> 00:16:06,940
Then let it feed into one leg for the cold path.
337
00:16:06,940 --> 00:16:08,940
Historical analysis in Spark or Power BI.
338
00:16:08,940 --> 00:16:14,940
You get the speed of real-time for operational decisions and the cost efficiency of batch for long-term analytics.
339
00:16:14,940 --> 00:16:17,940
The rule of thumb is simple. If you can describe the action you take with the data
340
00:16:17,940 --> 00:16:21,940
and that action needs to happen within seconds, real-time is for you.
341
00:16:21,940 --> 00:16:24,940
If you're just curious to see the number sooner, it's probably not.
342
00:16:24,940 --> 00:16:27,940
There's nothing wrong with batch processing. It's the right tool for a lot of jobs.
343
00:16:27,940 --> 00:16:30,940
The key is knowing which job you're hiring for.
344
00:16:30,940 --> 00:16:32,940
How it all connects to everything else in fabric.
345
00:16:32,940 --> 00:16:35,940
So, real-time intelligence isn't a separate island.
346
00:16:35,940 --> 00:16:39,940
It's a workload inside fabric which means it shares the same foundation as everything else you use.
347
00:16:39,940 --> 00:16:41,940
Let me show you how it all fits together.
348
00:16:41,940 --> 00:16:44,940
Think of one leg as a single filing cabinet for your entire company
349
00:16:44,940 --> 00:16:47,940
where eventhouse can publish data as delta-parkay files.
350
00:16:47,940 --> 00:16:53,940
That means your streaming data becomes available to leg houses, warehouses, notebooks and power BI.
351
00:16:53,940 --> 00:16:54,940
Why does that matter?
352
00:16:54,940 --> 00:16:58,940
You don't need to copy data around. It's all in one place, ready for whatever tool you need.
353
00:16:58,940 --> 00:17:00,940
Security and governance are unified too.
354
00:17:00,940 --> 00:17:04,940
If you manage access in fabric, those same rules apply to your streaming data.
355
00:17:04,940 --> 00:17:08,940
The same row-level security, column permissions and data sensitivity labels all carry over.
356
00:17:08,940 --> 00:17:12,940
You don't need to set up a separate security model for your real-time data.
357
00:17:12,940 --> 00:17:14,940
It inherits everything from the platform.
358
00:17:14,940 --> 00:17:19,940
Shortcuts work both ways. You can create a shortcut from a leg house table into an event house,
359
00:17:19,940 --> 00:17:27,940
letting you enrich your streaming data with reference data, product catalogs, customer lists, location hierarchies, without copying it.
360
00:17:27,940 --> 00:17:31,940
And you can create a shortcut from an event house table into a leg house,
361
00:17:31,940 --> 00:17:37,940
making your streaming data available for historical analysis in Spark notebooks or Power BI reports.
362
00:17:37,940 --> 00:17:41,940
It's like cross-referencing folders in a filing cabinet, but without the duplicates.
363
00:17:41,940 --> 00:17:47,940
Copilot is integrated throughout, so you can ask natural language questions and get KQL queries generated automatically.
364
00:17:47,940 --> 00:17:51,940
Describe the inside you want, and copilot writes the query.
365
00:17:51,940 --> 00:17:55,940
Describe the condition you want to monitor and activator sets up the rule.
366
00:17:55,940 --> 00:17:58,940
The AI is there to lower the barrier, not replace your judgment.
367
00:17:58,940 --> 00:18:00,940
It's like having a senior analyst right next to you.
368
00:18:00,940 --> 00:18:04,940
The real-time hub is the central place to see all your streaming assets.
369
00:18:04,940 --> 00:18:08,940
Event streams, event houses, activators, business events, it's all there in one view.
370
00:18:08,940 --> 00:18:15,940
You can discover data streams other teams have created, monitor the health of your pipelines, and see which rules are firing and which are silent.
371
00:18:15,940 --> 00:18:19,940
It's the command center for your real-time operations. Here's the bigger picture.
372
00:18:19,940 --> 00:18:26,940
Microsoft is building toward a unified intelligence platform where streaming data, stored data, and AI agents all work together.
373
00:18:26,940 --> 00:18:30,940
Real-time intelligence handles the now, fabric IQ handles the context.
374
00:18:30,940 --> 00:18:35,940
The business entities and relationships that give data meaning, and AI agents handle the action,
375
00:18:35,940 --> 00:18:43,940
monitoring, deciding, executing, together they form a system that can sense, understand, and respond in real-time.
376
00:18:43,940 --> 00:18:46,940
So now you understand what real-time intelligence actually is.
377
00:18:46,940 --> 00:18:54,940
Not just a faster dashboard or a better refresh rate, but a complete system for ingesting, analyzing, visualizing, and acting on data as it arrives.
378
00:18:54,940 --> 00:19:02,940
The four building blocks are event streams to get data in, event house to store and query it at massive scale, real-time dashboards to see it live,
379
00:19:02,940 --> 00:19:05,940
and activate it to take action when something needs to happen.
380
00:19:05,940 --> 00:19:13,940
If this episode helped you connect the dots, subscribe on your favorite podcast platform, and share it with someone who's just starting their journey into Microsoft fabric.
381
00:19:13,940 --> 00:19:21,940
Next time, we'll walk through how to build your first real-time solution step-by-step, from connecting a data source to setting up an alert that actually does something useful.
382
00:19:21,940 --> 00:19:26,940
I'm Mirko Peters and this is Microsoft Knowledge Nuggets on M365. FFM, thanks for listening.

Founder of m365.fm, m365.show and m365con.net
Mirko Peters is a Microsoft 365 expert, content creator, and founder of m365.fm, a platform dedicated to sharing practical insights on modern workplace technologies. His work focuses on Microsoft 365 governance, security, collaboration, and real-world implementation strategies.
Through his podcast and written content, Mirko provides hands-on guidance for IT professionals, architects, and business leaders navigating the complexities of Microsoft 365. He is known for translating complex topics into clear, actionable advice, often highlighting common mistakes and overlooked risks in real-world environments.
With a strong emphasis on community contribution and knowledge sharing, Mirko is actively building a platform that connects experts, shares experiences, and helps organizations get the most out of their Microsoft 365 investments.




