
Measuring Engagement in Viva Connections Dashboards: The Complete Guide
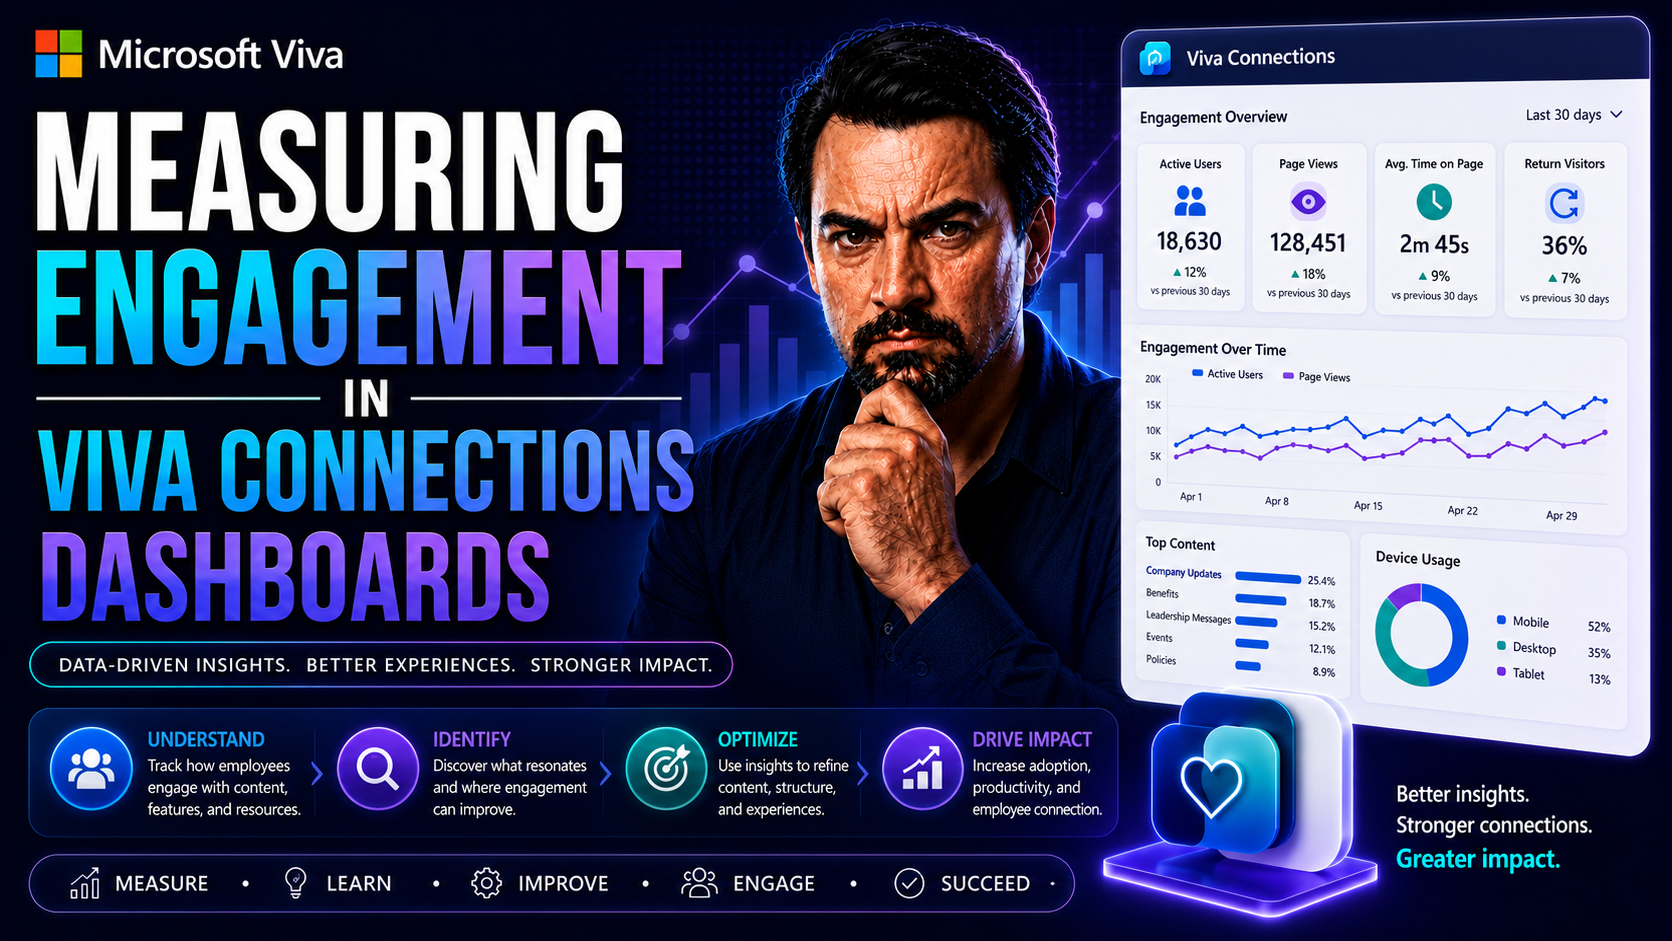
This guide is your all-in-one resource for figuring out how to measure engagement using Viva Connections dashboards. We’ll walk you through each phase—from the first click of setup, right through to pulling out those advanced analytics you hear the big shots talking about. It's less about buzzwords and more about understanding, “What are my people up to in the digital workplace, and how do I know if it’s working?” By the end, you’ll have solid methods for both seeing what’s happening and making it better. This is for anyone who wants to turn everyday employee activity into actionable insight, especially if your focus is HR, internal comms, or digital workplace management. Let’s get into it.
Getting Started With Measuring Engagement in Viva Connections
Measuring engagement in Viva Connections doesn’t have to be a tech headache, or something only your IT folks talk about behind closed doors. This section is all about laying a simple, understandable foundation for getting those engagement numbers to actually mean something to your organization.
We kick things off by looking at the core steps to setting up Viva Connections for tracking—think of it as mapping out the basic road before you worry about the traffic. Whether you’re fresh to Viva or making a return visit, you’ll get a clear sense of where to begin, what needs configuring, and which analytics can help you spot early wins (or problems) in your digital workplace.
On top of that, we introduce you to the data itself—how it flows in, what to look for, and why those first dashboards matter. Don’t worry, we won’t dive into the deep end until you’ve got your feet wet and your bearings set. If you're after hands-on steps and clear pointers, you’re in exactly the right place.
How Do You Get Started Setting Up Viva Connections for Engagement Tracking?
- Prep Your SharePoint Home Site: Start by ensuring your SharePoint home site is set up and ready to serve as the foundation for Viva Connections. This is where your dashboard experience begins.
- Define Permissions and Access: Decide who should have edit and view access. Setting the right permissions early keeps your engagement data secure and accurate.
- Activate Analytics Features: Within the Microsoft 365 admin center, turn on engagement analytics so you can track page views, interactions, and other essential data.
- Identify Core Engagement Metrics: Choose which data points matter—like visits, unique viewers, or time spent—to match your specific engagement priorities.
- Customize the Dashboard Layout: Arrange your Viva Connections cards and web parts based on department needs, making sure content is relevant to users from day one.
Understanding Viva Engage Analytics for Employee Engagement Insights
Viva Engage Analytics is integrated right into Viva Connections, boosting your insight into how people communicate and work together. The analytics cover everything from conversation participation rates to the popularity of different collaboration spaces, giving a transparent window into what makes your digital culture tick.
With Viva Engage, you get stats like active users, message engagement (likes, replies, shares), and the reach of important announcements or updates. These metrics help you spot, at a glance, which teams are thriving in their digital communication and which might be falling through the cracks. You can slice and dice the data by group, department, or even project to drill into the details.
Accessing these analytics is straightforward: they’re surfaced in the Viva Connections dashboard as easy-to-read charts and tables, so you’re not slogging through endless raw data. The information is clear, visual, and actionable—perfect for identifying engagement strengths and gaps.
The key benefit is that analytics allow you to track trends over time. If you see engagement dropping off in certain areas, you can jump in quickly with targeted communications or support. This ability to correlate communication patterns with collaboration success is a major advantage for organizations looking to fine-tune their employee experience.
Designing Effective Viva Connections Dashboards for Engagement Tracking
Designing a dashboard in Viva Connections is more than just making things look pretty—it’s about making employee engagement visible and actionable. This section serves as your launch pad for understanding the best ways to put together dashboards that don't just sit there, but actually work for you and your teams.
What you include—and how you arrange it—impacts how easily everyone in your organization can interact, participate, and be counted. Making smart choices about dashboard cards, widgets, and SharePoint integration ensures every click tells a story about engagement, not just numbers on a screen.
We’ll also touch on why connecting SharePoint with Teams supercharges your analytics. By pulling in unified data, you avoid those gaps that come when your intranet and chat tools aren’t speaking the same language. Next up, we’ll look at which dashboard components deserve top billing if your goal is not just information, but interaction and good, solid measurement.
Leveraging Viva Connections Cards to Drive and Measure Employee Engagement
- Quick Polls: Use poll cards to ask simple questions and get fast feedback. These are easy wins for both engagement and data, showing participation rates in real time.
- News Card: Keep everyone up to speed with company updates. News cards not only inform but track how many people read, like, or comment on each story.
- Events Widget: Advertise upcoming events or training. Get a sense of interest and actual attendance through registration and interaction metrics.
- Resource Links: Offer frequently used tools right up front. See which links are clicked most to identify what your workforce really values.
- Social Feed Card: Surface trending conversations, letting people join in directly while capturing active participation analytics.
Integrating SharePoint Hub and Teams for Centralized Engagement Analytics
Connecting SharePoint hub sites with Microsoft Teams allows organizations to centralize employee engagement measurement. When setup is complete, activity data from both environments rolls up into a unified analytics view, syncing intranet participation with Teams conversations and file collaboration.
This technical integration happens through linked dashboards and data connectors, making it easier for communications and HR leaders to see patterns by department, project, or even the entire organization. The biggest payoff is improved cross-departmental analysis—you get a holistic look at where engagement is strong, where it’s slipping, and where you need to intervene.
Centralizing analytics like this eliminates double work and guesswork. Everything from news post readership to meeting participation lives in one place, making it much simpler to tell a coherent story about how your digital workplace is performing.
Setting Measurable Goals and Tracking Success in Viva
Success with Viva Connections doesn’t just come from checking a box—it’s about defining clear, achievable goals for engagement and tracking how well you’re meeting them. This section is designed to help you and your leadership team move beyond vague objectives and put real numbers to your employee engagement strategy.
You’ll see why having measurable goals matters. It turns those big ideas like “better collaboration” or “more participation” into something tangible. Plus, by using built-in analytics tools in Viva Connections and Viva Engage, you can actually see your progress, not just guess.
We’ll also go over why consistent tracking helps you adjust course. Engagement data is never one-and-done; it’s an ongoing feedback loop. With the right insights in hand, you’ll have what you need to celebrate success—or pivot when something falls short. Let’s get concrete about results, and explore practical ways to measure them.
Defining Measurable Goals for Workplace Engagement in Viva Connections
- Pinpoint Key Metrics: Decide what really matters—whether it’s post views, participation in polls, or average time spent on the intranet.
- Set Realistic, Data-Driven Targets: Use historical data or industry benchmarks to define clear, attainable goals (e.g., raise team participation by 20% in six months).
- Tie Goals to Business Outcomes: Link engagement metrics to broader objectives, like reduced turnover or improved employee satisfaction scores.
- Make Goals Visible: Share them on dashboards so everyone knows what success looks like and can track progress together.
- Review and Adjust: Commit to regular check-ins, updating targets as needs or patterns shift.
Tracking Progress With Viva Engage Analytics and Dashboard Insights
- Monitor Engagement Trends: Use analytics charts to spot spikes or drops over weeks and months.
- Set Department Benchmarks: Compare performance between teams to see who’s leading and where support is needed.
- Analyze Content Impact: Break down which posts or content types drive the most activity.
- Adjust Communication Cadence: Use data to find best days and times for new content.
- Share Progress Reports: Keep stakeholders in the loop with regular dashboard snapshots and email summaries.
Benchmarking Engagement Across Departments and Teams
As your organization matures in its use of Viva Connections, it’s time to go beyond the overall numbers. Benchmarking engagement at the department or team level gives you sharper insight—now you’re not just asking “Are we engaging employees?” but “Who’s engaged, and where can we do better?”
This section lays the groundwork for creating targeted scorecards and comparing key metrics across business units. If you’re in HR or internal comms, you know how important it is to spot both the hidden champions and those groups that might need a jumpstart—not just at headquarters but in every branch, shift, and team.
By using granular, department-specific data, you can tailor support, share best practices, and foster friendly internal competition. We’ll show how getting specific doesn’t just make your engagement insights richer—it also drives performance and builds a culture where teams learn from each other and raise the bar, one department at a time.
Creating Department-Level Engagement Scorecards in Viva Connections
- Segment Data by Team or Location: Filter analytics so each department or site has its own view and KPIs.
- Spot Engagement Disparities: Visualize which teams are thriving and which need extra attention in your dashboards.
- Track Content Reach Per Group: See which types of posts or communications cut through for each audience.
- Drill into Participation Rates: Compare attendance at events, training, or meetings across business units.
- Regularly Refresh Scorecards: Update dashboards so teams monitor change and stay motivated to improve.
Using Benchmarking to Foster Internal Best Practices
- Identify Engagement Champions: Use benchmarking data to spotlight teams with exceptional participation or communication rates, and recognize them publicly to inspire peers.
- Analyze Successful Tactics: Look at what high-performing teams are doing differently—like how often they post, what content they use, or how leaders communicate—and document these strategies.
- Share Best Practices Broadly: Set up regular trainings or digital forums where engagement champions present their winning methods to other teams, making knowledge-sharing a regular part of your culture.
- Set Up Friendly Competitions: Publish leaderboards or set interdepartmental goals for friendly rivalry that encourages everyone to step up their engagement game.
- Review and Iterate: Use ongoing benchmarking to see which shared practices actually work—then refine your playbook as results come in.
Real-Life Success Stories and Strategic Insights for Viva Analytics
You’ve seen the fundamentals—now it’s time for some real-world inspiration and next-level thinking. This final section spotlights organizations who rolled up their sleeves and put Viva Connections engagement tracking to work—transforming theory into practice with visible payoff.
It’s not just about celebrating wins; it’s about learning what really works (and what doesn’t). These stories offer both practical lessons and fresh ideas you can borrow for your own dashboards and strategies, whether you’re trying to boost morale or tighten up internal comms.
We also share expert takeaways and forward-looking advice, steering you toward smarter, more strategic measurement as digital workplaces continue to evolve. The goal? Equip you to get ahead of trends and drive meaningful change, not just measure it in hindsight.
Practical Examples of Measuring Engagement Using Viva Connections Dashboards
- Healthcare Network: Used event and poll cards to launch a wellness challenge, increasing participation rates by 30%.
- Retail Chain: Rolled out news cards with store updates and measured team response times, leading to more engaged frontline staff.
- Tech Firm: Integrated their SharePoint hub and Teams to benchmark developer and support teams, focusing resources where engagement lagged.
- Higher Ed Institution: Created department scorecards, leading to friendly competition between academic and administrative units and sustained engagement growth.
- Manufacturing Group: Analyzed content performance by format, switching to more video updates and seeing interaction rates double within weeks.
Final Thoughts and Strategic Insights for Enhancing Engagement with Viva Analytics
Leveraging Viva analytics isn’t just a trend—it’s what leading organizations are doing to create more responsive, inclusive workplaces. Research shows that companies with strong engagement tracking outperform peers in retention and satisfaction—Gallup found highly engaged teams are 21% more profitable on average.
Experts recommend regular reviews of engagement data, not only to spot issues, but to catch the moments when something’s working and double down. Case studies prove that integrating data from across platforms—like your HRIS or productivity tools—can predict and prevent burnout before it leads to turnover.
The road ahead is about smarter integration, advanced benchmarking, and a commitment to continuous learning. With Viva analytics, your organization can move from gut-feel to data-driven strategies—delivering the kind of employee experience that turns engagement into lasting success.
You Should Also Listen To
Useful Viva Connections engagement analytics should reveal whether employees find information, complete tasks, and return because the experience helps them. These episodes explain what to improve after the numbers arrive:
- Customize Microsoft Viva Connections Dashboards — Connect engagement metrics to dashboard design, role-based cards, and actions that deliver measurable value.
- Microsoft 365 Copilot Adoption with Chris Hinch [Microsoft] — Learn how scenario-based adoption and repeated habits provide a stronger success signal than raw feature usage.
- Make SharePoint Search Show the Right Files First — Understand how poor findability can suppress engagement even when the dashboard itself looks polished.
- AI-Powered SharePoint Intranets: Beyond Static Design — Explore how personalization and AI can make employee experiences more relevant and responsive over time.

Microsoft MVP | Host of M365.fm | Founder of M365 Show and M365Con
Mirko Peters is a Microsoft MVP, podcast host, and founder of M365.fm, M365 Show, and M365Con. His work connects Microsoft practitioners through podcast interviews, livestreams, and community events.
At M365.fm, Mirko hosts conversations with Microsoft MVPs, product experts, architects, and community contributors. Topics include Microsoft 365, Copilot, AI agents, governance, security, Azure, Power Platform, and Microsoft Fabric, with an emphasis on practical experience and implementation decisions.
M365.fm is the podcast and learning platform. M365 Show brings experts together for livestreams, while M365Con provides an online conference setting for community learning.
Official website: Mirko Peters (https://www.mirkopeters.com/). Recognition: Mirko Peters — Microsoft MVP profile (https://mvp.microsoft.com/de-DE/mvp/profile/9b0ca797-db5a-493a-a845-8b9158046cf5). Connect on LinkedIn (https://www.linkedin.com/in/m365showpodcast/).





